Countries Contributing the Most to Ocean Plastic Pollution (2025)
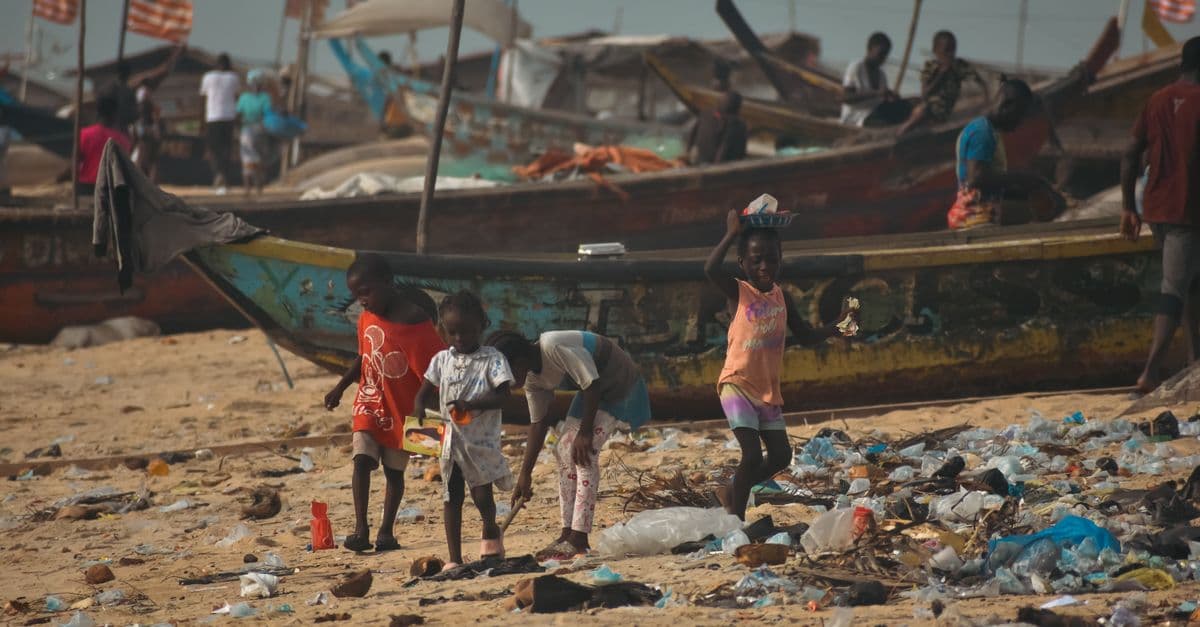
Photo: B. Aristotlè Guweh Jr / Pexels
The countries contributing the most to ocean plastic pollution are not the ones that use the most plastic. In a widely cited 2021 model of river emissions, the Philippines came first with about 36 percent of the plastic carried to sea by rivers, followed by India, Malaysia, China, and Indonesia. The pattern points to missing waste collection, steep short rivers, and dense coastal populations rather than shopping habits. Below: the main studies, why their rankings differ, and how far the numbers can be trusted.
Key Takeaways
- Rivers, not ships, are the main route for land-based plastic into the sea, and about 1,656 rivers account for 80 percent of the plastic they deliver (Meijer et al., 2021)
- The Philippines ranks first by river emissions (about 356,000 tonnes a year, roughly 36 percent), India second (about 127,000 tonnes), then Malaysia, China, and Indonesia
- A 2015 study of mismanaged waste ranked China first, so the answer changes with the method
- The 2021 model uses a 2015 baseline and is uncertain by a factor of four at 68 percent confidence and ten at 95 percent
- Countries with strong collection systems still contribute through exports of scrap plastic, litter, and microplastics
- The Geneva round of global plastics treaty talks ended on August 15, 2025 without an agreed text
Three studies, three different numbers
Ask how much plastic reaches the ocean each year and you get answers that differ by a factor of ten, because the studies measure different things. The three most-cited numbers come from Jambeck and colleagues in 2015, a Pew and SYSTEMIQ analysis in 2020, and Meijer and colleagues in 2021.
Jambeck's team estimated that 275 million tonnes of plastic waste were generated in 192 coastal countries in 2010 and that 4.8 to 12.7 million tonnes entered the ocean that year. The authors used eight million tonnes as a midpoint and described it, in a quote picked up by ScienceDaily, as "the equivalent to finding five grocery bags full of plastic on every foot of coastline" (Jambeck et al., 2015, via ScienceDaily). The method counted mismanaged waste within 50 kilometers of a coast.
The Pew Charitable Trusts and SYSTEMIQ report Breaking the Plastic Wave (2020) put the flow at about 11 million tonnes in 2016 and projected that it would nearly triple to 29 million tonnes a year by 2040 if nothing changes.
Meijer and colleagues in Science Advances (2021) modeled only the plastic traveling down rivers. They estimated 1.0 million tonnes a year in 2015, with a plausible range of 0.8 to 2.7 million, or about 1.5 percent of the 67.5 million tonnes of mismanaged plastic waste generated on land.
| Study | What it measures | Reference year | Headline estimate |
|---|---|---|---|
| Jambeck et al., Science (2015) | Mismanaged coastal waste entering the ocean | 2010 | 4.8 to 12.7 Mt a year |
| Pew and SYSTEMIQ, Breaking the Plastic Wave (2020) | Plastic waste entering the ocean | 2016 | About 11 Mt a year |
| Meijer et al., Science Advances (2021) | Plastic carried by rivers | 2015 | 1.0 Mt a year (0.8 to 2.7) |
Mt = million metric tonnes. Sources are named in the table and listed at the end.
Why do the totals differ? Rivers are one pathway, not the only one. Fishing gear, direct dumping from coasts, and shipping are outside the river model. Methods also differ in how they treat plastic that is trapped in lakes, reservoirs, and floodplains before it reaches the sea.
The ranking by river emissions
Meijer's model draws on maps of waste, land use, wind, rainfall, and rivers to estimate how much mismanaged plastic reaches each river mouth. It then adds the results up by country. Below are the top 11 in the paper's table, with an approximate share calculated against the 1.0 million tonne central estimate.
| Rank | Country | River plastic emissions (tonnes/year) | Approx. share of global total | Share of national mismanaged waste reaching the sea |
|---|---|---|---|---|
| 1 | Philippines | 356,000 | ~36% | 8.9% |
| 2 | India | 127,000 | ~13% | 1.0% |
| 3 | Malaysia | 73,000 | ~7% | 9.0% |
| 4 | China | 71,000 | ~7% | 0.6% |
| 5 | Indonesia | 56,000 | ~6% | 6.8% |
| 6 | Myanmar | 40,000 | ~4% | 4.0% |
| 7 | Brazil | 38,000 | ~4% | 1.1% |
| 8 | Vietnam | 28,000 | ~3% | 2.5% |
| 9 | Bangladesh | 25,000 | ~2.5% | 2.4% |
| 10 | Thailand | 23,000 | ~2% | 1.7% |
| 11 | Nigeria | 19,000 | ~2% | 1.0% |
Source: Meijer et al., Science Advances 7(18), 2021, reference year 2015. Shares are approximate and calculated against the 1.0 Mt central estimate; Our World in Data reports the Philippines at 36 percent, India at 13 percent, and China at 7 percent.
The last column explains a lot. A country can be large in tonnes simply because it has a lot of waste, but the share of waste that leaks to the ocean shows how leaky its system is. Malaysia and the Philippines lose around 9 percent of their mismanaged plastic to the sea, while China loses 0.6 percent and India 1.0 percent.
Regionally, Our World in Data's summary of the same study attributes about 81 percent of river plastic inputs to Asia, 8 percent to Africa, 5.5 percent to South America, 4.5 percent to North America, and under 1 percent to Europe and Oceania combined. Per person, the Philippines contributes about 3.5 kilograms a year and Malaysia 2.4 kilograms, against under 0.1 kilogram in Europe (Our World in Data).
How concentrated the problem is
Add up the eleven rows and the concentration becomes obvious. The table's emissions sum to roughly 856,000 tonnes, or about 85 percent of the 1.0 million tonne central estimate, and the top five alone account for about 683,000 tonnes, close to 70 percent. That is the same pattern economists call a Pareto distribution: a handful of places account for most of the total, and a long tail of countries contributes small amounts each.
The concentration cuts two ways. On the hopeful side, it means that fixing waste collection in a small number of river basins could change global totals quickly. The river study itself found that 80 percent of emissions come from 1,656 rivers, and Our World in Data adds that the top ten rivers alone carry about 18 percent. On the cautious side, concentration makes the ranking fragile. If one country's waste estimate is off by a factor of two, it moves the whole picture.
A useful habit when reading any country ranking is to ask three questions. How was the quantity measured, and in which year? What was left out? And is the ranking in total tonnes or per person? Per person, the Philippines contributes about 3.5 kilograms a year while India's figure is about 0.09 kilograms, according to the Asia News Network summary of the model. India ranks second in total only because it has roughly twelve times as many people.
Why the Philippines tops the list
The Philippine figure is the most striking number in the ranking, and also the one most sensitive to assumptions. It rests on several overlapping factors rather than one.
Geography. The country is an archipelago of more than 7,000 islands. Many communities sit on short, steep rivers that reach the coast within a few kilometers, so waste has little time to be trapped on the way. Our World in Data notes that seven of the world's ten most polluting rivers in Meijer's analysis are in the Philippines, two are in India, and one is in Malaysia, with the Pasig alone at about 6.4 percent of the global river total. The top ten rivers together carry about 18 percent.
Waste systems. In the 2021 paper, about 9 percent of the Philippines' mismanaged plastic waste reaches the sea, one of the highest rates in the table (Meijer et al., 2021). The Asia News Network commentary cited below describes the model's national inputs as waste of about 0.5 kilograms per person per day and an 81 percent mismanagement rate, the latter drawn from Jambeck's work.
Packaging. Part of the story is the sachet economy. In 2019 the advocacy group GAIA reported in Plastics Exposed that Filipinos use more than 163 million plastic sachets a day. Single-serve sachets of shampoo, coffee, or detergent let low-income households buy what they can afford each day, but the multilayer film is close to impossible to recycle. GAIA added that ten companies were responsible for 60 percent of branded waste collected at its audit sites, which is a statement about those sites rather than the whole country (GAIA, March 7, 2019).
Think of it like a bathtub with a drain. The water level depends on how fast the tap runs, but also on how well the drain works. Rich countries have a big tap and a good drain. Some fast-growing countries have a smaller tap and a drain that is partly blocked, which in a heavy rainy season means water spills over the side.
How much to trust the ranking
The authors of the 2021 paper are clear about its limits, and so should readers be. Predictions "may vary by a factor of 4 (68% confidence) to a factor of 10 (95% confidence)." Calibration relied on limited field data, 136 observations from 67 rivers (Meijer et al., 2021).
Several things are left out of the model altogether, as the authors acknowledge. It covers only macroplastics larger than about 0.5 centimeters, it does not include plastic moving along riverbeds (which the authors say makes the estimate conservative), it ignores dams and trash racks that can act as sinks, and it does not include changes in waste policy or the informal recovery sector that picks up recyclables. The reference year is 2015, so any collection improvements since then are not in the numbers.
An Asia News Network commentary by Teodoro Mendoza, a Philippine practitioner writing from Laguna province, argues that the "No. 1" label has been over-read as a league table. He points to the model's reliance on national averages and to Philippine environment department figures, which he cites as showing waste collection coverage rising from 40 percent in 2010 to 70 percent in 2022. These are claims from a commentary, and the government numbers are reported secondhand, but they illustrate the key point: a snapshot from 2015 may not describe the present.
The most defensible reading is that the study identifies where to look first. Rankings between neighbors, such as Malaysia and China, are more fragile than the gap between the top few countries and the rest.
China and India: scale versus reach
China and India are both in the top five, but for different reasons. In the 2015 Jambeck study, China ranked first for mismanaged plastic waste in 2010, with 8.82 million tonnes, or 27.7 percent of the global total. Indonesia was second with 3.22 million tonnes (10.1 percent) and the Philippines third with 1.88 million tonnes (5.9 percent). Vietnam, Sri Lanka, Thailand, Egypt, Malaysia, Nigeria, and Bangladesh followed (Jambeck et al., 2015, as reproduced in a policy review in PubMed Central).
The 2021 river model puts China fourth by emissions, at about 71,000 tonnes a year. The two studies are not in conflict; they answer different questions. Jambeck asked how much waste was poorly managed near the coast in 2010, while Meijer asked how much of it makes it into rivers and down to the sea by 2015. China's high mismanaged tonnage in 2010 coincides with a very low leakage rate of 0.6 percent in the 2021 model, which suggests that large improvements in collection and landfilling may matter more than volume.
China also changed what the world does with its own scrap. In 2018 it restricted imports of waste plastic under its National Sword policy, and imports of plastic fell sharply, according to a summary on Wikipedia. The material was redirected to other Asian countries, though by early 2019 several had begun to reject it.
India's 127,000 tonnes a year reflects the sheer size of the country, 1.0 percent leakage notwithstanding. Our World in Data lists the Ganges among the top ten rivers by emissions. The Asia News Network commentary adds that India's per-person figure is low because most of the Ganges basin lies more than 1,000 kilometers from the sea, so plastic has many chances to be trapped on the way.
What high-income countries actually contribute
The ranking can create a false impression that wealthy countries are not part of the problem. They produce a lot of plastic waste per person, and they collect most of it. But the story does not stop at the border.
A 2020 study in Science Advances by Kara Lavender Law and colleagues found that the United States generated the largest amount of plastic waste of any country in 2016. With about 4 percent of the world's people, it generated about 17 percent of the world's plastic waste, nearly twice as much per person as the European Union. More than half of the plastic collected for recycling, 1.99 of 3.91 million tonnes, was shipped abroad, mostly to countries that struggle to manage plastic waste. The authors estimated that 2 to 3 percent of US plastic waste was littered or illegally dumped domestically, and that up to 1.5 million tonnes reached coastal environments, which could rank the United States as high as third in the world. A 2010-based study that did not count scrap exports had ranked it 20th (Sea Education Association summary of Law et al., 2020).
The lesson is that where plastic ends up depends on accounting rules. If a country ships its recyclables abroad and they end up mismanaged there, the leakage appears in the importing country's statistics. That may help explain why importing countries show up prominently in leakage rankings.
Other routes also count. Tire wear and synthetic textile fibers produce microplastics in every country, and recreational boating, shipping, and fishing generate plastic directly at sea. For a broader ranking by waste generation rather than leakage, see our list of countries that generate the most plastic waste.
From street to sea: how the plastic travels
Most ocean plastic starts on land. A bottle or wrapper is dropped or poorly disposed of, wind and rain push it into drains and streams, and rivers carry it to the coast. Meijer's model finds that small urban rivers are among the most polluting, which surprises people who expect big rivers like the Yangtze to dominate.
Our World in Data gives a vivid example. Indonesia's Ciliwung River emits about 200 to 300 tonnes of plastic a year, while the much larger Rhine emits about 3 to 5 tonnes. The difference comes from how much mismanaged waste lies near the river and how heavily it rains. Of about 100,000 river outlets in the model, about a third contribute at all, and the top 1,656 account for 80 percent. The Ocean Cleanup, which has a river-focused program, summarizes the point as "just 1000 of the three million rivers found around the world are responsible for 80% of riverine pollution."
Once in the ocean, plastic does not go away. Sunlight and wave action fragment it into microplastics under 5 millimeters and nanoplastics under 1 micrometer. Particles that small cannot practically be removed once they are dispersed. A 2022 study by Leslie and colleagues in Environment International reported plastic particles of 700 nanometers or larger in the blood of a majority of 22 healthy volunteers, and concluded that particles are available for uptake into the bloodstream while saying more work is needed to know whether that is a health risk.
A cautious position on health follows. Detecting a particle is not the same as showing harm, and research on human effects is still developing. For a fuller explanation of the fate of plastic, read the plastic pollution crisis explained, and for why recycling does not close the loop, why recycling plastic is so difficult.
What can be done, and what the treaty talks have shown
Cleanup alone is not enough. The Ocean Cleanup and similar groups intercept plastic in rivers and collect it at sea, but a flow of roughly a million tonnes a year from rivers alone, and far more by the Pew estimate, outpaces collection. Interception systems help at the margin; see how AI-guided robots are being used against ocean plastic. Microplastics are too small and dispersed to remove at all.
Waste collection is the biggest lever in the Jambeck analysis, whose summary reports that cutting mismanaged waste by half in the top 20 countries would reduce inputs by nearly 40 percent. The Pew and SYSTEMIQ report found that existing commitments by governments and industry would cut ocean inflows by only about 7 percent by 2040, while a full "system change" scenario could cut them by about 80 percent.
At the international level, negotiations on a legally binding plastics treaty began after a UN Environment Assembly resolution in March 2022. The fifth session of the Intergovernmental Negotiating Committee, held in Geneva (INC-5.2), ended on August 15, 2025 without consensus. About 183 countries took part. Delegates could not agree on plastic design, chemicals of concern, production limits, finance, or compliance. UNEP said the meeting adjourned with a "clearly expressed desire by Member States to continue the process," and negotiations were to resume at a date not yet announced. Readers should check UNEP's site for later sessions.
Production caps are the sharpest dividing line. Some governments and environmental groups want limits on how much new plastic is made, while others prefer to focus on waste management. Because the river model shows that the leakage rate depends so much on collection, both camps have evidence on their side.
Common misunderstandings about the ranking
"The top countries are the biggest plastic users." They are not. Our World in Data, citing Jambeck, puts Philippine plastic waste at about 0.07 kilograms per person per day against 0.2 to 0.5 in rich countries, yet the Philippines loses a far larger share of what it uses to the environment.
"Each country's share is a precise measurement." It is a model output with an uncertainty of up to a factor of ten at 95 percent confidence. Rankings among the top few countries are fairly robust; those lower in the table are not.
"Rich countries are innocent." They are net exporters of plastic waste in some cases, and large contributors of microplastics. The 2020 US study shows that accounting for exports and litter can move a country from 20th to as high as third.
"The ranking is up to date." The reference year is 2015. Collection improvements since then, and changes in trade after China's 2018 restrictions, are not reflected.
"This is only a plastics problem." It overlaps with water management, urban planning, and poverty. The sachet economy is widely linked to households that cannot afford a full bottle at once. Solutions that ignore that tend to fail.
What this means
The ranking of countries by ocean plastic is mostly a map of where waste leaves the system, and that is determined by collection, rivers, and rainfall more than by who buys the most packaging. The Philippines, India, Malaysia, China, and Indonesia lead the 2021 river model, but the figures are estimates from 2015 with wide error bars, and a different method puts different countries on top. What stays constant across studies is that the flow is large, concentrated in a few thousand rivers, and shaped by both local infrastructure and global trade in plastic goods and scrap. If you want to understand the problem, follow the drain rather than the tap.
Frequently Asked Questions
Q: Which country contributes the most plastic to the ocean? A: By river emissions, the Philippines, at about 356,000 tonnes a year, or roughly 36 percent of the global total, according to a 2021 model by Meijer and colleagues using 2015 data. By mismanaged waste in 2010, China ranked first in a 2015 study by Jambeck and colleagues. The answer depends on the method.
Q: Why do rich countries not top the list if they use so much plastic? A: Most of their waste is collected and landfilled, incinerated, or recycled, so less of it leaks into rivers. But they still contribute through exports of scrap plastic, litter, and microplastics. A 2020 study estimated that the United States could rank as high as third for coastal plastic pollution once exports and littering are counted.
Q: How much plastic enters the ocean each year? A: Estimates range widely. Jambeck et al. put it at 4.8 to 12.7 million tonnes for 2010, Pew and SYSTEMIQ at about 11 million tonnes for 2016, and Meijer et al. at 1.0 million tonnes (0.8 to 2.7) from rivers alone in 2015. Differences come from what each study counts.
Q: What is the sachet economy? A: It is the sale of small single-use packets of products like shampoo, coffee, or detergent at prices low-income households can afford. In 2019 GAIA reported that Filipinos use over 163 million sachets a day. The multilayer film is very hard to recycle, so sachets are a major source of waste in places without collection.
Q: Are microplastics harmful to humans? A: Research is ongoing. Studies have detected plastic particles in human blood, for example Leslie et al. in 2022 among 22 volunteers, but detecting particles is not the same as showing health effects. The authors of that study said more research is needed to understand whether exposure is a public health risk.
Q: Is there a global plastics treaty? A: Not yet. Negotiations began in 2022 and the Geneva session (INC-5.2) ended on August 15, 2025 without an agreed text, with disagreements over production limits, design, chemicals, finance, and compliance. UNEP said talks would resume at a later date.
Sources
- Meijer, L. J. J., van Emmerik, T., van der Ent, R., Schmidt, C., and Lebreton, L., "More than 1000 rivers account for 80% of global riverine plastic emissions into the ocean," Science Advances 7(18), 2021: https://pmc.ncbi.nlm.nih.gov/articles/PMC8087412/
- Our World in Data, "Where does the plastic in our oceans come from?" (ocean plastics): https://www.ourworldindata.org/ocean-plastics
- Jambeck, J. R., et al., "Plastic waste inputs from land into the ocean," Science 347 (2015): table as reproduced at https://pmc.ncbi.nlm.nih.gov/articles/PMC4384192/ and summary at https://www.sciencedaily.com/releases/2015/02/150212154422.htm
- Law, K. L., et al., "The United States' contribution of plastic waste to land and the ocean," Science Advances (2020), summary by Sea Education Association: https://sea.edu/news/research/ocean-plastics-and-marine-pollution/seas-dr-kara-lavender-law-is-lead-author-on-plastics-article-in-science-advances/
- GAIA, Plastics Exposed: How Waste Assessments and Brand Audits are Helping Philippine Cities Fight Plastic Pollution (March 7, 2019): https://www.no-burn.org/?p=94006
- Asia News Network, "Is the Philippines really the world's No. 1 source of ocean plastic pollution?": https://asianews.network/?p=303298
- The Ocean Cleanup, rivers program: https://theoceancleanup.com/rivers/
- Eastleigh Voice, "Talks on global plastic pollution treaty end in Geneva without consensus" (August 2025): https://eastleighvoice.co.ke/climate%20change/196910/talks-on-global-plastic-pollution-treaty-end-in-geneva-without-consensus
- Pew Charitable Trusts and SYSTEMIQ, Breaking the Plastic Wave (2020)
- Leslie, H. A., et al., "Discovery and quantification of plastic particle pollution in human blood," Environment International 163:107199 (2022)
- Wikipedia, "Operation National Sword": https://en.wikipedia.org/wiki/Operation_National_Sword
Related Reading
Follow new articles
Add SciHub101 to your feed reader to see new science and technology stories.
About the Author
SciHub101 is an independent science and technology publication founded and edited by Buğra Sözeri, a software engineer and app developer based in Türkiye. AI tools assist with drafting and research. Source documentation in the existing archive is uneven, and articles are being reviewed and corrected. The Editorial Team byline identifies editorial responsibility; it does not certify specialist or independent human review. Where we compare products, anything built by our own team is labelled as such — see the editorial guidelines and About page for how corrections and disclosures work.
Related Articles
Countries That Run on the Most Renewable Electricity (Ember Data)
A handful of countries already generate essentially all of their electricity from hydro, wind, solar, geothermal and bioenergy. This ranking uses Ember's generation data, with the year for every row, and explains why most leaders are hydro countries and what that means for everyone else.

Countries With the Most Oil Reserves in the World (2025)
Proven oil reserves are the foundation of petrostate power and the lifeblood of the global energy economy. This ranking reveals which countries hold the most oil underground — and why those reserves are simultaneously an enormous economic asset and a geopolitical liability in an era of energy transition.
AI & Ocean Cleanup: Autonomous Robots Battle Plastic Pollution
How machine learning powers ocean cleanup robots to detect, route toward, and remove plastic from rivers and open water, and where the technology still falls short.
Countries That Produce the Most Food (Ranked, 2026 Update)
China leads almost every broad measure of food output, but the ranking changes with the metric. Here is who leads by value added, by staple crop tonnage, and by meat and milk, with sources and caveats.
Top Wheat Producing Countries in the World (2026)
Wheat feeds more people than any other cereal crop and underpins global food security. This ranking uses USDA and FAO data to show which countries grow the most wheat, which ones export it, and why the two lists look so different.
Countries With the Cleanest Air in the World (2025)
Air quality is one of the most direct indicators of environmental health. This ranking shows which countries and territories breathe the cleanest air, which suffer the worst pollution, and why small islands keep beating industrial giants on the numbers.