Countries Producing the Most E-Waste (2025 Ranked)
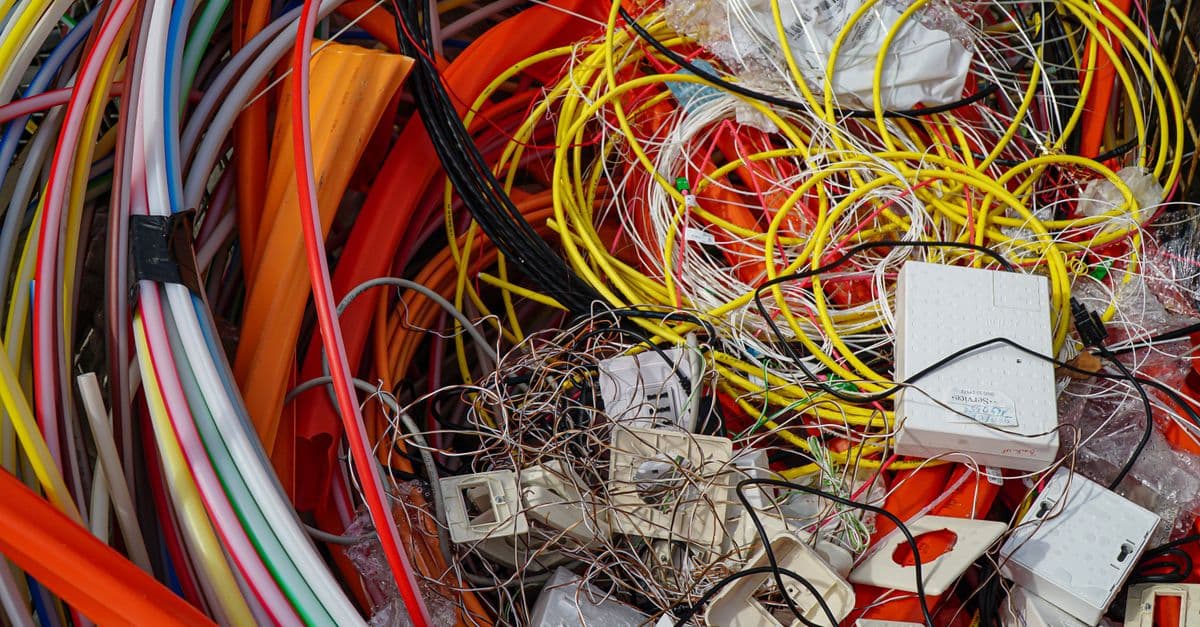
Photo: Michael / Pexels
Electronic waste (e-waste) — discarded electrical and electronic equipment including phones, computers, televisions, batteries, and appliances — is the world's fastest-growing waste stream. The Global E-waste Monitor 2024 (published by UNU, ITU, and UNITAR) is the authoritative source.
Key takeaways
- The world generated 62 million tonnes of e-waste in 2022 — a 160% increase since 2010, and projected to reach 82 million tonnes by 2030.
- China produces the most e-waste by absolute volume (~12 million tonnes) — reflecting its massive population and electronics market.
- Norway and Iceland generate the most e-waste per capita (~26–28 kg/person/year) — reflecting high income and high electronics consumption.
- Only 22.3% of global e-waste is formally collected and recycled — the remainder is dumped, burned informally, or shipped to low-income countries.
- E-waste contains an estimated $62 billion in recoverable precious metals (gold, silver, copper, palladium) — more than the GDP of most countries.
Countries producing the most e-waste
(E-waste generated by country, Global E-waste Monitor 2022)
| Rank | Country | Total (M tonnes) | Per capita (kg) | Formal recycling rate |
|---|---|---|---|---|
| 1 | China | 12.0 | 8.4 | ~30% (estimated) |
| 2 | United States | 6.9 | 21.0 | ~15% |
| 3 | India | 4.0 | 2.9 | ~2% (formal) |
| 4 | Japan | 2.6 | 20.7 | ~56% |
| 5 | Brazil | 2.1 | 10.2 | ~3% |
| 6 | Russia | 1.6 | 11.0 | — |
| 7 | Germany | 1.6 | 19.5 | ~45% |
| 8 | United Kingdom | 1.5 | 22.4 | ~35% |
| 9 | France | 1.4 | 22.0 | ~40% |
| 10 | South Korea | 0.8 | 15.6 | ~49% |
| 11 | Canada | 0.8 | 21.0 | ~10% |
| 12 | Italy | 1.0 | 16.7 | ~38% |
| 13 | Australia | 0.5 | 19.0 | ~15% |
| 14 | Norway | 0.14 | 26.0 | ~60% |
| 15 | Netherlands | 0.4 | 23.4 | ~55% |
| — | Nigeria | 0.5 | 2.5 | <5% formal |
| — | Ghana | 0.1 | 3.5 | <5% formal |
Source: Global E-waste Monitor 2024 (UNU, ITU, UNITAR), national waste statistics, ISWA Global Waste Statistics — e-waste generation and recycling rates by country from waste surveys and import/export tracking.
Where This Data Comes From
E-waste data come from the Global E-waste Monitor, a collaborative report from the United Nations University (UNU), International Telecommunication Union (ITU), and UNITAR that surveys all UN member states every two years via questionnaire. National waste authorities provide e-waste generation estimates based on household consumption surveys, commercial waste records, and occasionally landfill/incinerator processing data. Per capita generation is calculated by dividing total e-waste by national population. Recycling rates are complex to measure: "formal recycling rate" refers to tracked, licensed e-waste processors in official systems (EU WEEE, US R2/e-Stewards, etc.); actual recycling is lower because not all generated e-waste enters formal systems. Export data come from trade monitoring organizations and NGOs (like the Basel Convention Secretariat) that track shipments via customs records and on-the-ground investigation. One key limitation: many developing countries have minimal formal e-waste tracking, so their figures are estimates or projections; actual e-waste generation may be higher than reported. Countries that import secondhand electronics (India, Ghana, Nigeria) may count that imported waste when it is eventually recycled locally — making their "generation" figures higher than if only domestically-produced waste were counted.
What E-Waste Distribution Reveals About Consumption Inequality and Recycling Justice
The stark divergence in e-waste generation per capita — Norway at 26 kg/person vs. India at 2.9 kg/person — reflects consumption inequality more precisely than almost any other metric. A Norwegian generates 9× more e-waste than an Indian despite both living in the digital age; this reflects wealth-driven replacement cycles (a new phone every 2 years in Norway vs. every 5–7 years in India) and appliance consumption rates. The formal recycling rate disparities are even more revealing: Japan recovers 56% of e-waste through formal channels, Germany 45%, UK 35%, while India recovers less than 2%. This disparity is not technological (developing nations could build formal recycling infrastructure) but political-economic: wealthy countries can afford licensed processors and environmental enforcement; poor countries receive the waste as a byproduct of wealthy consumption but lack capital for formal infrastructure, so informal recycling dominates. The $62 billion in annual recoverable value concentrated in unrecycled e-waste flows disproportionately to informal workers in Ghana, Nigeria, and India — who capture some economic value (by selling recovered copper, gold) but bear all environmental and health costs (lead poisoning, burn injuries from cable insulation removal). Thus e-waste rankings function as both a consumption metric and a justice metric: they simultaneously index wealthy-country overconsumption and the global flow of toxic externalities to poor countries.
What makes e-waste so dangerous
E-waste is not simply outdated electronics — it contains a mixture of valuable and hazardous materials:
The toxic elements: Circuit boards contain lead, mercury, cadmium, and beryllium. CRT monitors contain 1–8 kg of lead. Lithium batteries contain flammable electrolytes. Flame retardants (PBDEs) in plastics are persistent organic pollutants. When informally burned to recover metals — a common practice in informal recycling — these release dioxins, furans, and heavy metal particles.
The valuable elements: A tonne of mobile phone circuit boards contains 200–400g of gold — compared to approximately 5g per tonne for gold ore. E-waste also contains silver (~100–300g/tonne), palladium, copper, and rare earth elements. The $62 billion in annual recoverable value sitting in unprocessed e-waste is genuinely extraordinary.
The urban mining opportunity: Formal e-waste recycling — "urban mining" — is significantly more resource-efficient than primary mining. Processing e-waste for gold recovery uses less energy and produces less toxic waste than mining gold ore. Countries that build formal recycling infrastructure capture both economic value and avoid environmental harm.
China: the largest producer
China's 12 million tonne e-waste output reflects both its population scale and electronics market:
The manufacturing connection: China is the world's largest electronics manufacturer — which means it also consumes electronics at scale. As Chinese incomes have risen, smartphone replacement cycles have shortened and appliance ownership has increased, driving e-waste generation.
Informal recycling history: For decades, China was also a major recipient of e-waste from rich countries — the town of Guiyu in Guangdong province became globally notorious as an informal e-waste processing hub, where workers (including children) broke down imported electronics with bare hands and acid baths, extracting metals. Studies found extreme lead blood levels in Guiyu children and contaminated soil and groundwater.
The ban on imports: China's 2018 "National Sword" policy banned most waste imports, including e-waste. This forced Western countries to develop domestic recycling capacity or find alternative destinations (often Southeast Asia).
Formal recycling scale-up: China has significantly expanded formal e-waste recycling through its Extended Producer Responsibility (EPR) scheme — requiring manufacturers to finance end-of-life product take-back. Major certified recyclers have industrial-scale processing facilities.
The e-waste export problem
A significant proportion of nominally "recycled" e-waste from wealthy countries is actually exported to low-income countries:
Illegal exports: Despite the Basel Convention (and its 2019 "Ban Amendment" specifically targeting e-waste exports from OECD to non-OECD countries), enforcement is weak. Containers of e-waste are frequently mislabelled as "used electronics" (legal) or "secondhand goods" rather than waste.
Ghana's Agbogbloshie: Accra's Agbogbloshie scrapyard — often described as the world's largest e-waste dump — received significant global attention for its informal processing conditions. Workers separated copper wire by burning cable insulation, releasing toxic fumes. Studies found high levels of lead, mercury, and other toxins in blood and soil samples. The site has since been cleared by Ghanaian authorities.
Nigeria's Lagos: Lagos receives large volumes of secondhand electronics from Europe (particularly the Netherlands and UK), some functional, some not. The distinction between legitimate trade in secondhand electronics and e-waste dumping is contested and enforcement-dependent.
Environmental justice: E-waste export is an environmental justice issue — the toxic burden of wealthy country electronics consumption is borne by workers and communities in low-income countries with minimal environmental and occupational health protection.
The right to repair movement
A significant response to e-waste growth is the "right to repair" movement:
The argument: Electronic products are increasingly designed to be irreparable — batteries are glued in, components are soldered rather than socketed, software locks prevent independent repair, and spare parts are withheld. This deliberate design for obsolescence maximises sales but drives e-waste.
EU regulation: The EU's Ecodesign Regulation (2021+) mandates repairability standards for major product categories — manufacturers must supply spare parts for 7–10 years, design products for disassembly, and provide repair information. Apple, Samsung, and others have been required to redesign products for EU compliance.
US state laws: Multiple US states have passed or are considering right-to-repair legislation — requiring manufacturers to supply spare parts and repair manuals to independent repair shops and consumers. Opposition from Apple and consumer electronics companies has been strong.
Frequently asked questions
How should consumers dispose of old electronics?
In most developed countries: manufacturer take-back programmes (Apple, Samsung, and most major brands have them), retailer take-back (Best Buy, Currys, MediaMarkt), local authority collection points, and certified e-waste recyclers (look for R2 or e-Stewards certification in the US, WEEE compliance in the EU). Never dispose of electronics in general household waste — hazardous materials will leach in landfills.
What is Extended Producer Responsibility?
EPR is a policy instrument requiring manufacturers to take financial or physical responsibility for their products at end of life. For electronics, this means financing collection and recycling systems. The EU's WEEE Directive mandates EPR for electronics producers selling into the EU market. Japan's Home Appliance Recycling Law requires consumers to pay a recycling fee when disposing of major appliances; manufacturers manage the recycling system.
Are electric vehicle batteries an e-waste problem?
Increasingly. EV lithium-ion batteries have a lifespan of approximately 8–15 years. As the first generation of mass EVs reaches end-of-life, battery recycling capacity is being built out globally. Lithium, cobalt, nickel, and manganese recovery from EV batteries is both economically valuable and reduces mining demand. China leads in EV battery recycling capacity; Europe and the US are investing heavily.
The bottom line
62 million tonnes of annual e-waste — growing 2–3 million tonnes per year — represents the failure of a linear (make-use-discard) electronics economy to handle the consequences of rapid technological turnover. The $62 billion in recoverable value sitting in unsorted e-waste demonstrates that this is both an environmental problem and an economic opportunity. Japan, South Korea, and the Netherlands have built formal recycling infrastructure that recovers significant value while preventing harm. The US and UK formal recycling rates (15–35%) leave enormous valuable material unrecovered. The informal recycling sector in Ghana, Nigeria, and India does recover materials — but at severe human and environmental cost. The right-to-repair movement addresses upstream causes; formal recycling infrastructure addresses downstream impacts; EPR regulation tries to make manufacturers financially responsible for both.
Related Reading
Follow new articles
Add SciHub101 to your feed reader to see new science and technology stories.
About the Author
SciHub101 is an independent science and technology publication founded and edited by Buğra Sözeri, a software engineer and app developer based in Türkiye. AI tools assist with drafting and research. Source documentation in the existing archive is uneven, and articles are being reviewed and corrected. The Editorial Team byline identifies editorial responsibility; it does not certify specialist or independent human review. Where we compare products, anything built by our own team is labelled as such — see the editorial guidelines and About page for how corrections and disclosures work.
Related Articles
Countries That Produce the Most Food (Ranked, 2026 Update)
China leads almost every broad measure of food output, but the ranking changes with the metric. Here is who leads by value added, by staple crop tonnage, and by meat and milk, with sources and caveats.
Countries with the Least Access to Clean Water (2025 Ranked)
Ethiopia, DR Congo, and Niger have the worst access to clean drinking water — fewer than 50% of the population has access. 2.2 billion people lack safely managed drinking water globally. Waterborne diseases kill 1.5 million people annually. A child dies every 2 minutes from diarrheal disease linked to unsafe water.
Countries That Recycle the Most (Municipal Waste Recycling Rates Ranked)
Austria recycles or composts 62.8% of its municipal waste — the highest rate in the European Union, the benchmark organization for standardized recycling statistics. Germany follows at approximately 67% when historical figures are used, with ten EU countries exceeding 50%. Outside Europe, South Korea leads Asia with an overall recycling and recovery rate that exceeds 80% through a deposit-refund system widely studied as a global model.
Countries That Consume the Most Electricity (Ranked)
China used about 10,070 TWh of electricity in 2024, roughly a third of the world's total, followed by the United States and India. This ranking uses Ember data for 2024, adds per-person figures, and explains what drives the gaps.
Countries with the Most Hydropower (Ranked by Installed Capacity)
China leads the world in hydropower with 435.95 GW of installed capacity — more than three times that of second-place Brazil at 110 GW. Hydropower is the world's largest source of renewable electricity, accounting for roughly 40 percent of global renewable generation. This ranking covers the top 15 countries by hydropower installed capacity using IHA and IRENA 2024 data, with methodology, historical context, and caveats about what capacity figures do and do not tell you.
Countries That Produce the Most Solar Power (Ranked)
China installed 278 GW of new solar capacity in 2024 alone — more than the entire installed base of the United States. With 888 GW of total solar PV capacity, China now hosts nearly half of all solar power on Earth. This article ranks the top solar nations by installed capacity and explains how the global solar revolution became so geographically concentrated.