Countries with the Worst Air Pollution (2025 Ranked)
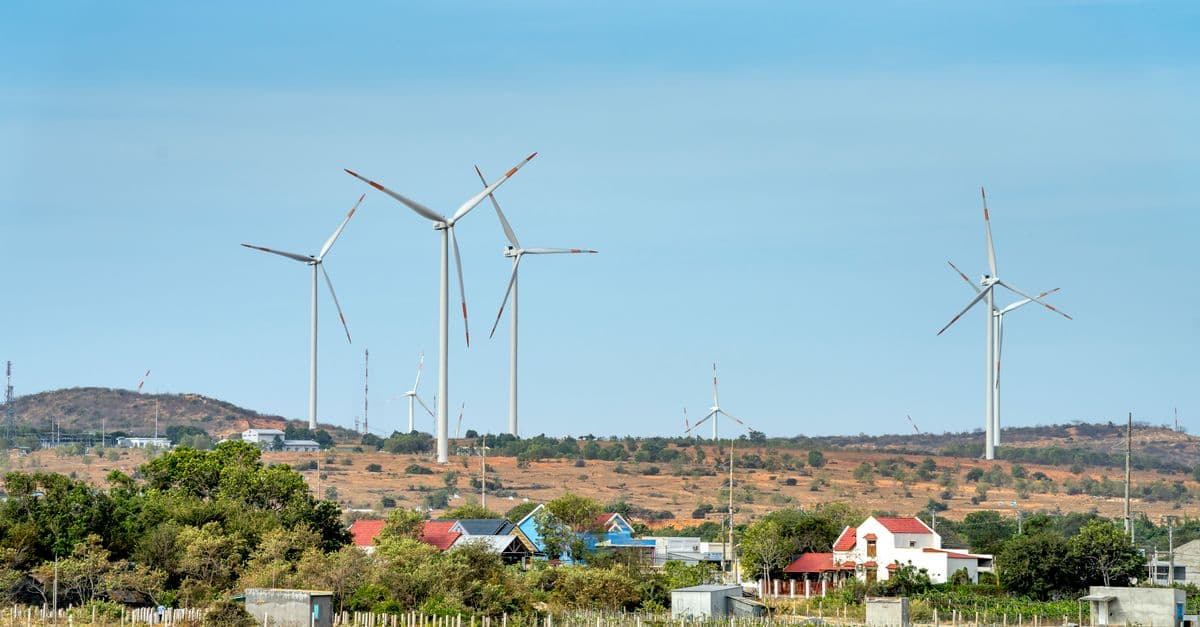
Photo: Quang Nguyen Vinh / Pexels
Air pollution kills approximately 7 million people per year — making it the world's single largest environmental health risk, responsible for more deaths than AIDS, malaria, and tuberculosis combined. The WHO estimates that 99% of the world's population breathes air that exceeds its safety guidelines.
The primary measure of air quality is PM2.5 — fine particulate matter smaller than 2.5 micrometres in diameter that penetrates deep into the lungs and bloodstream. The WHO safe guideline is 5 μg/m³ annual average; most of the world's population lives far above this.
Key takeaways
- Bangladesh (79.9 μg/m³), Pakistan (74.3), and India (54.4) have the world's worst annual average PM2.5 concentrations.
- Delhi is consistently the world's most polluted capital city — averaging 92.6 μg/m³ in 2023 (18× the WHO guideline).
- China has dramatically improved air quality since 2013 — Beijing's PM2.5 fell from 90 μg/m³ to ~35 μg/m³ in a decade, the fastest documented national air quality improvement in history.
- 7 of the 10 most polluted cities globally are in India; 3 are in Pakistan or Bangladesh.
- Indoor air pollution (cooking fires, poor ventilation) kills an additional 3.8 million people per year, primarily in Sub-Saharan Africa and South Asia.
Countries with the worst air quality
(Annual average PM2.5 concentration μg/m³, IQAir World Air Quality Report 2024)
| Rank | Country | PM2.5 (μg/m³) | WHO guideline (5 μg/m³) | Notes |
|---|---|---|---|---|
| 1 | Bangladesh | 79.9 | 16× over | Dhaka most polluted megacity |
| 2 | Pakistan | 74.3 | 15× over | Lahore among world's worst cities |
| 3 | India | 54.4 | 11× over | Delhi; Indo-Gangetic Plain dominant |
| 4 | Tajikistan | 49.0 | 10× over | Dust + combustion |
| 5 | Burkina Faso | 46.4 | 9× over | Sahel dust + cooking fires |
| 6 | Iraq | 43.0 | 9× over | Oil flaring + dust |
| 7 | Nepal | 38.0 | 8× over | — |
| 8 | DRC | 36.5 | 7× over | Biomass burning |
| 9 | China | 32.5 | 6.5× over | Improving dramatically |
| 10 | Chad | 31.0 | 6× over | Dust; Sahel |
| 15 | Ghana | 30.2 | 6× over | — |
| 20 | Indonesia | 28.5 | 6× over | Peat fires |
| 30 | Egypt | 24.5 | 5× over | — |
| 40 | Turkey | 17.0 | 3.4× over | — |
| 50 | Brazil | 11.5 | 2.3× over | Amazon fire smoke |
| 60 | United States | 8.9 | 1.8× over | Western wildfires worsening |
| 70 | Germany | 10.2 | 2× over | — |
| 80 | United Kingdom | 8.1 | 1.6× over | — |
| 90 | Australia | 7.4 | 1.5× over | Worsening from wildfires |
| 95 | Sweden | 5.6 | 1.1× over | — |
| 99 | Finland | 5.5 | 1.1× over | — |
| 100 | Iceland | 4.8 | Under WHO guideline | One of world's cleanest |
| 101 | Estonia | 4.0 | Under WHO guideline | — |
| 102 | New Zealand | 3.9 | Under WHO guideline | — |
| 103 | Australia (rural) | 3.5 | Under WHO guideline | — |
Source: IQAir World Air Quality Report (2024), WHO World Health Organization air quality database — satellite and ground-based PM2.5 monitoring network averages.
Where This Data Comes From
PM2.5 concentration data come from the IQAir World Air Quality Report, based on a global network of ground-based air quality monitoring stations (over 30,000 stations), satellite aerosol optical depth data, and machine learning models that estimate PM2.5 where ground stations are sparse. The WHO compiles independent data from national air quality monitoring programs, UNICEF surveys, and satellite-based estimates. Annual average PM2.5 figures represent the mean concentration over a full year — important because worst-case values (peak winter days in Delhi can exceed 300 μg/m³) are far higher than the annual average. Countries' reporting quality varies: developed nations with extensive ground monitoring (USA, EU) have precise measurements; developing nations with limited station density may have estimated values. Indoor air pollution data derive from WHO World Health Statistics and epidemiological studies in household biomass-burning households (measured via personal exposure monitors on study subjects). Satellite-based estimates have improved rapidly, reducing measurement gaps, though ground stations remain the gold standard for accuracy.
What Air Pollution Disparities Reveal About Development, Fuel Choice, and Geography
The stark divergence in air quality between nations reflects three factors: industrial fuel choice, geographic trapping potential, and development stage. Bangladesh and Pakistan's extraordinary pollution (16× and 15× WHO guidelines) stems from a combination of coal power plants, rapid vehicle growth with poor emission standards, crop burning (inherited agricultural practice), and geographic/climatic conditions that trap pollution (temperature inversions in winter). China's dramatic 63% improvement demonstrates that air quality is a policy choice: investing in clean energy, industrial controls, and vehicle standards yields rapid results, as China's success after 2013 proves. By contrast, India's pollution remains stubbornly high despite economic growth, suggesting that political prioritization lags technical capability. The emerging pattern — wildfire smoke degrading air quality in previously clean countries (Canada, Australia, western USA) — indicates that climate change is creating a new threat dimension that affects wealthy nations, potentially shifting political will toward climate action as air quality becomes tangible for first-world voters. The core insight: air pollution is not an inevitable consequence of development but a reversible policy failure, as China's turnaround conclusively demonstrates.
Why South Asia's air is so bad
The Indo-Gangetic Plain — stretching from Pakistan through northern India to Bangladesh — is the world's most air-polluted region. Multiple causes converge:
Geography: The plain is surrounded by the Himalayas to the north and the Vindhya-Satpura ranges to the south, creating a natural bowl that traps pollution during winter temperature inversions. Cold air near the ground holds pollutants that can't disperse upward.
Crop burning: After harvest, Punjab and Haryana farmers burn stubble to quickly clear fields for the next planting. The resulting smoke contributes significantly to Delhi's winter pollution peaks.
Vehicle emissions: India has some of the world's worst vehicle emission standards historically; massive growth in unregulated two-wheelers; BS6 standards (comparable to Euro 6) were only mandated from 2020.
Industrial emissions: Coal power plants, brick kilns, and construction dust are major contributors to urban PM2.5.
Cooking fires: Rural India relies heavily on solid fuel (wood, dung, crop waste) for cooking — a major source of both indoor and outdoor air pollution.
Diwali fireworks: India's most popular festival involves enormous fireworks that create severe short-term air quality spikes in cities.
China's remarkable turnaround
China's air quality improvement since 2013 is one of the most significant environmental policy achievements in history:
- 2013: Beijing annual average PM2.5 ~90 μg/m³
- 2023: Beijing annual average PM2.5 ~33 μg/m³
- A 63% reduction in 10 years — a speed of improvement without parallel globally
How did China achieve this?
Coal plant controls: China installed scrubbers, electrostatic precipitators, and other emission controls on virtually all coal power plants — reducing particulate emissions per unit of electricity dramatically.
Industrial relocation: Heavily polluting industries (steel, cement, chemicals) were relocated from major cities or forced to upgrade.
Vehicle standards: China leapfrogged to Euro 6 equivalent standards and simultaneously led the world in EV adoption — reducing urban vehicle emissions.
Political mandate: Air quality became a KPI for local government officials — with career consequences for failure to improve. This focus translated local implementation of national policy.
The lesson from China: air quality improvement at scale is technically feasible and can be achieved rapidly with sufficient political will and financial investment.
Indoor air pollution: the hidden crisis
While outdoor (ambient) PM2.5 pollution gets attention, indoor air pollution kills approximately 3.8 million additional people per year — predominantly:
- Women and children in households using solid fuel for cooking (wood, charcoal, dung, crop residues)
- Primary victims: Sub-Saharan Africa and South Asia
- Health effects: respiratory disease, lung cancer, cardiovascular disease, childhood pneumonia
The WHO's clean cooking initiative and various clean cookstove programmes aim to replace open fire cooking with cleaner alternatives — LPG stoves, improved biomass stoves, electric induction. Progress is measured in millions of households shifted; the scale of the problem is hundreds of millions.
Wildfires: a new threat to clean-air countries
Countries traditionally with clean air — Australia, Canada, the western United States — now face episodic severe air quality crises from wildfires:
- Australia 2019–20 Black Summer: Air quality in Sydney reached "hazardous" levels for weeks — PM2.5 exceeding 500 μg/m³ during peak events (100× the WHO guideline)
- Canada 2023: Wildfire smoke from Quebec and Ontario blanketed New York City, producing orange skies and PM2.5 readings >150 μg/m³
- California wildfires: Annual autumn smoke season has become a regular public health event in California, Oregon, and Washington
Climate change increases wildfire frequency and severity — creating a feedback loop where climate change worsens air quality, which harms health, which reduces the public health capacity to deal with the climate crisis.
Frequently asked questions
What health effects does PM2.5 cause?
PM2.5 particles penetrate into the alveoli (gas exchange regions of the lungs) and cross into the bloodstream. Health effects include: cardiovascular disease (heart attacks, strokes), lung cancer, chronic obstructive pulmonary disease (COPD), asthma, premature birth, and cognitive effects in children. The WHO estimates air pollution causes 7 million premature deaths annually — the equivalent of a major pandemic, every year, indefinitely.
What is the cheapest intervention to improve air quality?
Clean cooking — replacing open fires with cleaner alternatives — has the highest cost-effectiveness for reducing indoor air pollution deaths, particularly in Sub-Saharan Africa and South Asia. Eliminating coal combustion is the highest-impact single intervention for outdoor air quality. Improving vehicle emission standards is cost-effective in rapidly motorising countries.
Are air purifiers effective?
Yes — high-quality HEPA air purifiers can reduce indoor PM2.5 by 80–95% in a room. For people in highly polluted cities, indoor air purification is one of the most cost-effective personal health investments available. The limitation: they help individuals but don't reduce the outdoor pollution that non-purifier users breathe.
The bottom line
Air pollution at 7 million deaths per year is the world's largest environmental health emergency — and one with known, proven solutions. China's 63% reduction in Beijing PM2.5 in 10 years is proof that rapid improvement is possible at scale with political will. South Asia — where the world's most polluted air is found — has the technical knowledge to replicate China's approach but faces severe capacity and governance constraints. The emerging threat is climate-driven wildfire smoke reaching previously clean-air countries — a reminder that the environment is connected: decisions about fossil fuels, land management, and climate policy Eventually, determine the air quality of the 21st century.
Related Reading
Follow new articles
Add SciHub101 to your feed reader to see new science and technology stories.
About the Author
SciHub101 is an independent science and technology publication founded and edited by Buğra Sözeri, a software engineer and app developer based in Türkiye. AI tools assist with drafting and research. Source documentation in the existing archive is uneven, and articles are being reviewed and corrected. The Editorial Team byline identifies editorial responsibility; it does not certify specialist or independent human review. Where we compare products, anything built by our own team is labelled as such — see the editorial guidelines and About page for how corrections and disclosures work.
Related Articles

Countries with the Most Vegans and Vegetarians: What Surveys Show
India has the highest self-reported vegetarian share, but no clean global ranking of vegans and vegetarians exists. Here is what national surveys actually measured, why they disagree, and what the climate data says about plant-based diets.
Countries That Consume the Most Electricity (Ranked)
China used about 10,070 TWh of electricity in 2024, roughly a third of the world's total, followed by the United States and India. This ranking uses Ember data for 2024, adds per-person figures, and explains what drives the gaps.

Countries with the Highest Smoking Rates (2025 Ranked)
Nauru has the world's highest smoking rate — 52% of adults smoke. China has more smokers than any country: 300 million people. Smoking kills 8 million people per year — more than any other preventable cause. Yet tobacco use is rising in low-income countries as it falls in wealthy ones.

Countries with the Most Diabetes (2026 Ranked)
589 million adults now have diabetes — 1 in 9 globally. China has 148 million cases, the most of any country. Pakistan's age-standardised prevalence rate of 31.4% means nearly 1 in 3 adults is diabetic. The IDF's 2025 Atlas projects 853 million by 2050. Here is the full country-by-country breakdown and what drives these numbers.

Countries with the Most Freshwater Resources (Ranked)
Brazil has the world's largest total renewable freshwater resources — approximately 8,647 cubic kilometers per year, more than any other country and roughly 20 percent of the global total. Russia is second at 4,525 km³/year, Canada third at 2,860 km³/year. But total volume is only part of the story: Canada's per-capita freshwater availability is 36 times higher than China's. And water stress — not total availability — is the defining water challenge of the twenty-first century. This ranking covers the top 20 countries by total renewable freshwater resources, sourced from FAO AQUASTAT, with per-capita comparison and analysis of global water scarcity.
Countries with the Most Hydropower (Ranked by Installed Capacity)
China leads the world in hydropower with 435.95 GW of installed capacity — more than three times that of second-place Brazil at 110 GW. Hydropower is the world's largest source of renewable electricity, accounting for roughly 40 percent of global renewable generation. This ranking covers the top 15 countries by hydropower installed capacity using IHA and IRENA 2024 data, with methodology, historical context, and caveats about what capacity figures do and do not tell you.