Countries with the Most Plastic Recycling (2025 Ranked)
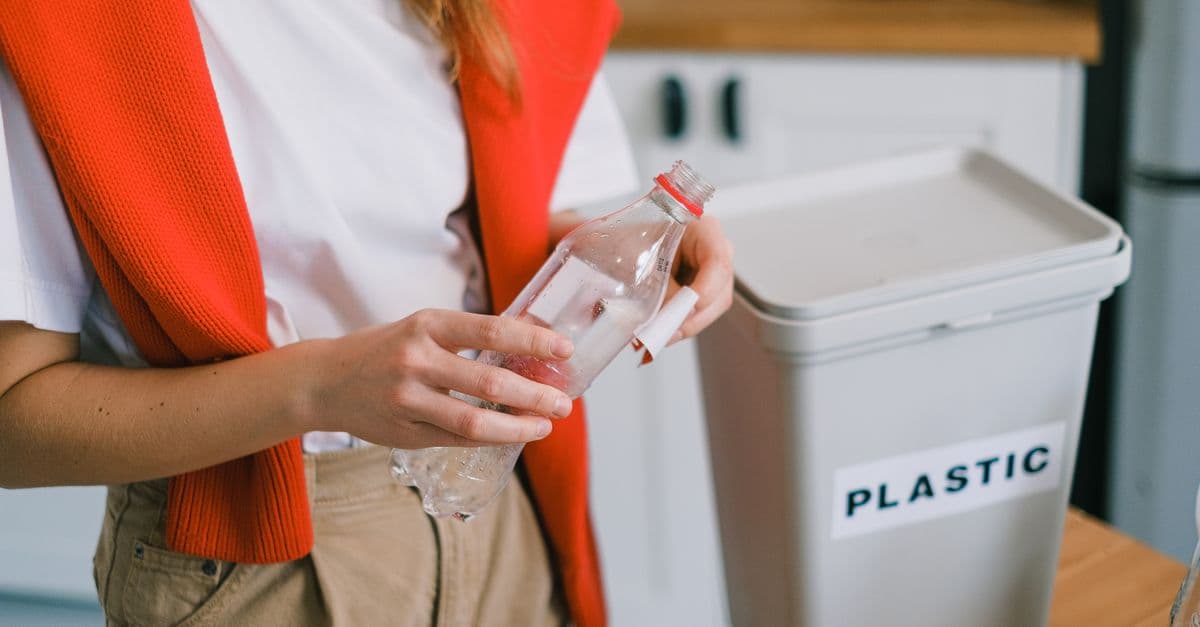
Photo: SHVETS production / Pexels
Only 9% of all the plastic ever produced has been recycled. The rest — roughly 6.3 billion tonnes — has been landfilled (12%), incinerated (12%), or leaked into the environment (79%). This is the finding of the landmark 2017 Geyer et al. study in Science Advances — the first comprehensive account of global plastic production and fate.
The global plastic recycling system has improved since then, but remains fundamentally inadequate relative to production volumes. Plastic production reached 400 million tonnes per year in 2022 and is projected to double by 2040. Recycling cannot keep pace with this growth.
Key takeaways
- Germany (66%) has the world's highest national plastic recycling rate — driven by a comprehensive deposit system and mandatory sorting.
- South Korea (63%) and Wales (65%, UK constituent country) follow closely.
- Global average plastic recycling rate: approximately 9% of production — down from the 2020 headline figure of "32%" which included exports to countries that often landfilled the waste.
- China's 2018 National Sword policy — banning imports of most recyclable waste — exposed the hollowness of Western recycling programs that depended on shipping plastic to Asia.
- Chemical recycling (converting plastic to fuel or feedstock) promises to handle plastics that cannot be mechanically recycled, but remains expensive and unscaled.
Countries with the highest plastic recycling rates
(% of plastic waste recycled domestically, OECD / national data 2022)
| Rank | Country | Recycling rate | System |
|---|---|---|---|
| 1 | Germany | 66% | Pfand deposit; Grüner Punkt system |
| 2 | Wales | 65% | Door-to-door sorting; targets |
| 3 | South Korea | 63% | Mandatory source separation |
| 4 | Austria | 60% | Extended producer responsibility |
| 5 | Belgium | 58% | Fost Plus system |
| 6 | Slovenia | 56% | — |
| 7 | Netherlands | 54% | Statiegeld deposit system |
| 8 | Switzerland | 53% | Fee-for-disposal incentive |
| 9 | Sweden | 50% | — |
| 10 | Finland | 48% | Palautuspullo deposit system |
| 15 | Japan | 45% | Strict source separation culture |
| 20 | France | 35% | Improving; targets |
| 25 | United Kingdom | 32% | Variable; England lags Wales |
| 30 | United States | 5–9% | Fragmented; market-dependent |
| 35 | Australia | 16% | Post-China Sword reform |
| 40 | China | 22% | Now domestic focus |
| 50 | Brazil | 17% | Informal waste picker sector |
| 60 | India | 12% | Informal sector significant |
| 70 | Nigeria | 4% | Minimal formal infrastructure |
Source: OECD / National statistical agencies (2022) — Data reflects domestically processed plastic waste; excludes exports. Recycling rates defined as percentage of plastic waste stream diverted to recycling facilities.
Where This Data Comes From
This ranking compiles data from OECD national accounts, Eurostat (for EU countries), and national environmental agencies' official waste management statistics through 2022. The metric used is the recycling rate—the percentage of national plastic waste that is processed through recycling facilities domestically, excluding plastic exported to other countries for processing. The data year 2022 was chosen to reflect the post-China-National-Sword (2018) period when Western countries' reporting shifted toward actual domestic recycling rather than export volumes. Recycling rate definitions vary slightly by country, but most align with European Commission definitions (plastic waste collected and sorted for mechanical or chemical processing).
Germany: the Pfand revolution
Germany's 66% recycling rate is built on a specific and replicable system:
Pfand (deposit) system: Germany charges a deposit (25 cents) on most plastic and glass beverage bottles, returned at machines in every supermarket. The system achieves a ~98% bottle return rate — one of the highest in the world. This is fundamentally different from curbside recycling: consumers are financially incentivised to return specific containers rather than sorting mixed recycling.
Grüner Punkt (Green Dot): Germany's system for all other packaging — producers pay a fee proportional to the packaging material they put on the market. This "extended producer responsibility" (EPR) funds collection and sorting. Products bearing the green dot symbol have their packaging end-of-life funded by the manufacturer.
Strict sorting requirements: German households sort into multiple streams — bio/organic, paper, lightweight packaging (Gelber Sack/yellow bag), glass by colour, residual waste. Non-compliance is taken seriously.
The lesson: High recycling rates don't happen spontaneously — they require specific policy infrastructure (deposits, EPR, collection systems) designed over decades.
The China Shock: National Sword 2018
Before 2018, the global recycling system was largely fictional for many Western countries:
The export model: The UK, US, Australia, and other countries collected mixed recyclables, baled them, and shipped them to China, which had the processing infrastructure to sort and recycle. China imported 70% of the world's recyclable waste.
National Sword (January 2018): China banned imports of 24 categories of recyclable waste and imposed a 0.5% contamination standard — far below the 20–30% contamination typical of Western mixed recycling streams. The policy change was overnight and absolute.
Consequence: Within months, Western recycling programmes collapsed. Recyclables went to landfill; councils stopped collecting certain materials; the economic model of recycling disappeared. Countries that had been congratulating themselves on "recycling rates" of 40–60% discovered they had been counting exports to China rather than actual recycling.
The aftermath: Forced to develop domestic recycling capacity, countries have been slowly rebuilding. But the cost of genuine domestic recycling is significantly higher than the China export model was. Many materials — especially mixed plastics — still lack viable recycling markets.
The Recycling Paradox: High Rates Don't Solve the Problem
Germany's 66% rate and Wales' 65% represent genuine policy success stories—systems that actively collect, sort, and reprocess plastic at scale are rare and valuable globally. Yet even these leaders still landfill or incinerate one-third of their plastic, and their high rates often mask a troubling reality: only a fraction of material is closed-loop recycled (bottle-to-bottle). Most "recycled" plastic downcycles—converted to lower-grade products like textiles or packaging that cannot be recycled again—before eventually entering landfills or the environment. The global 9% true recycling figure (from the 2017 Geyer study and confirmed by more recent data) reveals that improved collection rates have not solved the fundamental problem: plastic production is growing at approximately 5–6% annually while recycling capacity grows much more slowly. Without mandatory reduction in single-use plastic production, rising recycling rates in high-income countries simply slow—rather than prevent—the accumulation of plastic in the environment. Germany and Wales demonstrate what high-income societies can achieve through policy investment; but their examples also show that recycling excellence in 30% of the world's countries leaves 70% dependent on alternative solutions.
The 9% reality: why recycling is broken
Economics: Most plastic recycling is not economically viable without subsidies. Virgin plastic is cheaper to produce than recycled plastic because petrochemical feedstocks are cheap. Until carbon pricing or other policies make virgin plastic more expensive, recycling will struggle economically.
Material complexity: Modern packaging uses multi-layer, multi-material plastics optimised for product performance rather than recyclability. A stand-up pouch might have 7 layers of different plastics bonded together — impossible to separate mechanically.
Contamination: Food residue, non-recyclable plastics mixed in, and labelling make sorting difficult. Contamination reduces the value of recycled material.
Only 2 of 7 plastic types recycle well: PET (#1, drink bottles) and HDPE (#2, milk bottles) have established markets. Types 3–7 (PVC, LDPE, PP, PS, other) have limited or no viable recycling pathways at scale.
Chemical recycling: promise and limitation
Chemical recycling — breaking plastic down into molecules (pyrolysis, gasification, dissolution) rather than melting it — can theoretically handle plastics that mechanical recycling cannot:
What it can do: Convert mixed contaminated plastics into fuel, chemicals, or polymer feedstock. Handle materials mechanical recycling cannot touch.
Current limitations: Energy-intensive (often requires fossil fuel energy); economically uncompetitive without subsidies; small scale relative to the problem; some processes produce toxic byproducts. The UN Environment Programme estimates chemical recycling currently handles less than 1% of global plastic waste.
Industry claims: Major petrochemical companies (ExxonMobil, Shell, Dow) have announced large chemical recycling investments. Environmental groups are sceptical — arguing these announcements are primarily PR responses to plastic regulation pressure rather than genuine commitments.
Frequently asked questions
Should I bother recycling given the low global rates?
Yes — for several reasons. Even at low global averages, your local recycling programme may be significantly more effective (Germany achieves 66%; your region may be similar). Recycling reduces virgin plastic demand — even marginal reductions matter. And plastic that enters recycling streams avoids the environment even if it ends up in landfill — landfill is better than the ocean.
What is the most recyclable plastic?
PET (polyethylene terephthalate, resin code #1) — clear drink bottles. Near 100% technically recyclable; strong secondary markets; closed-loop recycling (bottle-to-bottle) commercially viable. Buy drinks in PET bottles and return them where deposit systems exist. Avoid opaque bottles, coloured PET, and multilayer packaging where possible.
What is extended producer responsibility?
EPR makes the manufacturer financially responsible for the end-of-life of their product's packaging. Instead of municipal governments bearing the cost of recycling, EPR fees charged to producers fund collection and processing. Germany's system is EPR-based; it aligns the economic incentive for packaging design — producers who use easily recyclable materials pay lower EPR fees, incentivising design for recyclability.
The bottom line
Germany's 66% recycling rate demonstrates that high plastic recycling rates are achievable with the right policy infrastructure. But 66% in Germany still means 34% of plastic is not recycled — and Germany produces significant plastic per capita. The global system of plastic production and disposal is fundamentally incompatible with sustainability: 400 million tonnes produced per year, 9% recycled, the rest accumulating in landfills, incinerators, and ecosystems. The plastic crisis cannot be solved by recycling alone — it requires dramatic reduction in plastic production, particularly single-use applications. Extended producer responsibility, deposit return schemes, and Eventually, reduction targets are the policy tools that actually work. Individual recycling behaviour matters at the margin, but is dwarfed by the scale of systemic overproduction.
Related Reading
Follow new articles
Add SciHub101 to your feed reader to see new science and technology stories.
About the Author
SciHub101 is an independent science and technology publication founded and edited by Buğra Sözeri, a software engineer and app developer based in Türkiye. AI tools assist with drafting and research. Source documentation in the existing archive is uneven, and articles are being reviewed and corrected. The Editorial Team byline identifies editorial responsibility; it does not certify specialist or independent human review. Where we compare products, anything built by our own team is labelled as such — see the editorial guidelines and About page for how corrections and disclosures work.
Related Articles
Countries That Recycle the Most (Municipal Waste Recycling Rates Ranked)
Austria recycles or composts 62.8% of its municipal waste — the highest rate in the European Union, the benchmark organization for standardized recycling statistics. Germany follows at approximately 67% when historical figures are used, with ten EU countries exceeding 50%. Outside Europe, South Korea leads Asia with an overall recycling and recovery rate that exceeds 80% through a deposit-refund system widely studied as a global model.
Countries That Generate the Most Plastic Waste (2025 Ranked)
The United States generates more plastic waste per capita than any large nation — 130 kg per person per year. But the Philippines, Indonesia, and India contribute the most plastic to the ocean. How you rank countries on plastic pollution depends entirely on whether you measure production, per-capita waste, or ocean contribution.
Countries Producing the Most E-Waste (2025 Ranked)
The world generated 62 million tonnes of e-waste in 2022 — a record. China produces the most e-waste in absolute terms (12 million tonnes). Norway and Iceland generate the most per capita. Only 22% of e-waste is formally recycled. E-waste contains $62 billion in recoverable precious metals annually.
The Plastic Pollution Crisis Explained
We produce 400 million tonnes of plastic per year. Most ends up in landfills, in the ocean, or as microplastics in our food. Here's the science of plastic pollution and what's actually being done.

Countries with the Most Freshwater Resources (Ranked)
Brazil has the world's largest total renewable freshwater resources — approximately 8,647 cubic kilometers per year, more than any other country and roughly 20 percent of the global total. Russia is second at 4,525 km³/year, Canada third at 2,860 km³/year. But total volume is only part of the story: Canada's per-capita freshwater availability is 36 times higher than China's. And water stress — not total availability — is the defining water challenge of the twenty-first century. This ranking covers the top 20 countries by total renewable freshwater resources, sourced from FAO AQUASTAT, with per-capita comparison and analysis of global water scarcity.
AI & Ocean Cleanup: Autonomous Robots Battle Plastic Pollution
How machine learning powers ocean cleanup robots to detect, route toward, and remove plastic from rivers and open water, and where the technology still falls short.