Countries With the Most Endangered Species (2025)
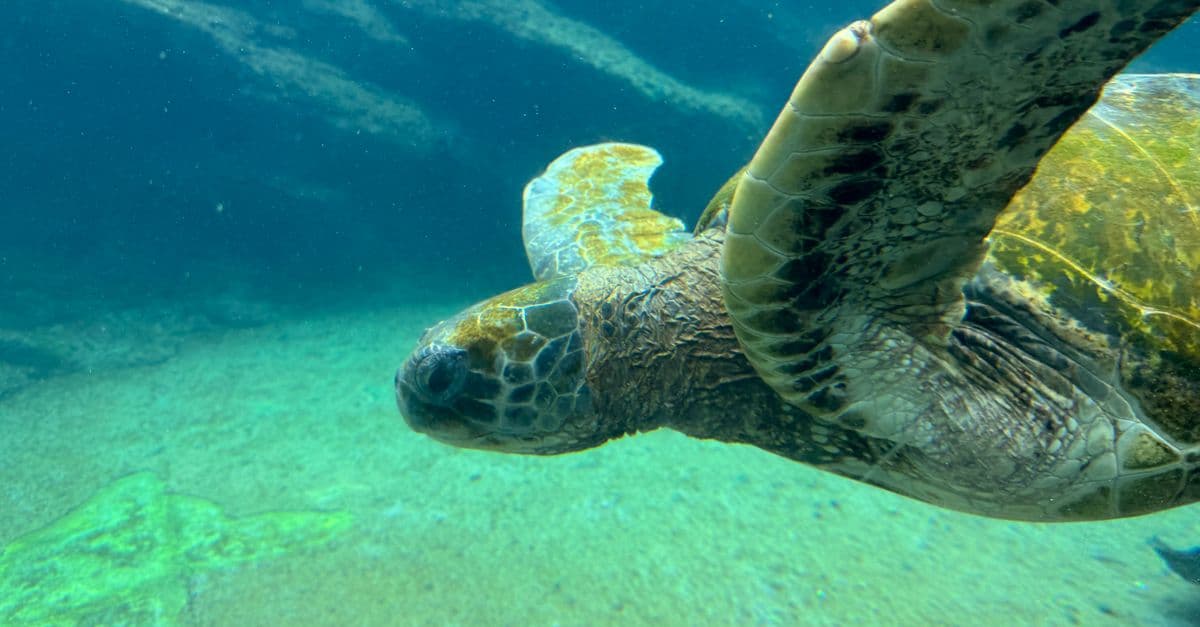
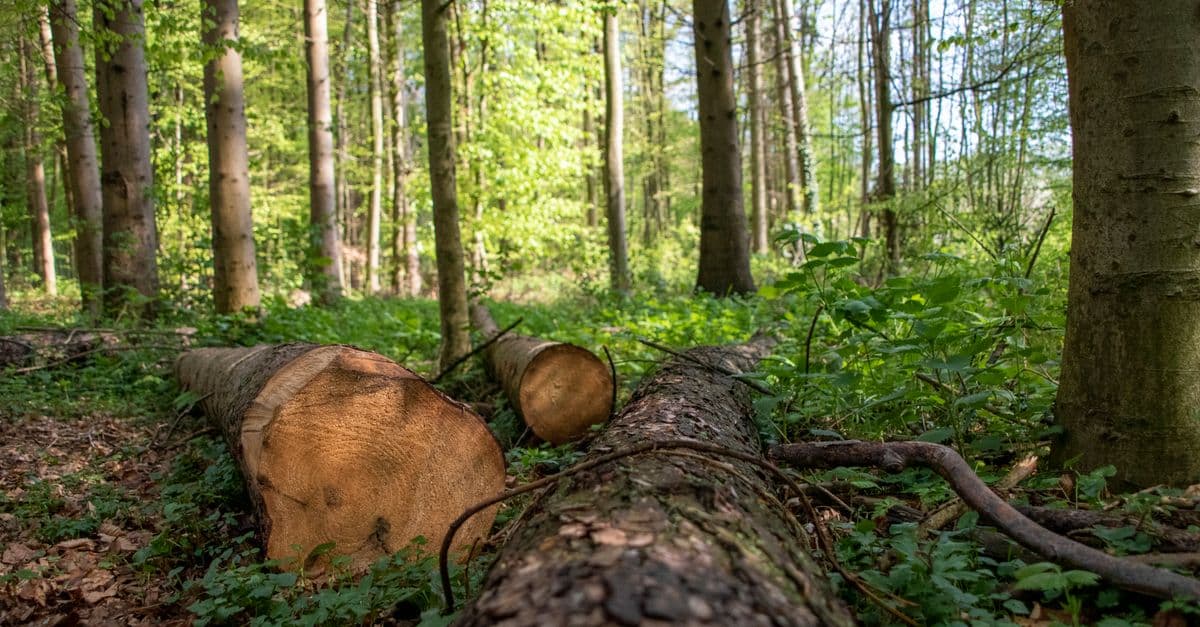
Photo: Haneli Henning / Pexels
Madagascar currently sits at the top of the most recent counts of threatened species by country, with more than 4,000 species listed as Critically Endangered, Endangered, or Vulnerable on the IUCN Red List. Ecuador, Indonesia, Mexico, and Brazil follow. But the answer has changed over time and depends on which species groups are counted: in 2013, Ecuador led with 2,301. This article lays out what the sourced numbers say, why they disagree, and how to read any "most endangered species" ranking without being misled by it.
Which country has the most endangered species?
By the most recent figures available, Madagascar. Statista, summarizing IUCN Red List data for 2025, reports that Madagascar has the most threatened living species in the world, with more than 4,000, and that five of the top ten countries are in the Americas. In its ranking Ecuador comes third (Statista, last updated February 3, 2026).
An independent analysis of IUCN data by the wildlife-management company DeerFencing, reported in April 2025, produced a similar top five. It is a secondary analysis, so treat it as a cross-check and not as the IUCN's own table (report at Travelling for Business).
| Snapshot | Source and date | 1st | 2nd | 3rd | 4th | 5th |
|---|---|---|---|---|---|---|
| IUCN counts, all assessed groups | Scientific American, December 5, 2013 | Ecuador (2,301) | United States (1,278) | Malaysia (1,226) | Indonesia (1,206) | Mexico (1,074) |
| IUCN-based analysis | DeerFencing, April 18, 2025 | Madagascar (3,915) | Ecuador (2,756) | Indonesia (2,699) | Mexico (2,624) | Brazil (2,497) |
| IUCN summary, 2025 | Statista, updated February 3, 2026 | Madagascar (over 4,000) | Not stated in free text | Ecuador (count not shown) | Not stated | Not stated |
The 2013 column is the one an older version of this article treated as current. Counts have risen sharply since then, and the order has reshuffled. If you find a table claiming Ecuador at 2,378 and the United States at 2,273, check its year and source before using it; it does not match either of the verified snapshots above.
Why the totals do not agree
Two numbers can both be honest and still differ by a thousand. The main reasons are listed below.
- Release year. The Red List is updated at least twice a year, and each update adds assessments and changes categories. A count from 2013 describes a different list than a count from 2025.
- Which groups are included. Some tallies include plants, fungi, and invertebrates. Others count only vertebrates. Plants alone can add more than a thousand species to a country's total.
- Which distributions are counted. IUCN's country tables include only certain distributions, such as native and reintroduced ranges. They exclude introduced species and vagrant records.
- Who is doing the counting. A secondary analysis may pull a different subset of the database than the IUCN's summary tables.
The most careful use of any of these tables is as a rough ordering of countries with large, well-assessed biodiversity, not as a precise scoreboard.
What does "threatened" actually mean on the IUCN Red List?
The International Union for Conservation of Nature (IUCN) is a global network of governments and scientists that has run the Red List since the 1960s. It sorts every assessed species into one of nine categories: Extinct, Extinct in the Wild, Critically Endangered, Endangered, Vulnerable, Near Threatened, Least Concern, Data Deficient, and Not Evaluated (Wikipedia, IUCN Red List).
"Threatened" is not a category itself. It is the umbrella term for the three highest-risk categories that are still alive: Critically Endangered, Endangered, and Vulnerable. A species lands in one of them by meeting at least one of five sets of criteria, which look at the rate of population decline, population size, geographic range, and how fragmented that range is.
So an "endangered species" count in the news usually means "threatened species," a broader set than the strict Endangered category. A Vulnerable plant counts toward a country's total just the same as a Critically Endangered mammal, which is why one country's total can look huge and still hide how few of its species are on the edge.
The Data Deficient problem
The Red List also has a category for species that have been studied too little to judge: Data Deficient, defined as "inadequate information to assess extinction risk." Those species are not in any country's threatened total, so a country with poorly studied wildlife can look safer than it is. Many invertebrates and plants in the tropics fall into this gap, which means rankings undercount extinction risk exactly where biodiversity is highest.
How many species are threatened worldwide?
The IUCN's own site lists 175,909 species assessed and 49,505 threatened with extinction (IUCN Red List summary). That is about 28% of the species assessed. The page does not state the exact release version, and the numbers shift with every update, so quote them with a date.
The share is not the same across life forms. IUCN's October 2025 report on 60 years of the Red List, built on assessments of 169,420 species, lists several group-level estimates, and the live Red List site shows slightly different values, because each version revises them (IUCN, 60 years of the Red List).
| Group | Share threatened (approximate, varies by Red List version) |
|---|---|
| Cycads (ancient seed plants) | 71% |
| Reef-building corals | 44% |
| Amphibians | 41% |
| Sharks and rays | 37% to 38% |
| Conifers | 34% |
| Mammals | 26% to 27% |
| Reptiles | 21% |
| Birds | 11% to 12% |
Our World in Data adds a useful caution. It reports these shares only for groups in which more than 80% of described species have been evaluated, because shares in less-studied groups, such as insects and fungi, would be unreliable (Our World in Data). It also notes that the total number of threatened species is probably a significant underestimate.
For a broader look at why species are disappearing, see our article on the biodiversity collapse.
Why do tropical and island countries dominate the rankings?
The pattern is consistent across every snapshot above: Ecuador, Indonesia, Malaysia, Madagascar, Mexico, and Brazil, all tropical, keep showing up. Three forces overlap.
Richness. Tropical countries simply have more species per square kilometer than cold or dry ones, so they have more species that can end up on the list. Our companion ranking of countries with the most biodiversity covers that side of the story.
Endemism. Endemic species live in one place and nowhere else. Many tropical species occupy a single mountain slope, river valley, or island, so one patch of forest cleared can remove an entire species. Think of it like a library with one copy of each book: lose the building and you lose the text.
Pressure. Forests are cleared for farming, grazing, timber, and plantations, and the countries with the greatest biodiversity are often not wealthy enough to make conservation compete with those incomes. Our article on deforestation, its causes and real solutions explains the drivers in detail.
Assessment effort matters as much as risk
Scientific American's 2013 analysis made a point that still holds. Ecuador's top spot, the author wrote, reflected an intensive effort over roughly 15 years to evaluate its biodiversity, not necessarily that its species were more threatened than elsewhere. The same piece cautioned that country totals ignore a nation's size and total biodiversity, and that counts for countries such as Brazil and South Africa were likely to rise as more species were assessed (Scientific American, December 5, 2013).
That prediction is borne out by the 2025 data: Brazil now appears in a top five with a count above 2,000, up from a position outside the 2013 top five. A country that assesses more of its species will see its threatened total rise even if nothing on the ground has changed.
Madagascar: the island at the top
Madagascar is where the count and the crisis line up most clearly. The island's wildlife evolved in isolation, and the most famous group, the lemurs, is among the most threatened mammal groups on Earth.
In its July 10, 2020 update, the IUCN reported that 103 of the island's 107 surviving lemur species are threatened with extinction, and 33 of them (about 31%) are Critically Endangered (IUCN, July 2020). The ring-tailed lemur is Endangered, with a population thought to have fallen by at least half over three generations. The IUCN names deforestation and hunting as the main causes, along with slash-and-burn agriculture and logging for charcoal and fuelwood.
How much forest is gone
The IUCN states that about 40% of Madagascar's original forest cover was lost between the 1950s and 2000. Satellite records show the loss has continued: Forest Trends, using Global Forest Watch data, reports 4.92 million hectares of tree cover lost between 2001 and 2023, about 29% of the island's forest cover (Forest Trends, Madagascar). One region, Toamasina, accounts for 1.81 million of those hectares, and together with Fianarantsoa it makes up 55% of the national loss.
Forest Trends identifies shifting slash-and-burn agriculture as the main driver, followed by illegal logging and small-scale conversion to cropland. It also notes that weak law enforcement and corruption in the timber trade undermine protection even inside parks. The trees themselves are in trouble: the IUCN's Global Trees Assessment found that of 982 tree species in Madagascar's dry forests, 90% have declining populations and 59% are threatened.
Ecuador: small country, big list
Ecuador is the classic case of a country whose rank reflects both genuine richness and heavy assessment. Within a few hundred kilometers the country passes from Pacific coast through Andean cloud forest to Amazon lowland, and it includes the Galápagos Islands, whose isolated species famously informed Darwin's thinking about natural selection.
Plants drive the totals. In the 2013 count Ecuador had 1,843 native plant species at risk, according to Scientific American, the highest plant figure on its list. A country with thousands of plant species, each often confined to a narrow band of elevation, will accumulate threatened plants quickly once assessors look. The Galápagos are a reminder that endemism is not only a tropical mainland story. Island species that evolved without land predators are often unprepared for introduced rats, cats, or goats, and our article on how evolution and natural selection work explains why isolation produces such distinctive and fragile life.
Indonesia, Mexico, Brazil, and the United States
The other countries in the snapshots each rank high for a different reason.
Indonesia is a sprawling archipelago with enormous forest area. In the 2013 count it had 185 threatened mammals, the most of any country, and in the 2025 analysis it remains in the top three with 2,699 threatened species in total. Its forests, and the tigers, orangutans, and rhinos that live in them, are the focus of much of the world's conservation attention.
Mexico appears in the top five in both the 2013 and the 2025 snapshots, with 1,074 and 2,624 threatened species respectively, a rise that probably reflects continued assessment in part.
Brazil held the most threatened birds on the 2013 list, with 151. Its jump into the 2025 top five (2,497) is consistent with how a large country with a huge number of unassessed species can climb as its assessments expand.
The United States is a special case. It was second in 2013 with 1,278 threatened species, and Scientific American noted that it led the list in threatened fishes (236), mollusks (301), and recorded extinctions (257). That reflects a large, well-funded assessment effort and a fresh-water fauna, particularly mussels and fishes, that has been heavily affected by dams and pollution. A high U.S. rank is partly a sign of good records.
Why amphibians are the most threatened vertebrates
Among vertebrates, amphibians stand out. A 2023 paper in Nature reported the second Global Amphibian Assessment, which re-evaluated 8,011 species for the Red List and found that 40.7% are globally threatened, the highest share of any vertebrate class (Luedtke et al., Nature 622, 2023). Salamanders and Neotropical species showed the sharpest deterioration.
The drivers have changed over time. The assessment found that disease and habitat loss together drove 91% of status deteriorations between 1980 and 2004, and that since 2004 climate change has become the leading cause, at 39%, followed by habitat loss at 37%. Disease here refers mostly to chytridiomycosis, a fungal infection that attacks amphibian skin, the organ through which these animals breathe and regulate water.
Amphibians matter for rankings because they are tropical, localized, and sensitive. A frog confined to one cloud-forest ridge can be wiped out by a change in rainfall, and the Neotropics, the region from southern Mexico through South America, hold some of the highest amphibian diversity. That is a large part of the reason Latin American countries fill so many places in the top ten.
How to read an endangered-species ranking
A few questions will keep a ranking from fooling you.
| Question to ask | Why it matters |
|---|---|
| What year is the data from? | Red List counts rise as assessments expand. A 2013 table and a 2025 table are not comparable. |
| Are plants and invertebrates included? | Plants can more than double a country's total. Vertebrate-only lists look very different. |
| Does it adjust for area or total species? | A threatened count says nothing about proportion. A small country can have a higher share of its species at risk than a large one. |
| Does it count Data Deficient species? | They are excluded from threatened totals, so poorly studied regions look safer. |
| Is the source primary or secondary? | A table built from IUCN's own country summaries is stronger than a re-analysis. |
The deeper lesson is that the ranking measures a mix of three things: how rich a country's biodiversity is, how much pressure it is under, and how many of its species scientists have had the resources to assess. Only one of those is the thing most readers think they are looking at.
Which species have recovered?
The extinction crisis is real, but recoveries show that action can work, and they come with a warning attached.
- Arabian oryx. Declared extinct in the wild in 1972, it was reintroduced from captive herds, with a first release in Oman in 1982, and was later moved on the Red List to Vulnerable, one of the clearest recoveries recorded by the IUCN.
- Giant panda. The IUCN moved it from Endangered to Vulnerable in 2016 because its population had increased. Researchers have since warned that a lower threat status can weaken political momentum and funding, since many grant programs prioritize species rated Vulnerable or higher (Fuller Lab, on what happens after a species recovers).
- California condor. First captive-bred birds were released in 1992, and the population has since grown past 500, though lead poisoning from ammunition remains a threat; California banned lead ammunition for hunting statewide in 2019.
- Red-crowned crane and saiga antelope. Both have been downlisted after populations stabilized or recovered, although some regional populations of the crane remain in serious trouble.
These stories show that threatened status can improve, but that improvement is not the end of the work. The IUCN's Green Status framework was designed to show when a species still depends on conservation even after it leaves a higher-risk Red List category.
What the world has promised to do
In December 2022, 196 countries adopted the Kunming-Montreal Global Biodiversity Framework at the close of COP15 under the UN Convention on Biological Diversity. It has four long-term goals for 2050 and 23 targets for 2030, the best known of which is "30 by 30": protecting and conserving at least 30% of land, inland waters, and coastal and marine areas by 2030 (Pew Charitable Trusts). The target calls for those areas to be effectively conserved, not just drawn on a map.
How well it works will show up in future Red List updates. Our article on countries with the most national parks and protected land shows where protection stands today, and the piece on AI and satellite biodiversity monitoring describes how assessments are getting cheaper and faster, which will itself change future rankings.
Frequently asked questions
Q: Which country has the most endangered species? A: In the most recent IUCN-based counts, Madagascar, with more than 4,000 threatened species according to Statista's 2025 summary and 3,915 in a separate April 2025 analysis. Ecuador placed first in an older 2013 count at 2,301.
Q: Why did the ranking change so much since 2013? A: The Red List expands every year as more species are assessed, and counts rise for countries that assess more. Brazil, for instance, was outside the 2013 top five and is in the 2025 top five.
Q: Why does Ecuador have so many threatened species? A: Ecuador combines high biodiversity in a small area with heavy assessment effort. Scientific American's 2013 analysis noted that about 15 years of intensive assessment contributed to its high count, and plants make up most of the total.
Q: What is the IUCN Red List? A: It is the world's most widely used inventory of species conservation status, maintained by the IUCN. It sorts assessed species into nine categories, and "threatened" means Critically Endangered, Endangered, or Vulnerable.
Q: Which animal group is most at risk? A: Among vertebrates, amphibians, with 40.7% of 8,011 assessed species threatened according to a 2023 Nature study. Cycads (about 71%) and reef-building corals (about 44%) are even higher among other groups.
Q: Does a high ranking mean a country is failing at conservation? A: Not by itself. A high count mostly reflects rich biodiversity, strong pressure from land use, and thorough assessment. Some countries with big lists are also among those investing most in protection.
Q: Is the number of threatened species going up or down? A: The count of threatened species on the Red List has generally risen as assessments expand, though part of that rise is better knowledge rather than new decline. Some individual species, such as the Arabian oryx and giant panda, have improved.
The takeaway
The most useful fact in any endangered-species ranking is the one printed in small type: the year and the source. Madagascar leads the latest counts and the story behind it, lemurs and a forest that has lost a large share of its cover, is real and well documented. But Ecuador's earlier lead, and Brazil's rise, show that a rank partly records how closely a country has been studied. Read the list as a map of where life is richest and most under pressure, and be wary of treating it as a league table.
Sources
- Statista. Number of threatened species 2025, by select country (updated February 3, 2026).
- Scientific American, Extinction Countdown. Can You Guess Which Country Has the Most Endangered Species? (December 5, 2013).
- DeerFencing analysis of IUCN data, reported at Travelling for Business (April 18, 2025).
- IUCN. Almost a third of lemurs now Critically Endangered (July 10, 2020).
- IUCN. The IUCN Red List of Threatened Species and 60 years of the Red List report (October 2025).
- Our World in Data. Share of species threatened with extinction (IUCN Version 2025-1, Table 1a).
- Forest Trends. Madagascar country profile (Global Forest Watch data, 2001 to 2023).
- Luedtke JA, et al. Ongoing declines for the world's amphibians in the face of emerging threats. Nature 622, 308-314 (2023).
- Pew Charitable Trusts. Nations adopt historic new agreement for nature (December 20, 2022).
- Fuller Lab. A good problem to have: what next when a species recovers?
- IUCN Red List categories overview.
Related Reading
Follow new articles
Add SciHub101 to your feed reader to see new science and technology stories.
About the Author
SciHub101 is an independent science and technology publication founded and edited by Buğra Sözeri, a software engineer and app developer based in Türkiye. AI tools assist with drafting and research. Source documentation in the existing archive is uneven, and articles are being reviewed and corrected. The Editorial Team byline identifies editorial responsibility; it does not certify specialist or independent human review. Where we compare products, anything built by our own team is labelled as such — see the editorial guidelines and About page for how corrections and disclosures work.
Related Articles

Why Wagyu Beef Is So Expensive — The Science of the World's Most Marbled Meat
A 29-month feeding program, thousands of kilograms of mostly imported feed, a strict marbling scale, and a Kobe certification covering about 5,500 animals a year: the biology and economics behind Wagyu's price.

Why Vanilla Is So Expensive — The Biology and Economics of the World's Second-Priciest Spice
A flower that stays open for about a day, a pollination step no machine has replaced, months of curing, and a supply base that cyclones can cut by a third: the biology and economics behind vanilla's price.
AI & Biodiversity: Satellite Monitoring Protects Endangered Species
How neural networks detect endangered animals, track population decline, predict extinction.
Countries With the Most Biodiversity (2025)
Biodiversity is not evenly spread across the planet. Seventeen 'megadiverse' countries, most of them tropical, hold a large share of Earth's known species. This ranking uses IUCN Red List endemism data and explains why counting species country by country is so hard.
Coral Reefs Explained — Rainforests of the Sea
How coral animals build reefs, their algae symbiosis, why bleaching happens, and what conservation can still save. Learn the science, key examples, and...
Countries With the Most Forest Cover (2025)
Forests cover 4.14 billion hectares, about 32% of the world's land, per FAO's 2025 assessment. Russia, Brazil, Canada, the United States and China hold more than half. Ranked by area and by share of land, with what the numbers miss.