Countries With the Most Industrial Robots Per Worker (IFR World Robotics 2025)
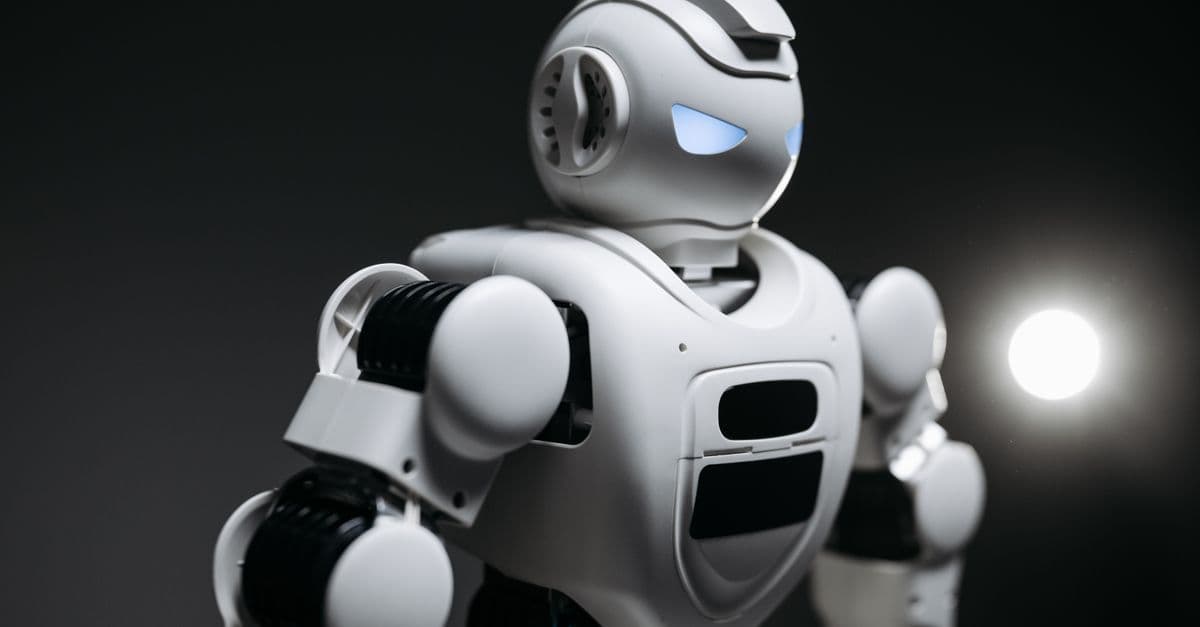
Photo: Pavel Danilyuk / Pexels
Robot density — the number of industrial robots in operation per 10,000 employees in manufacturing — is the standard way to compare how automated different countries' factories are. It strips out the effect of country size. A large economy will always have more robots in total; robot density asks how many robots each factory workforce works alongside.
The figures in this ranking come from the International Federation of Robotics (IFR), the industry body that publishes the annual World Robotics report. The most recent density figures, released on 8 April 2026, are from World Robotics 2025 and describe the situation at the end of 2024. Where useful, we also show the previous edition, World Robotics 2024 (2023 data), so you can see the direction of travel.
The short version: South Korea is far ahead of everyone, Singapore is a clear second, Germany and Japan are neck and neck, and the global average sits at 132 robots per 10,000 manufacturing employees. China — which installs more robots than the rest of the world combined — has a much lower density figure than in last year's report, for a reason that has more to do with statistics than with factories.
This ranking normalises robot numbers by workforce. For total robot stock and annual installations by country, see Countries with the Most Robots in Manufacturing.
Key Takeaways
- South Korea leads with 1,220 robots per 10,000 manufacturing employees (2024 data, World Robotics 2025), growing about 7% a year since 2019.
- Singapore is second at 818, with the fastest growth among the leaders, about 13% a year since 2019.
- Germany (449) and Japan (446) are third and fourth; the United States is eighth at 307.
- The global average is 132; Western Europe averages a record 267 and North America 204.
- China's density is 166, not comparable with the 470 reported a year earlier, because the IFR switched to updated labour data from China's National Bureau of Statistics.
- Worldwide, 542,000 industrial robots were installed in 2024 and about 4.66 million were in operation; China alone accounted for 54% of installations.
Robot Density Ranking: Top 10 Economies
Metric: operational industrial robots per 10,000 employees in manufacturing. Source: IFR, World Robotics 2025 (press release of 8 April 2026). Data year: 2024.
| Rank | Economy | Robots per 10,000 manufacturing employees | Data year | IFR edition |
|---|---|---|---|---|
| 1 | South Korea | 1,220 | 2024 | World Robotics 2025 |
| 2 | Singapore | 818 | 2024 | World Robotics 2025 |
| 3 | Germany | 449 | 2024 | World Robotics 2025 |
| 4 | Japan | 446 | 2024 | World Robotics 2025 |
| 5 | Sweden | 377 | 2024 | World Robotics 2025 |
| 6 | Denmark | 329 | 2024 | World Robotics 2025 |
| 7 | Slovenia | 315 | 2024 | World Robotics 2025 |
| 8 | United States | 307 | 2024 | World Robotics 2025 |
| 9 | Chinese Taipei (Taiwan) | 302 | 2024 | World Robotics 2025 |
| 10 | Switzerland | 294 | 2024 | World Robotics 2025 |
Other economies named in the same release: Canada 241, China 166 (22nd worldwide, sixth in Asia) and Mexico 62. The IFR also lists the Netherlands, Austria, Italy, Belgium and Luxembourg, France and Spain among the global top 20 but did not publish their individual figures in the press release, so we do not show estimated numbers for them here.
Regional averages (2024)
| Region | Robots per 10,000 manufacturing employees | Change vs 2023 | Source |
|---|---|---|---|
| Western Europe | 267 | +3% (record) | IFR, World Robotics 2025 |
| European Union (EU-27) | 231 | — | IFR, World Robotics 2025 |
| North America | 204 | +4% | IFR, World Robotics 2025 |
| Asia | 131 | +11% | IFR, World Robotics 2025 |
| World | 132 | — | IFR, World Robotics 2025 |
How the Ranking Changed: World Robotics 2024 vs 2025
The previous edition, published in November 2024 and covering 2023, looked noticeably different at the top.
| Economy | WR 2024 (2023 data) | Rank | WR 2025 (2024 data) | Rank |
|---|---|---|---|---|
| South Korea | 1,012 | 1 | 1,220 | 1 |
| Singapore | 770 | 2 | 818 | 2 |
| China | 470 | 3 | 166* | 22 |
| Germany | 429 | 4 | 449 | 3 |
| Japan | 419 | 5 | 446 | 4 |
| United States | 295 | 11 | 307 | 8 |
| World average | 162 | — | 132* | — |
Not comparable with the previous year: based on revised Chinese labour statistics (see below).
Three changes stand out:
- South Korea pulled further ahead, adding about 200 robots per 10,000 employees in one edition. That is partly more robots and partly a smaller or shifting manufacturing workforce — density is a ratio, so it rises when the denominator falls as well as when the numerator grows.
- The United States moved from 11th to 8th. Its density rose modestly (295 to 307), but the larger effect on rank came from China dropping out of the top group.
- The world average fell from 162 to 132. That does not mean the world de-automated. China is such a large share of global manufacturing employment that revising its workforce count pulls the global average down with it.
Why China's Figure Fell From 470 to 166
In the 2024 edition, the IFR announced that China had overtaken Germany and Japan in robot density, reaching 470 robots per 10,000 employees in 2023, up from 402 in 2022. In the 2025 edition, China is listed at 166 — 22nd in the world.
China did not lose robots. According to the IFR's World Robotics 2025 industrial-robot release (25 September 2025), China installed a record 295,000 robots in 2024 and its operational stock passed 2 million units — about 43% of the world's total. What changed is the denominator. The IFR now uses updated labour-market data from China's National Bureau of Statistics, which counts a much larger manufacturing workforce than the figure used previously. Dividing the same robot stock by a much larger number of workers produces a far lower density.
The IFR explicitly says the two figures are not comparable, and it notes that China's density grew 17% year-on-year on the new basis. The lesson for readers: when you see a robot-density number for China, check which edition it comes from. Articles written in late 2024 or early 2025 that call China "third in the world" were accurate for the data then available, but they are describing a different statistical series.
This revision also illustrates why density alone can mislead. China combines very large, highly automated plants — in electric vehicles, batteries and electronics — with a huge number of smaller, labour-intensive factories, including in rural areas. A single national ratio averages across all of them.
How Robot Density Is Measured
Understanding the metric helps in reading the ranking correctly.
The numerator: operational stock. The IFR estimates how many industrial robots are in use in each country. It builds this from annual installation data reported by robot suppliers and national robot associations, and it assumes an average service life — traditionally 12 years — after which robots are treated as retired. Stock is therefore an estimate, not a physical count.
The denominator: manufacturing employees. Employment figures come from national statistics and international databases. Because the denominator is manufacturing employment only, a country with a small manufacturing sector and a few very automated plants can score highly.
What counts as an industrial robot. The IFR follows the ISO 8373 definition: an automatically controlled, reprogrammable, multipurpose manipulator, programmable in three or more axes, used in industrial automation. That includes articulated arms doing welding, painting, assembly and handling, and collaborative robots (cobots) when used industrially. It excludes service robots — warehouse mobile robots, cleaning robots, surgical systems and most of the humanoid robots now in development (see our explainer on humanoid robots). The IFR reports those separately in World Robotics – Service Robots.
What density does not measure. It does not capture how productive each robot is, how sophisticated it is, or how well it is integrated with software. A modern robot cell with vision and force sensing — the kind of capability described in why robots need force sensors — counts the same as a 15-year-old spot welder.
South Korea: 1,220 Robots per 10,000 Workers
South Korea has topped the ranking every year for more than a decade, and its lead is now enormous: it has about one and a half times Singapore's ratio and nearly four times the US figure. The IFR reports average annual growth of about 7% since 2019.
The explanation is structural. South Korea's manufacturing is concentrated in sectors that are exceptionally robot-intensive: electronics and semiconductors, automobiles and batteries. These sectors use robots for welding car bodies, handling wafers and displays, and assembling small, precise components. Large conglomerates — Samsung, Hyundai Motor Group, LG and SK — run production at a scale where automation pays back quickly.
Demographics push the same way. South Korea's fertility rate is among the lowest in the world, and its working-age population is shrinking, which raises wages and makes labour scarcer. Our analysis of how demographics will reshape the global economy explains why ageing societies tend to substitute capital for labour. Government programmes supporting factory automation, including for smaller suppliers, have reinforced the trend.
It is worth stressing what 1,220 per 10,000 means: about one robot for every eight manufacturing employees, not "a fully automated workforce." Robots handle specific, repetitive or hazardous tasks; people still design, supervise, maintain, inspect and handle work that is too varied for current robots.
Singapore: 818 Robots per 10,000 Workers
Singapore's density has grown about 13% a year since 2019, according to the IFR, the fastest of the leading economies. The city-state's manufacturing sector is relatively small in employment terms but heavily weighted towards electronics, semiconductors, precision engineering and biomedical products — all highly automated activities.
A small denominator matters here. Singapore has deliberately moved away from labour-intensive manufacturing and towards capital-intensive, high-value production, much of it run by multinational firms. The result is that a few hundred thousand manufacturing workers share the floor with a dense installed base of robots. Wafer fabs, which move silicon between hundreds of process steps with automated handling systems, are a large part of that picture; see how semiconductor fabs work.
Germany and Japan: The Established Leaders
Germany (449) has the highest robot density in Europe and grew about 5% a year since 2019. Its car industry — one of the world's largest users of industrial robots — and its machinery sector drive the figure. Germany is also home to major robot makers and integrators; KUKA, headquartered in Augsburg, was acquired by China's Midea Group in 2016–17. Germany's "Industrie 4.0" programme, launched in 2011, has encouraged connected, sensor-rich production, though adoption among smaller Mittelstand firms has been slower than among large manufacturers.
Japan (446) is the mirror image of Germany in Asia. It is both a major user and the world's leading producer of industrial robots — companies such as Fanuc, Yaskawa, Kawasaki and Nachi supply factories worldwide. The IFR's World Robotics 2025 release reports 44,500 robots installed in Japan in 2024 (down 4%) and an operational stock of 450,500. Japan's ageing workforce makes automation a long-term necessity, and the government's "Society 5.0" policy frames robotics and AI as responses to labour shortages.
Germany was already just ahead of Japan in the previous edition (429 against 419), and the gap is still only a few robots per 10,000 workers; on this metric the two countries have been close for years.
The Nordic and Alpine Cluster: Sweden, Denmark, Slovenia, Switzerland
Four of the top ten are small European economies.
- Sweden (377) combines a large automotive and machinery base (vehicle and truck manufacturing, bearings, mining equipment) with a long robotics tradition.
- Denmark (329) is home to Universal Robots, a pioneer of collaborative robots, and has a strong cluster in food processing, pharmaceuticals and machinery — sectors that increasingly use cobots.
- Slovenia (315) owes its high position largely to its automotive supply industry, which is tightly integrated with German carmakers.
- Switzerland (294) specialises in precision engineering, watches, medical technology and pharmaceuticals.
Just outside this group sits Chinese Taipei (302), ninth in the world. Its position reflects a manufacturing base dominated by semiconductors, electronic components and contract electronics assembly, where wafer handling, test and packaging are heavily automated. Like Singapore, it shows how a specialised, export-driven electronics economy can reach high density without a large automotive sector.
In all four European economies, a relatively small manufacturing workforce working in export-oriented, high-wage industries pushes the ratio up.
The United States: 307 Robots per 10,000 Workers
The United States is eighth, with 307 robots per 10,000 manufacturing employees. In absolute terms it remains one of the largest robot markets: the IFR's World Robotics 2025 release reports 34,200 robot installations in the US in 2024, down 9% from the year before.
The US automotive industry is the largest single customer, but adoption is uneven. Large car plants and electronics facilities are highly automated, while much of US manufacturing — small machine shops, food processors, furniture makers — uses few or no robots. North America's average density (204) reflects this mix, and Mexico, whose manufacturing employs many more people at lower wages, stands at just 62.
Robot Installations in 2024: Who Is Buying
Density describes the installed base; installations show where new robots are going. Figures below are from the IFR's World Robotics 2025 industrial-robot release (25 September 2025).
| Country | Robots installed in 2024 | Change vs 2023 | Source |
|---|---|---|---|
| China | 295,000 | Record high | IFR, World Robotics 2025 |
| Japan | 44,500 | −4% | IFR, World Robotics 2025 |
| United States | 34,200 | −9% | IFR, World Robotics 2025 |
| South Korea | 30,600 | −3% | IFR, World Robotics 2025 |
| Germany | 26,982 | −5% | IFR, World Robotics 2025 |
| World | 542,000 | Second-highest on record | IFR, World Robotics 2025 |
Global installations were only 2% below the all-time record set two years earlier and exceeded 500,000 units for the fourth year in a row. Asia accounted for 74% of new deployments, Europe 16% and the Americas 9%. The global operational stock reached about 4.66 million robots, up 9%.
China's market is also changing hands. The IFR reports that Chinese robot makers held 57% of their home market in 2024, up from about 28% a decade earlier, and outsold foreign suppliers in China for the first time.
Do Robots Destroy Jobs?
This is the question most readers bring to a robot-density ranking, and the honest answer is that the evidence is mixed and depends on the level you look at.
Local labour markets can lose. The most cited study is Daron Acemoglu and Pascual Restrepo's "Robots and Jobs: Evidence from US Labor Markets" (Journal of Political Economy, 2020), which uses IFR robot data. Studying US commuting zones from 1990 to 2007, they estimate that one additional robot per thousand workers reduced the employment-to-population ratio by about 0.2 percentage points and wages by about 0.42%. The effects were concentrated in manufacturing, in routine manual jobs, and among workers without a college degree.
National outcomes can look different. The most robot-dense countries — South Korea, Singapore, Germany and Japan — have not had persistently high unemployment. That correlation does not prove robots create jobs; these economies also have ageing workforces and labour shortages, which is part of why they automate. Economists generally describe the effect as displacement in specific tasks and places, offset to varying degrees by productivity gains, new tasks and growth elsewhere.
The policy question is distribution. Even where total employment holds up, the workers who lose routine jobs are rarely the ones who get new jobs maintaining robots or designing automation. Our pieces on the future of work by 2030 and the thought experiment what if robots did all human work look at those questions more broadly.
Common Misconceptions
"High density means few factory workers." No. Even South Korea has roughly one robot per eight manufacturing employees. Density measures how much automation each worker has around them, not how many workers remain.
"China is the most automated country." China has by far the most robots and installs the most each year, but on the IFR's current per-worker basis its density is 166, below the global top 20.
"The global average fell, so automation is slowing." The 2025 drop from 162 to 132 is a statistical revision driven by Chinese employment data. Global robot stock actually rose 9% in 2024.
"Humanoid robots are included." They are not. The IFR's industrial-robot statistics count manipulators used in industry; service robots, including most humanoids, are tracked separately.
Frequently Asked Questions
Q: Which country has the most robots per worker? A: South Korea, with 1,220 industrial robots per 10,000 manufacturing employees in 2024, according to the IFR's World Robotics 2025. Singapore is second at 818, followed by Germany at 449 and Japan at 446.
Q: What is the global average robot density? A: The IFR puts it at 132 robots per 10,000 manufacturing employees for 2024. The previous edition reported 162 for 2023, but the two figures are not comparable because of revised Chinese employment data.
Q: Why did China's robot density drop so much? A: Because the denominator changed. The IFR switched to updated labour data from China's National Bureau of Statistics, which counts more manufacturing workers. China's robot stock still passed 2 million units in 2024, and it installed a record 295,000 robots that year.
Q: Where does the United States rank? A: Eighth worldwide, with 307 robots per 10,000 manufacturing employees in 2024, up from 295 and 11th place in the previous edition.
Q: What counts as an industrial robot? A: The IFR follows ISO 8373: an automatically controlled, reprogrammable, multipurpose manipulator programmable in three or more axes, used in industrial automation. Industrial cobots count; service robots such as warehouse vehicles, surgical systems and most humanoids do not.
Q: Does high robot density cause unemployment? A: Not in any simple way. US research by Acemoglu and Restrepo found local job and wage losses where robots spread fastest, but the most automated countries do not show persistently high unemployment. Effects depend on the sector, the region and how the gains are shared.
Q: How often is the ranking updated? A: The IFR publishes World Robotics annually. Installation figures usually appear in September, with country robot-density figures released separately, sometimes several months later.
The Bottom Line
On the IFR's latest figures, South Korea is the world's most automated manufacturing economy by a wide margin, followed by Singapore, Germany and Japan, with a cluster of small European economies and the United States rounding out the top ten. The headline numbers are useful, but they reward careful reading: density is a ratio, so it moves with the size of the workforce as well as with robot sales, and the 2025 revision of China's labour data shows how much a single statistical change can reshape a ranking. For a sense of where automation is going next, watch installations as well as density — and on that measure, China, which bought more than half the world's new industrial robots in 2024, is still setting the pace.
Sources
- IFR, "Robot Density Surges in Europe, Asia, and Americas" (World Robotics 2025 robot-density release, 8 April 2026): https://ifr.org/ifr-press-releases/news/robot-density-surges-in-europe-asia-and-americas
- IFR, "Global Robot Demand in Factories Doubles Over 10 Years" (World Robotics 2025 industrial-robot release, 25 September 2025): https://ifr.org/ifr-press-releases/news/global-robot-demand-in-factories-doubles-over-10-years
- IFR, "China Overtakes Germany and Japan in Robot Density" (World Robotics 2024 release, November 2024), as syndicated: https://www.silicon.co.uk/press-release/china-overtakes-germany-and-japan-in-robot-density-ifr-reports
- Acemoglu & Restrepo, "Robots and Jobs: Evidence from US Labor Markets," Journal of Political Economy 128(6), 2020: https://dspace.mit.edu/handle/1721.1/130324
Related Reading
Follow new articles
Add SciHub101 to your feed reader to see new science and technology stories.
About the Author
SciHub101 is an independent science and technology publication founded and edited by Buğra Sözeri, a software engineer and app developer based in Türkiye. AI tools assist with drafting and research. Source documentation in the existing archive is uneven, and articles are being reviewed and corrected. The Editorial Team byline identifies editorial responsibility; it does not certify specialist or independent human review. Where we compare products, anything built by our own team is labelled as such — see the editorial guidelines and About page for how corrections and disclosures work.
Related Articles

Countries With the Best 5G Coverage (2025)
5G reached about 55% of the world's population in 2025, per the ITU, but coverage, availability and speed are three different measurements. Germany reports 99.1% coverage while its 5G usage lags; South Korea's networks top speed tests. Here is what each ranking actually measures.

Countries With the Highest R&D Spending as % of GDP (2025)
Israel spent 6.35% of its GDP on research and development in 2023, the highest share of any country in World Bank data. See the top 20 by R&D intensity, how absolute spending compares, and why the two rankings tell different stories.
Countries That Produce the Most Semiconductors (2026)
Taiwan held 92% of the world's most advanced chip capacity in a 2021 study, South Korea dominates memory, and one Dutch company makes the only EUV lithography machines. Who controls which layer of the chip supply chain, with sourced figures.

Countries with the Most Robots in Manufacturing (Robot Density Ranked)
South Korea has 1,012 industrial robots per 10,000 manufacturing workers — the highest robot density ever recorded for a major economy. That is more than six times the global average of 162, and more than double Germany's figure. The IFR World Robotics 2024 report shows a world where automation in factories is accelerating faster than at any point in industrial history.
How 3D Printing Works — Additive Manufacturing
How 3D printing works explained: FDM, SLA, SLS, metal printing, materials, software workflow, real applications, and what additive manufacturing is good for.