Countries With the Most Supercomputers (June 2026 TOP500)
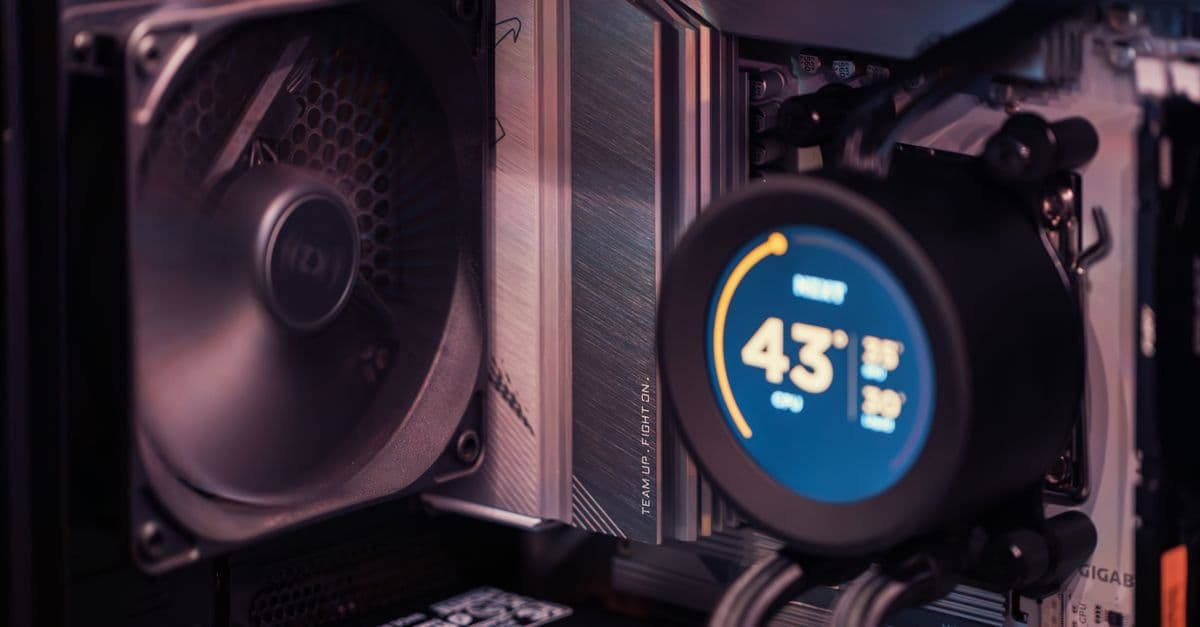
Photo: Matheus Bertelli / Pexels
Supercomputers are the machines countries build when an ordinary data center cannot answer the question. They simulate how a nuclear warhead ages without a test, forecast climate decades ahead, fold proteins, and train large AI models. The public scoreboard is the TOP500, a list of the 500 fastest systems that have been benchmarked and submitted. On the 67th edition, published in June 2026, the United States holds the most entries, while a Chinese machine sits at No. 1 for the first time in years.
That split, many American systems but a Chinese leader, is the key to reading the ranking. The numbers below come from the TOP500 project and a few cross-checks, and each table says which edition it reflects. Where sources disagree by a system or two, the article says so instead of picking a number quietly.
Key takeaways
- On the June 2026 TOP500, the United States has about 161 of the 500 systems, ahead of Japan (44), Germany (41), and China (about 30), according to TOP500-based tallies and HPC.rs.
- China's LineShine in Shenzhen is the fastest system at 2.198 exaflops on the LINPACK benchmark, the first Chinese No. 1 on the list since 2017, per TOP500.
- Five systems have reached one exaflop (10^18 operations per second): LineShine, El Capitan, Frontier, Aurora, and Europe's JUPITER Booster.
- System count and speed measure different things. Raw count rewards many mid-sized machines, while the top of the list rewards a few enormous national projects.
- The TOP500 only shows what operators choose to submit, so classified, commercial, and unsubmitted machines are invisible to it.
How the TOP500 decides who is fastest
The TOP500 has published a ranking twice a year, in June and November, with an archive that begins in June 1993. Systems are ranked by a single test called HPL, the High-Performance LINPACK benchmark, introduced by Jack Dongarra. HPL asks a machine to solve a very large dense system of linear equations using LU factorization with partial pivoting, a standard method that costs roughly two thirds of n cubed floating-point operations for an n-by-n problem, according to the TOP500 description of the benchmark.
Think of HPL as a standardized race on a fixed track. Every team runs the same course, so the times can be compared. But a track is not the whole sport, and a car tuned for that track may handle other roads worse. Supercomputer engineers know this, which is why HPL is now reported next to other tests.
Two numbers appear for each system. Rmax is the speed actually achieved during the benchmark run. Rpeak is the theoretical ceiling, the speed the hardware could reach if every arithmetic unit were busy every cycle. The gap between them says something about how well the machine's memory and network keep its processors fed.
What a FLOP is, and why the prefixes matter
A FLOP is one floating-point operation, such as adding or multiplying two decimal numbers. FLOPS (with an S) means operations per second. The prefixes climb by factors of 1,000, and the jump from one to the next is larger than it sounds.
| Prefix | Symbol | Operations per second | Where it showed up |
|---|---|---|---|
| Tera | TFLOPS | 10^12 | Top of the list in the late 1990s |
| Peta | PFLOPS | 10^15 | Fugaku measured 442 PFLOPS |
| Exa | EFLOPS | 10^18 | Five systems on the June 2026 list |
| Zetta | ZFLOPS | 10^21 | No system yet |
To put one exaflop in human terms: if each of about 8 billion people did one calculation per second, it would take roughly four years to match what a one-exaflop machine does in a single second. LineShine's measured 2.198 exaflops is more than twice that.
Which countries have the most supercomputers
Counting systems per country is the simplest way to rank national supercomputing strength, and also the easiest to misread. The count says how many machines from a country cleared the list's entry bar, which was 2.66 petaflops on the June 2026 list according to the TOP500 highlights page. It says nothing about how big the largest machine is.
| Rank | Country | Systems on June 2026 list | Note |
|---|---|---|---|
| 1 | United States | 161 to 162 | Holds El Capitan, Frontier, Aurora, Eagle |
| 2 | Japan | 44 | Fugaku at RIKEN |
| 3 | Germany | 41 | JUPITER Booster at Jülich |
| 4 | China | 30 to 31 | LineShine at No. 1 |
Source: Wikipedia's TOP500 article lists the US at 161 and China at 31; HPC.rs lists the US at 162 and China at 30. Both give Japan 44 and Germany 41. The difference of one system is likely a counting or edition-timing difference, so this article treats the figures as approximate.
The United States also holds the largest share of total list performance. Wikipedia's summary puts it at 37.5 percent for the June 2026 list. By contrast, a third-party analysis of the November 2025 list gave the US 171 systems and 44.2 percent of total Rmax, so the American position slipped between editions even as it kept the most entries.
A wider snapshot from the November 2025 list
The June 2026 per-country breakdown beyond the top four is not published in one place that this article could verify. For the rest of the field, the table below uses a third-party tally of the previous edition, the November 2025 list, compiled by developer Mete Balci in his analysis of the list. Treat these as a snapshot from seven months earlier, not as current counts.
| Country | Systems (Nov 2025) | Share of total Rmax |
|---|---|---|
| United States | 171 | 44.20% |
| Japan | 43 | 8.56% |
| Germany | 40 | 7.53% |
| China | 40 | 0.62% |
| France | 22 | 1.42% |
| Canada | 19 | 0.28% |
| Italy | 18 | 5.22% |
| South Korea | 15 | 1.22% |
| Brazil | 10 | 0.50% |
| United Kingdom | 9 | 2.39% |
| Sweden | 8 | 0.15% |
| Poland | 8 | 0.13% |
| Netherlands | 7 | 1.66% |
| Saudi Arabia | 7 | 0.97% |
| India | 6 | 0.56% |
| Russia | 5 | 0.14% |
| United Arab Emirates | 5 | 0.73% |
Two lessons stand out. First, count and performance share diverge sharply: Canada had 19 systems but under a third of one percent of total performance, while Italy had 18 systems and over five percent, because a few large machines such as Leonardo and HPC6 do most of the work. Second, China's 40 systems carried only 0.62 percent of total Rmax in that tally, and the same analysis notes that only Sunway TaihuLight had a meaningful score. TOP500 commentary quoted there says China's true performance "may be significantly underrepresented." That changed in June 2026 with the arrival of LineShine.
How the count has moved over time
China's presence on the list has been anything but steady. The Wikipedia table of system counts shows China peaking at 228 systems in November 2019, then declining to the low dozens by 2026. Wikipedia attributes China's low publicly known share of list performance to the secrecy of the latest Chinese programs, and Mete Balci's analysis notes that China had not submitted a new system since 2016 before LineShine. The fall in the count therefore tells you about reporting behavior at least as much as about hardware.
The top 10 fastest supercomputers in June 2026
The top of the list looks very different from the system counts. Here are the ten fastest machines, with figures from the June 2026 TOP500 list.
| Rank | System | Site, country | Rmax (PFLOPS) | Rpeak (PFLOPS) | Cores |
|---|---|---|---|---|---|
| 1 | LineShine | NSCS Shenzhen, China | 2,198.4 | 2,735.8 | 13,789,440 |
| 2 | El Capitan | Lawrence Livermore, USA | 1,809.0 | 2,821.1 | 11,340,000 |
| 3 | Frontier | Oak Ridge, USA | 1,353.0 | 2,055.7 | 9,066,176 |
| 4 | Aurora | Argonne, USA | 1,012.0 | 1,980.0 | 9,264,128 |
| 5 | JUPITER Booster | EuroHPC/Jülich, Germany | 1,000.0 | 1,226.3 | 4,801,344 |
| 6 | HPC7 (new) | Eni, Italy | 571.5 | 861.1 | 3,461,472 |
| 7 | Eagle | Microsoft Azure, USA | 561.2 | 846.8 | 2,073,600 |
| 8 | HPC6 | Eni, Italy | 477.9 | 607.0 | 3,143,520 |
| 9 | Fugaku | RIKEN R-CCS, Japan | 442.0 | 537.2 | 7,630,848 |
| 10 | Alps | CSCS, Switzerland | 434.9 | 574.8 | 2,121,600 |
By country, the top 10 holds four American systems, two Italian, and one each from China, Germany, Japan, and Switzerland. Two of the ten belong to a single company, the Italian energy firm Eni, and one is a commercial cloud system. Not every entry in the top tier is a government laboratory.
The top five together deliver about 7.37 exaflops, roughly 39 percent of the list's total of about 18.7 exaflops, based on figures on the TOP500 highlights page. That concentration is why a single new machine can reshuffle the national story overnight. LineShine alone is more than 11 percent of the whole list.
Efficiency: how much of the paper speed do these machines deliver?
Rpeak is a ceiling. The ratio of Rmax to Rpeak shows how close a system gets to it during the benchmark. Dividing Rmax by the listed power draw gives a rough efficiency figure in gigaflops per watt. The table below is calculated from the TOP500 list figures, not copied from the project.
| System | Rmax / Rpeak | Power (MW) | Rmax per watt (GFLOPS/W) |
|---|---|---|---|
| LineShine | 80.4% | 42.2 | 52.1 |
| El Capitan | 64.1% | 29.7 | 60.9 |
| Frontier | 65.8% | 24.6 | 55.0 |
| Aurora | 51.1% | 38.7 | 26.1 |
| JUPITER Booster | 81.5% | 15.8 | 63.3 |
| HPC7 | 66.4% | 8.7 | 65.4 |
| HPC6 | 78.7% | 8.5 | 56.5 |
| Fugaku | 82.3% | 29.9 | 14.8 |
| Alps | 75.7% | 7.1 | 61.0 |
The TOP500 itself reports LineShine at 52.07 gigaflops per watt and El Capitan at 60.94, which matches the calculation. Fugaku's older design shows in the last column: it delivers about 15 gigaflops per watt, a quarter of what the newest GPU machines reach. Efficiency is where the generational gap is plainest.
Notice that Aurora's Rmax is barely half of its Rpeak. A low ratio does not mean the machine is bad. It often means the benchmark stresses parts of the system differently than the workloads it was built for. Aurora does far better on the mixed-precision AI benchmark, as the section on alternative benchmarks below shows.
The Green500, a companion list ranked purely by efficiency, tells a different story from the main one. Its June 2026 leaders are small European systems: KAIROS in France at 73.3 gigaflops per watt, ROMEO-2025 in France at 70.9, and Levante's GPU extension in Germany at 69.4, per the TOP500 highlights. The most efficient machines are not the fastest ones.
China: LineShine and the question of what is not on the list
LineShine is a surprise in several ways. According to the TOP500 announcement, it debuted at 2.198 exaflops, about 80 percent of its theoretical peak, on a CPU-only design with 13.79 million cores. It draws about 42.2 megawatts. The platform is called LingKun, and the listing names the processor as the LX2 304C. TOP500 calls this the first time since 2017 that a Chinese system has led the list.
CPU-only matters. Nearly every other top machine pairs CPUs with GPU accelerators, which do most of the arithmetic. LineShine reaches the top on general-purpose processors, a design choice that reflects the constraints China faces in buying advanced accelerators. The listing does not tell us how much of the chip stack is domestically produced beyond the platform name, and this article does not guess.
The earlier history helps. Tianhe-2 topped the list in the mid-2010s at about 34 petaflops, and Sunway TaihuLight took the lead in June 2016 with a domestically designed processor, the SW26010, holding No. 1 until the American Summit system overtook it in June 2018, per Wikipedia's TaihuLight entry. TaihuLight ran at about 15 megawatts and used more than 10 million cores. Each generation pushed the country toward home-grown processors.
Why China's count fell while its capability did not
China's system count fell from its November 2019 peak of 228 to roughly 30 by June 2026. That is not evidence that China built fewer computers. Wikipedia's TOP500 article attributes China's low visible share to secrecy around its latest programs. Many Chinese machines are widely believed to exist but have not appeared in recent years, and some may serve military or commercial users who gain nothing from publishing a benchmark.
The honest reading: LineShine is proof of at least one top-tier Chinese system, and the low count is a reporting artifact of unknown size. Anyone who claims to know China's true total is guessing. Claims that China's hidden capacity matches America's circulate widely, but no public source supports a number, so this article does not offer one.
The United States: three of the five exascale machines
The United States holds three of the five exaflop systems, all built under the Department of Energy and its laboratories. They represent three different hardware philosophies.
Frontier at Oak Ridge National Laboratory was the first. The laboratory announced on May 30, 2022 that Frontier measured 1.1 exaflops on HPL, ahead of Summit's 148.6 petaflops, according to the Oak Ridge announcement. It uses 74 HPE Cray cabinets holding 9,472 nodes, each with one AMD EPYC processor and four AMD Instinct accelerators, for 37,888 GPUs in total, per Wikipedia's Frontier entry. Estimated cost is about $600 million. Its measured speed has since risen to 1.353 exaflops as software was tuned.
El Capitan at Lawrence Livermore National Laboratory is now the American flagship, at 1.809 exaflops. It uses AMD's MI300A, a chip that combines CPU and GPU cores in one package sharing memory. El Capitan's job is national security work, including stockpile stewardship, the practice of simulating the aging of nuclear weapons instead of testing them. That is the plainest example of why a government will fund a machine like this. For more on the weapons side of the national picture, see the ranking of countries with the most nuclear weapons.
Aurora at Argonne National Laboratory runs on Intel hardware, the Xeon CPU Max and Data Center GPU Max, and measures 1.012 exaflops. It is the least efficient of the five on HPL, at about 26 gigaflops per watt and a 51 percent Rmax-to-Rpeak ratio, but it posts the second-highest result on the mixed-precision AI benchmark. It was designed to mix simulation with AI workloads.
Eagle, ranked seventh, is a different animal: a Microsoft Azure cloud system with 2.07 million cores and 561.2 petaflops. Its presence shows that commercial cloud providers now operate machines on the scale of national laboratories. (The TOP500 page lists an implausible power figure for Eagle, 8 kW, which looks like a data entry issue, so no efficiency is calculated for it above.)
What exascale machines actually do
Frontier's users at Oak Ridge work on fusion energy, materials science, combustion engines, cosmology, small modular reactors, and disease genetics, among other fields, according to the Oak Ridge Leadership Computing Facility. The common thread is simulation. When an experiment is too expensive, too dangerous, or physically impossible, a supercomputer builds a model of it and runs it.
A useful analogy is a wind tunnel made of mathematics. An aircraft designer can test a wing in a physical tunnel, but a supercomputer can test thousands of variants without cutting any metal. As machines grow, the grid used to represent the air gets finer, and the answers get closer to what reality would show.
Europe: pooling money to compete
No single European country matches the American or Chinese national programs, so Europe pooled resources. The EuroHPC Joint Undertaking began operating on November 6, 2018, under Council Regulation (EU) 2018/1488 (later replaced by Regulation 2021/1173), and was made autonomous from the European Commission in September 2020, per Wikipedia's entry on the joint undertaking. For 2021 to 2027 it has a budget of about €7 billion, split among the EU budget (€3 billion), participating countries (a similar amount), and private members (€900 million).
The result is a network of machines located across the continent. According to the EuroHPC list of supercomputers, these include:
| System | Location | Sustained performance (PFLOPS) | Status |
|---|---|---|---|
| JUPITER | Jülich, Germany | 1,000 | Operational |
| LUMI | Kajaani, Finland | 386 | Operational |
| Leonardo | Bologna, Italy | 249 | Operational |
| MareNostrum 5 | Barcelona, Spain | 215 | Operational |
| Arrhenius | Linköping, Sweden | 66.8 | Operational |
| Alice Recoque | Bruyères-le-Châtel, France | 1,000 (expected) | Planned |
| DAEDALUS | Attica, Greece | 89 (expected) | Planned |
JUPITER Booster is Europe's first exascale system on HPL, at exactly 1,000 petaflops. It is also notably efficient, with a high Rmax-to-Rpeak ratio and about 63 gigaflops per watt, using NVIDIA GH200 chips. LUMI and Leonardo sit just outside the top 10, at ranks 11 and 12. Arrhenius in Sweden entered the list at No. 42 in June 2026, according to EuroHPC; HPC.rs also reports the Greek DAEDALUS among the new top-50 entries, although EuroHPC still describes DAEDALUS as planned.
The European model treats computing time as a shared resource. A researcher in any participating state can apply for time on EuroHPC machines, which spreads the cost and avoids duplicating machines in each capital. The trade-off is slower decision-making and a split between machines owned nationally and those owned jointly. Beyond the pooled systems, Italian energy company Eni runs two of the world's ten fastest, HPC6 and the new HPC7, and Switzerland's Alps system at CSCS ranks tenth.
Japan: designing the chip, not buying it
Japan's Fugaku at RIKEN took the No. 1 position in June 2020 and held it until Frontier overtook it in May 2022, per Wikipedia's Fugaku entry. It was the first machine to lead the TOP500, HPCG, HPL-AI, and Graph500 benchmarks at the same time. Its processor is Fujitsu's A64FX, an ARM-based CPU designed for scientific work, with 158,976 nodes in the full system. The program cost on the order of US$1 billion over its life.
Fugaku's approach contrasts with the American GPU model. Instead of buying general-purpose accelerators, Japan designed its own processor with very high memory bandwidth, because many scientific codes are limited by how fast they can move data, not how fast they can multiply. That choice shows in the HPCG results: on the June 2026 HPCG list, Fugaku scores 16.00 petaflops, third place on that benchmark, despite ranking ninth on HPL.
During the COVID-19 pandemic, Fugaku was used to study how droplets spread around masks and face shields. Its simulations favored non-woven masks and found face shields ineffective at trapping aerosols, as the Fugaku entry summarizes. Japan has 44 systems on the list, second only to the United States, though its largest is now ninth.
Why the same few countries keep showing up
Supercomputing leadership clusters in a handful of countries for reasons that are easy to name and hard to change. Three overlapping requirements matter.
Money. A top machine costs hundreds of millions of dollars to build, with an estimated $600 million for Frontier, and the electricity bill continues after purchase. LineShine draws about 42 megawatts, Aurora nearly 39. Operating costs rise with the power meter, which is why efficiency is not just an environmental concern.
Chips. The processors and accelerators come from a short list of designers and, ultimately, a short list of factories. The extreme-ultraviolet lithography machines that print the finest circuits come from a single company, ASML, as the explainer on why semiconductors are so hard to make describes. A country that cannot buy or make the newest chips has to find another route, such as many more general-purpose cores, which is the path LineShine appears to take. How the chips themselves work is covered in semiconductor chips: how they work.
Institutions. Supercomputers need laboratories with long budgets, software teams that last decades, and users with problems worth solving. Oak Ridge, Livermore, Argonne, RIKEN, Jülich, and the Shenzhen center all fit this description. Wealth alone is not enough: Saudi Arabia, the UAE, and Brazil all appear in the November 2025 tally with multiple systems but nothing near the top.
The list is not the whole picture
The TOP500 is a ranking of systems that ran a benchmark and submitted the result. Several large categories of computing sit partly or entirely outside it.
- Classified machines. National security agencies run systems that do not publish scores.
- Unsubmitted commercial clusters. Large technology companies operate enormous AI training clusters. Some appear, as Eagle does, but many do not, and the list does not require them to.
- Systems that run HPL but not at full scale. Running the benchmark takes machine time that would otherwise serve users, so some operators skip it.
The rise of AI changes the picture further. Training a large model is a different workload from the dense linear algebra that HPL measures, and the data centers built for it are measured in power capacity rather than flops. For that side of the story, see the ranking of countries with the most data centers and the explainer on the carbon footprint of AI and energy per query. For the energy side, AI data center energy optimization at Google DeepMind covers one response to the demand.
Other benchmarks, other winners
Because HPL measures one kind of problem, the TOP500 project also publishes HPCG, which stresses memory access and communication, and HPL-MxP, which uses mixed precision to match AI-style arithmetic. In June 2026 the leaders differ from the main list:
| Benchmark | What it stresses | June 2026 leaders |
|---|---|---|
| HPL (TOP500) | Dense linear algebra, 64-bit | LineShine 2.198 EF, El Capitan 1.809 EF |
| HPCG | Memory and network, sparse problems | LineShine 22.00 PF, El Capitan 17.41 PF, Fugaku 16.00 PF |
| HPL-MxP | Mixed precision, AI-style | El Capitan 16.7 EF, Aurora 11.6 EF, Frontier 11.4 EF |
The HPL-MxP list shows how much the arithmetic format matters. El Capitan reaches 16.7 exaflops with reduced precision, roughly nine times its 64-bit HPL result of 1.809 exaflops (16.7 divided by 1.809 is about 9.2). These numbers are not directly comparable with the HPL column, since lower precision does less work per operation and tolerates more error, but they are closer to what machine learning code does.
What comes next: zettascale, quantum, and the power wall
Zettascale, 1,000 times an exaflop, is the next named milestone, but no system is close. Between exascale and zettascale the obstacle is not mainly processors, it is power. LineShine already draws 42 megawatts for about two exaflops. Scaling that by 500 with the same technology is unrealistic, so efficiency gains of at least an order of magnitude have to come from chips, memory, cooling, and software together.
Quantum computers are sometimes described as the successor. They are better understood as a different tool for a narrow set of problems. For an explanation of what they can and cannot do, see how quantum computers actually work. They do not replace the simulation workloads that national laboratories run on classical machines.
Frequently asked questions
Q: Which country has the most supercomputers? A: The United States, with about 161 of the 500 systems on the June 2026 TOP500. Japan has 44, Germany 41, and China about 30. Sources differ by one system for the US and China, and the list only counts machines whose operators submit benchmark results.
Q: What is the fastest supercomputer in the world? A: LineShine, at the National Supercomputing Centre in Shenzhen, China, which measured 2.198 exaflops on the LINPACK benchmark for the June 2026 list. El Capitan at Lawrence Livermore National Laboratory is second at 1.809 exaflops, and Frontier at Oak Ridge is third at 1.353.
Q: How many exascale supercomputers exist? A: Five systems have measured at least one exaflop on HPL as of June 2026: LineShine, El Capitan, Frontier, Aurora, and JUPITER Booster. Frontier was the first, announced by Oak Ridge on May 30, 2022. JUPITER, at exactly 1.000 exaflops, is Europe's only one so far.
Q: What is an exaflop? A: An exaflop is one quintillion (10^18) floating-point operations per second. It is 1,000 petaflops. The previous scale, petaflops (10^15), was where the fastest machines operated roughly a decade earlier.
Q: Does China have more supercomputers than the list shows? A: Possibly, but nobody outside the programs can say how many. China's count on the list peaked at 228 in November 2019 and has fallen to about 30, and Wikipedia attributes its low visible share to secrecy around the latest Chinese programs. LineShine's June 2026 debut shows China submitting a top system again.
Q: Why does Europe have so few of the very fastest machines? A: Individual European countries have smaller national budgets, so they pooled money through EuroHPC, which has about €7 billion for 2021 to 2027. That produced JUPITER, LUMI, Leonardo, and MareNostrum 5. Europe has one exascale system on HPL, against three in the United States.
Q: Are cloud AI clusters counted? A: Only if the operator submits them. Microsoft's Eagle is on the list at No. 7. Many other large commercial clusters are not, and AI training performance is not what the TOP500's HPL benchmark measures.
The bottom line
A supercomputer ranking is a record of choices as much as of engineering. The United States has the most systems because many laboratories, universities, and companies run machines and submit them. China holds the top spot because one national center built something very large, on its own processor platform, and chose to publish the result. Europe's strength comes from sharing the bill, and Japan's from designing its own silicon.
The practical lesson is to ask what is being counted before comparing nations. System count measures breadth, the top ten measures peak ambition, and benchmark mix measures what the machine is good at. The next shift to watch is power, because the machines at the top already consume tens of megawatts and every further step will be limited by the electricity and cooling needed to run them.
Sources
- TOP500 June 2026 list, ranks 1 to 10
- TOP500 June 2026 highlights
- TOP500 announcement: LineShine debuts at No. 1
- TOP500 description of the LINPACK benchmark
- Oak Ridge National Laboratory: Frontier debuts as the world's fastest
- Oak Ridge Leadership Computing Facility: Frontier
- EuroHPC JU: our supercomputers
- Wikipedia: European High-Performance Computing Joint Undertaking
- Wikipedia: TOP500, Frontier, Fugaku, Sunway TaihuLight
- HPC.rs: TOP500 June 2026 country counts
- Mete Balci: State of supercomputers around the world (November 2025 list)
Related Reading
- Countries With the Most Tech Workers and Software Developers (2025)
- Countries With the Most Industrial Robots Per Worker (IFR World Robotics 2025)
- Countries With the Best 5G Coverage (2025)
- Countries With the Highest R&D Spending as % of GDP (2025)
- Countries With the Most Renewable Energy Capacity (2025)
Follow new articles
Add SciHub101 to your feed reader to see new science and technology stories.
About the Author
SciHub101 is an independent science and technology publication founded and edited by Buğra Sözeri, a software engineer and app developer based in Türkiye. AI tools assist with drafting and research. Source documentation in the existing archive is uneven, and articles are being reviewed and corrected. The Editorial Team byline identifies editorial responsibility; it does not certify specialist or independent human review. Where we compare products, anything built by our own team is labelled as such — see the editorial guidelines and About page for how corrections and disclosures work.
Related Articles
Countries With the Most Tech Workers and Software Developers (2025)
Sweden has the highest share of ICT specialists in Europe at 8.6% of employment, Israel's high-tech sector employs about 11.5% of its workforce, and China, India and the US lead on sheer numbers. Here is what official statistics show, and what counts as a tech worker.
Top 10 Motorcycles to Buy in 2025 — Best Bikes Ranked
The Ducati Panigale V4 R produces 240 hp — more than many supercars. The Honda Gold Wing weighs 365 kg and has a 6-speed automatic gearbox. The Royal Enfield Meteor is the world's best-selling 350cc bike. Here are the 10 best motorcycles of 2025 ranked across every category.
How the Transistor Changed Everything
Demonstrated at Bell Labs in December 1947, the transistor became the building block of every digital device on earth.

How Facial Recognition Works: From Pixels to Face Embeddings
Facial recognition turns a face into a short list of numbers and compares it with stored lists. Here is how detection, embeddings, and thresholds work, and why error rates differ across groups and settings.

How Social Engineering Hacking Works — Why Humans Are the Weakest Link
The most sophisticated cyberattacks don't exploit code — they exploit people. Here's how phishing, pretexting, spear phishing, and vishing manipulate human psychology to bypass any technical defense.
How Ransomware Works — The Cybercrime That Shuts Down Hospitals
Ransomware has crippled hospitals, pipelines, and governments. Here is the technical reality of how attackers get in, encrypt files, steal data, and get paid, and which defenses hold up.