Web Performance Optimization — Core Web Vitals 2026
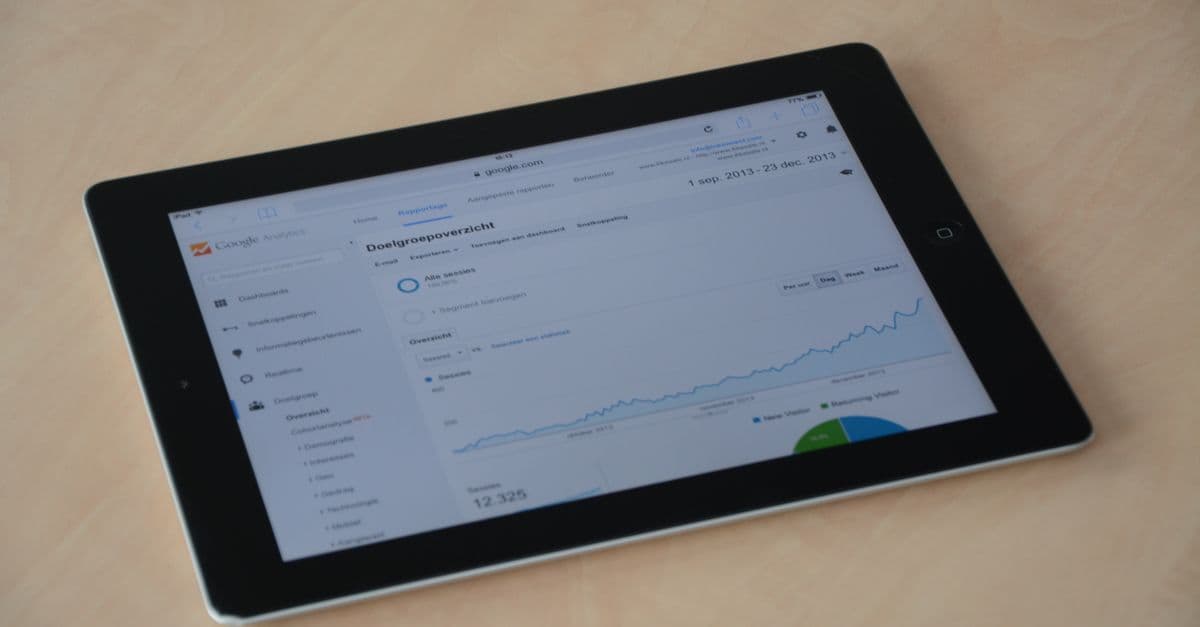
Photo: weCare Media / Pexels
A slow website is not a cosmetic problem. It is a revenue leak, a search-ranking penalty, and — for anyone building on a modern JavaScript framework — usually a symptom of the same handful of preventable mistakes: unoptimized images, an oversized JavaScript bundle, and no caching strategy. This guide walks through what Google actually measures under Core Web Vitals, why each metric moves the needle on conversions, and the specific, testable fixes that take a site from a Lighthouse score in the 40s to the 90s.
Think of a web page the way you'd think of a restaurant kitchen order. The customer doesn't care how elegant your code is behind the counter — they care how fast the plate hits the table, and whether the table wobbles once it's there. Core Web Vitals is Google's way of measuring exactly that: how fast the "plate" (main content) arrives, how quickly the kitchen (your JavaScript) responds when the customer asks for something, and whether anything shifts underneath them while they're trying to order.
Why Speed Is a Business Metric, Not a Technical One
Site speed data consistently shows a direct line from load time to revenue. A large-scale study run by Google, the media agency 55, and Deloitte tracked over 30 million user sessions across 37 retail, travel, luxury, and lead-generation sites in Europe and the US, monitoring mobile load times hour-by-hour for 30 days. The finding: even a 0.1-second improvement in load time moved users measurably further through the purchase funnel — retail conversions rose 8.4% and average order value rose 9.2% for sites that shaved that fraction of a second off (web.dev case study).
That number is worth sitting with. A tenth of a second is roughly the time it takes to blink. Multiply that sensitivity across millions of sessions and a "minor" performance regression stops looking minor.
| Load Time | Typical Bounce Rate Impact | Business Signal |
|---|---|---|
| Under 2 seconds | Baseline | Users complete tasks without friction |
| 2–3 seconds | Noticeably higher | Users start abandoning slow flows |
| 3–5 seconds | High | Cart abandonment and drop-off accelerate |
| Over 5 seconds | Very high | Majority of mobile visits abandon before content loads |
Table: Directional relationship between load time and visitor abandonment, consistent with Google/Deloitte mobile speed research and Google's own PageSpeed Insights guidance on abandonment risk.
Speed also feeds directly into how Google ranks a page. Core Web Vitals have been part of Google's page experience ranking signals since 2021, and Google has continued to update the underlying metrics — most notably retiring First Input Delay (FID) in favor of Interaction to Next Paint (INP) in March 2024 (Google Search Central). If your performance content or dashboards still reference FID as a live metric, it's out of date.
Core Web Vitals in 2026: LCP, INP, CLS
Google measures three vitals, each targeting a different kind of user frustration: content that takes forever to appear, a page that ignores your tap, and a layout that jumps around while you're trying to read or click.
| Metric | What It Measures | "Good" Threshold |
|---|---|---|
| LCP (Largest Contentful Paint) | Time until the largest visible element (hero image, headline block) renders | Under 2.5 seconds |
| INP (Interaction to Next Paint) | Responsiveness across every interaction during the visit, not just the first one | Under 200 milliseconds |
| CLS (Cumulative Layout Shift) | How much visible content jumps around unexpectedly | Under 0.1 |
These thresholds are measured at the 75th percentile of real-world visits recorded in Google's Chrome User Experience Report (CrUX), meaning at least 75% of a page's real visitors need to hit the "good" bucket for the URL to be classified as passing (web.dev, Defining the Core Web Vitals thresholds).
Why INP replaced FID
FID only measured the delay before the browser started processing a user's first click or tap — it said nothing about how long the browser then took to actually respond, and it ignored every interaction after the first one. INP measures the full lifecycle of every interaction throughout the visit: input delay, processing time, and the time until the next frame paints. Google rolled INP into Core Web Vitals in May 2023 and made it the official replacement for FID on March 12, 2024 (Google Search Central Blog). In practice, INP is a stricter, more honest metric — a page can pass FID with flying colors while still feeling sluggish every time a user clicks a filter or opens a menu, because FID never looked past that first tap.
How to measure your own site
You don't need paid tools to get a real Core Web Vitals reading. In Chrome:
- Right-click the page and choose Inspect.
- Open the Lighthouse tab in DevTools.
- Click Analyze page load.
- Read the score (0–100) plus the individual LCP, INP, and CLS values.
A Lighthouse score of 90 or above is the commonly cited "green" target, but the Lighthouse lab score and your real CrUX field data (visible in Google Search Console's Core Web Vitals report) can diverge — lab tests run on a fixed, often fast connection, while CrUX reflects your actual visitors on their actual phones and networks. Treat Lighthouse as a diagnostic tool and CrUX/Search Console as the source of truth for what Google actually uses in ranking.
Fix #1: Images, the Biggest Lever You Have
Since images make up over a third of a typical page's weight, this is where optimization work returns the most for the least effort.
Compress before you ship
A photo straight out of a modern phone camera or DSLR can easily run 2–5 MB. Run it through a compressor and it typically drops to a few hundred kilobytes with no visible quality loss, because most of that original file size is redundant color and metadata information the eye never notices missing.
Reliable free tools:
- Squoosh (squoosh.app) — Google's own browser-based compressor, lets you compare formats side by side
- TinyPNG (tinypng.com) — drag-and-drop batch compression
- ImageOptim (imageoptim.com) — macOS batch tool, strips metadata too
Serve modern formats
WebP and AVIF both compress more efficiently than legacy JPEG and PNG for equivalent visual quality, which is why HTTP Archive's own Web Almanac tracks format adoption as a core performance signal (HTTP Archive Page Weight report). The <picture> element lets a browser pick the best format it supports and fall back gracefully:
<picture>
  <source srcset="image.avif" type="image/avif">
  <source srcset="image.webp" type="image/webp">
  <img src="image.jpg" alt="Description" width="800" height="600">
</picture>
Always set explicit width and height (or aspect-ratio in CSS) on images. This is what actually prevents CLS — the browser reserves the space before the image downloads, so nothing jumps when it arrives.
Lazy load below-the-fold images
<img src="image.jpg" loading="lazy" alt="Description" width="800" height="600">
loading="lazy" is a native browser attribute — no library needed — and it defers loading images until the user scrolls near them. Don't apply it to your hero/LCP image, though: lazy-loading the very element Google is timing for LCP will make that metric worse, not better.
Serve the right size per device
<img
  srcset="small.jpg 480w, medium.jpg 768w, large.jpg 1200w"
  sizes="(max-width: 480px) 100vw, (max-width: 768px) 50vw, 33vw"
  src="large.jpg"
  alt="Description"
>
A phone on a 480px-wide screen has no business downloading a 1200px desktop hero image. srcset and sizes let the browser make that choice itself, which is far more reliable than trying to detect device type server-side.
Fix #2: JavaScript Bundle Size and Code Splitting
The problem
Framework apps — React, Vue, Angular — bundle everything into JavaScript by default unless you tell the build tool otherwise. A dashboard, a settings page, and a checkout flow can all end up in the same file a first-time visitor downloads just to see your homepage.
Code splitting
import { lazy, Suspense } from 'react';

const Dashboard = lazy(() => import('./Dashboard'));

export default function App() {
  return (
    <Suspense fallback={<div>Loading...</div>}>
      <Dashboard />
    </Suspense>
  );
}
lazy() tells the bundler to split Dashboard into its own chunk, downloaded only when a user actually navigates there. The initial bundle a first-time visitor pays for shrinks, which directly improves both LCP (less JavaScript competing for bandwidth and the main thread) and INP (less code the browser has to parse before it can respond to input).
Tree shaking
// Pulls in the entire library, including code you never call
import _ from 'lodash';

// Pulls in only the function you actually use
import debounce from 'lodash/debounce';
Modern bundlers (Vite, esbuild, Webpack 5+) can eliminate unused exports automatically when you use ES module imports correctly — but importing an entire default-exported library object, as in the first example, defeats that analysis. Import named functions directly wherever the library supports it.
Defer and async
<script src="analytics.js" defer></script>
<script src="third-party-widget.js" async></script>
defer downloads the script in the background but waits to execute it until the HTML is fully parsed, in document order. async downloads and executes as soon as it's ready, out of order, which is fine for scripts that don't depend on anything else on the page (most analytics and ad tags). Neither should be used for scripts your initial render actually depends on.
Fix #3: Caching and CDNs
Browser caching
Cache headers tell a returning visitor's browser it doesn't need to re-download a file it already has:
Cache-Control: max-age=31536000, immutable   /* hashed CSS/JS bundles — 1 year */
Cache-Control: max-age=3600                   /* HTML — 1 hour, so updates propagate */
Cache-Control: max-age=86400                  /* images — 1 day */
The immutable flag combined with a content hash in the filename (e.g., app.a1b2c3.js) is the standard pattern build tools like Vite and Next.js already use — when the file content changes, the filename changes, so a year-long cache lifetime is safe.
CDN caching
A Content Delivery Network (a network of servers positioned geographically close to your users, so requests don't have to cross oceans) caches your static assets at edge locations worldwide. A request from Tokyo served by a Tokyo edge node avoids the round trip to a server sitting in Virginia or Frankfurt, and that round-trip distance is the dominant cost in network latency for geographically distant users. Cloudflare, Vercel's Edge Network, and Fastly all offer this by default on their standard hosting tiers — it typically requires zero configuration once DNS is pointed at them.
Fix #4: Fonts
Web fonts are a common, underrated cause of slow LCP and layout shift, because the browser has to download the font file before it can paint text in that font — and if it doesn't know the font's exact metrics in advance, it may reflow the page once the font arrives.
Option 1: system fonts (zero download cost)
body {
  font-family: -apple-system, BlinkMacSystemFont, "Segoe UI", sans-serif;
}
This uses whatever font is already installed on the device — no network request at all.
Option 2: font-display: swap
@font-face {
  font-family: 'CustomFont';
  src: url('font.woff2') format('woff2');
  font-display: swap;
}
swap tells the browser to render text in a fallback font immediately and swap in the custom font once it loads, instead of leaving text invisible ("flash of invisible text") while it waits.
Option 3: limit how many fonts you load
Every font weight and style — regular, bold, italic — is a separate file download. Two font families at two weights each is a very different budget than five families at four weights each.
Fix #5: Minification and Compression
Minification strips whitespace, comments, and shortens variable names without changing behavior:
// Before
function greet(name) {
  const message = `Hello, ${name}!`;
  console.log(message);
  return message;
}

// After minification
function g(e){const t=`Hello, ${e}!`;return console.log(t),t}
This is handled automatically by any modern build tool (Vite, esbuild, Webpack, Next.js's compiler) — you should never need to do it by hand. On top of minification, enable gzip or, better, Brotli compression at the server or CDN level; both are supported natively by Vercel, Netlify, and Cloudflare, and Brotli typically compresses text assets 15–20% smaller than gzip at equivalent settings.
What a Real Before/After Looks Like
The numbers below are illustrative of the kind of shift these fixes typically produce together, not a single documented case — treat them as the shape of the improvement, not a guarantee.
| Metric | Before | After |
|---|---|---|
| LCP | 4.2s (poor) | 1.5s (good) |
| INP | Sluggish, unoptimized main thread | Well under 200ms |
| CLS | 0.4 (poor) | 0.05 (good) |
| JS bundle | ~400 KB, single file | ~85 KB initial, code-split |
| Total image weight | ~2.8 MB, uncompressed JPEG/PNG | ~280 KB, compressed WebP |
| Lighthouse score | 45/100 | 96/100 |
Table: Typical composition of a "before optimization" vs. "after optimization" page, based on the fixes described above.
Every one of those improvements maps to a specific fix in this article — the image weight drop comes from compression and format switching, the bundle drop from code splitting and tree shaking, and the CLS drop almost entirely from setting explicit image dimensions and font-display settings.
Performance Budgets
A performance budget is a hard ceiling you set before you start building, so degradation gets caught in code review instead of six months later in a Search Console alert.
- JavaScript (initial load): under 100 KB compressed
- CSS (initial load): under 50 KB compressed
- Images per page: under 500 KB total, ideally less
- Total page weight: under 1 MB
Enforce this with CI tooling — Lighthouse CI can fail a pull request automatically if a bundle grows past a threshold, which is far more reliable than trusting engineers to remember to check.
Mobile Performance Deserves Its Own Testing Pass
Desktop performance testing on a fast office connection tells you almost nothing about the experience of the majority of your traffic. Test explicitly for constrained conditions:
- Simulate a throttled connection: Chrome DevTools → Network tab → Throttling → select a slow profile
- Simulate a lower-power device: DevTools → Performance tab → CPU throttling (4x or 6x slowdown approximates a mid-range Android phone against a high-end test machine)
- Test on an actual older device when possible — emulation is a good proxy but not a perfect one, especially for INP, which is sensitive to real CPU contention
Monitoring Performance Over Time
A one-time Lighthouse audit tells you where you stand today; it says nothing about whether next month's feature release quietly regressed LCP. Real User Monitoring (RUM) — collecting Core Web Vitals from actual visitor sessions, not lab simulations — closes that gap. Google's web-vitals npm package is the standard way to capture these metrics client-side and forward them to analytics:
import { onCLS, onINP, onLCP } from 'web-vitals';

onCLS(console.log);
onINP(console.log);
onLCP(console.log);
(Note: the older getCLS/getFID/getLCP function names from earlier versions of the library have been renamed to onCLS/onINP/onLCP and FID has been dropped entirely, matching Google's own metric change.) Route this data into Google Analytics, Sentry, or a dedicated RUM tool so a regression shows up as a dashboard alert instead of a slow, quiet drop in organic traffic weeks later.
Common Mistakes That Undo Everything Else
Even teams that do the fixes above sometimes sabotage themselves in adjacent ways worth flagging:
- Optimizing images but leaving third-party scripts unchecked. Ad tags, chat widgets, and analytics scripts from vendors are frequently the largest single contributor to a slow INP, because you don't control their code quality — audit them with the Lighthouse "Reduce the impact of third-party code" report.
- Compressing images but skipping the
width/heightattributes. Compression fixes load time; it does nothing for CLS if the browser still doesn't know the image's aspect ratio ahead of time. - Chasing a lab score instead of field data. A 100/100 Lighthouse score on your laptop's fiber connection can coexist with a "poor" INP rating in Search Console if your real users are on mid-range Android phones over 4G.
- Treating performance as a one-time project. Every dependency update, every new marketing pixel, and every new feature is a potential regression. Budgets and CI checks are what keep gains from eroding.
Tools Worth Knowing
| Tool | Cost | Best For |
|---|---|---|
| Google Lighthouse | Free (built into Chrome) | Quick lab audits during development |
| PageSpeed Insights | Free | Combines lab data with real CrUX field data |
| WebPageTest | Free | Detailed request waterfall, multi-location testing |
| GTmetrix | Free / paid tiers | Historical tracking, video-based waterfalls |
| Chrome UX Report (CrUX) / Search Console | Free | Real-world, Google's actual ranking-relevant data |
FAQ
Q: What replaced First Input Delay (FID) as a Core Web Vital? A: Interaction to Next Paint (INP) replaced FID as an official Core Web Vital on March 12, 2024. INP measures the full response time of every interaction during a visit, not just the delay before the first one, making it a stricter and more representative metric (Google Search Central).
Q: What is a good Largest Contentful Paint (LCP) score? A: Under 2.5 seconds at the 75th percentile of real visits, according to Google's official Core Web Vitals thresholds (web.dev).
Q: Does page speed actually affect Google search rankings? A: Yes. Core Web Vitals are part of Google's page experience signals used in ranking, and have been since 2021. Speed alone won't overcome weak content, but among pages of similar relevance and quality, faster pages have a ranking edge.
Q: What's the single biggest performance win for most websites? A: Image optimization. Since images make up roughly a third of the median page's total weight, compressing them and switching to modern formats like WebP or AVIF typically produces the largest measurable improvement for the least engineering effort (HTTP Archive Web Almanac).
Q: Should I lazy-load every image on the page? A: No. Lazy-load images below the fold, but never lazy-load your LCP element (usually the hero image) — doing so delays the exact element Google is timing, which will make your LCP score worse.
Q: How much does image compression actually save? A: Photos straight from a modern camera or phone frequently compress from several megabytes down to a few hundred kilobytes with no visible quality loss, because much of the original file size is redundant data the human eye doesn't register.
Q: What's the difference between a Lighthouse score and Core Web Vitals in Search Console? A: Lighthouse runs a simulated, lab-based test on a fixed connection and device profile. Search Console's Core Web Vitals report reflects real visitor data collected in the Chrome User Experience Report (CrUX). A page can score well in Lighthouse and still fail in the field if real users are on slower networks or devices.
Q: Do I need a CDN if I'm already using Vercel or Netlify? A: Both platforms include CDN distribution by default for static assets — you typically don't need to add a separate CDN on top. If you're self-hosting on a single server region, adding Cloudflare or a similar CDN in front of it is one of the highest-leverage changes you can make.
Q: How often should I re-audit performance?
A: Continuously, not periodically. Set up Real User Monitoring with the web-vitals library and, ideally, a CI check (like Lighthouse CI) that fails a build if bundle size or key metrics regress past your performance budget. Waiting for a quarterly manual audit means regressions ship and sit live for months.
Q: Is a 90+ Lighthouse score enough to call a site "fast"? A: It's a reasonable lab-score target, but confirm it against real CrUX field data in Search Console before declaring victory — the two can diverge, especially for INP, which is sensitive to real-world device and network conditions that lab tests don't fully replicate.
The takeaway
Performance optimization isn't a single technique, it's a stack of compounding fixes: compress and correctly size images, split and tree-shake your JavaScript, cache aggressively at both the browser and CDN layer, and load fonts without blocking render. Do all four and a page that scores 45 on Lighthouse with a 4-second LCP can realistically land in the 90s with sub-2-second LCP, sub-200ms INP, and near-zero layout shift. The Google/Deloitte research on 30 million sessions makes the business case concrete: a tenth of a second matters, so a full second — or five — is not a rounding error, it's measurable revenue.
Read next:
Follow new articles
Add SciHub101 to your feed reader to see new science and technology stories.
About the Author
SciHub101 is an independent science and technology publication founded and edited by Buğra Sözeri, a software engineer and app developer based in Türkiye. AI tools assist with drafting and research. Source documentation in the existing archive is uneven, and articles are being reviewed and corrected. The Editorial Team byline identifies editorial responsibility; it does not certify specialist or independent human review. Where we compare products, anything built by our own team is labelled as such — see the editorial guidelines and About page for how corrections and disclosures work.
Related Articles

Responsive Design & Mobile-First Development Guide 2026
Responsive web design guide 2026: mobile-first CSS, Flexbox, Grid, media queries, touch-friendly UI. Real code examples and checklist for every project.

Deploy Website for Beginners — Go Live in 5 Minutes
Deploy your website for free in 5 minutes: Vercel, Netlify, or GitHub Pages. Custom domain, SSL, environment variables, and rollback guide for beginners.



What Is HTMX? Hypermedia for Modern Web
HTMX explained: how this 14KB library lets you build dynamic web apps with HTML attributes instead of a JavaScript framework, plus how it actually works.

Docker Explained — Containers for Beginners
Learn Docker from scratch: containers vs VMs, Dockerfiles, docker-compose, and how to ship a Node.js app reliably across any environment.