Countries with the Most Marathon Runners (2025 Ranked)
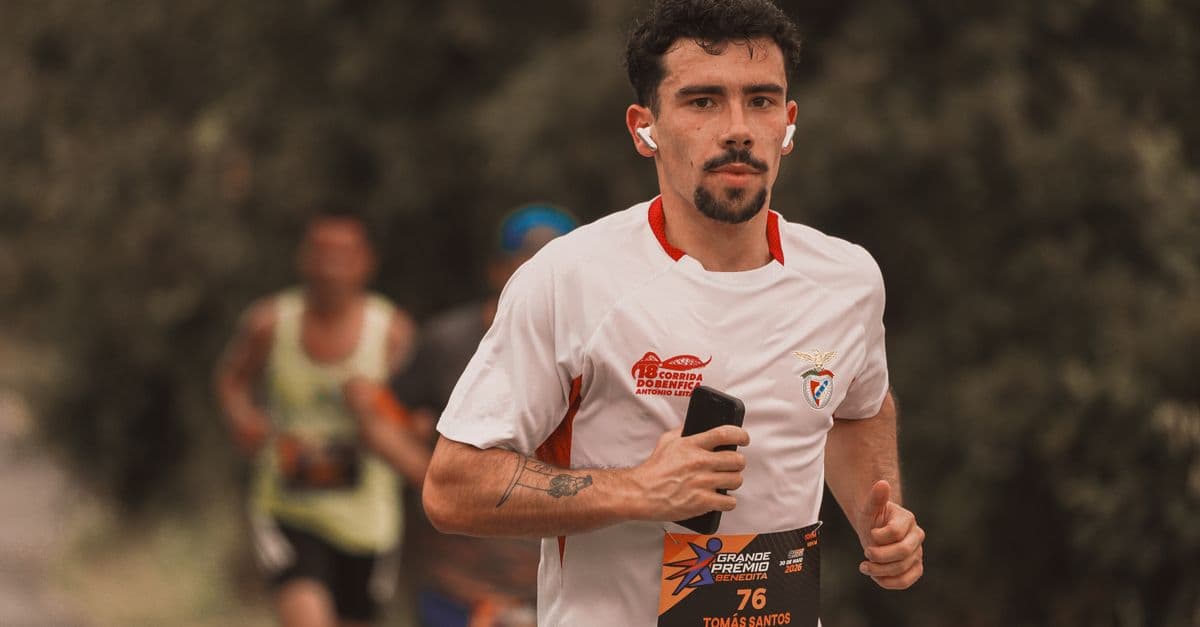
Photo: RUN 4 FFWPU / Pexels
The marathon — exactly 42.195 km (26.219 miles) — is contested by roughly 1.1 million finishers annually across more than 900 events worldwide. No other athletic distance has the same cultural footprint: a sub-4-hour marathon finish is a personal benchmark recognizable to recreational runners on six continents, while the sub-2-hour barrier remains one of sport's most compelling frontiers. The countries that dominate this event differ completely depending on whether you measure participation volume, per-capita running culture, or elite race results. This ranking covers all three dimensions.
What "marathon runners" actually counts
Marathon participation statistics are harder to standardize than they look. AIMS (the Association of International Marathons and Distance Races), the global governing body for non-Olympic road running, maintains records for member events — but not all marathons are AIMS members, particularly smaller local races. Running USA tracks the US market comprehensively. European data comes from national athletics federations and race organizers.
The figures below reflect marathon finishers — people who complete the full 42.195 km distance and receive an official time. This excludes half-marathon finishers (a significantly larger population), relay teams (counted as team entries, not individual finishers), and DNFs (did not finish). Estimated annual finisher figures are derived from race organizer data aggregated by Running USA, AIMS, and independent research firms including RunRepeat.
Source: Running USA Annual Marathon Report and AIMS global race database, aggregated finisher counts for 2023–2024 race seasons. Road Race Management (2025) confirmed a 14.6% year-over-year increase in marathon finishers in a 135-race global survey covering 1,144,630 finishers.
Methodology
Country-level finisher estimates are aggregated from: AIMS member race data, national athletics federation reports, and race-organizer published results. Where exact national totals are not published (as is common in China, Brazil, and emerging markets), estimates are derived from known major race finisher counts plus academic and commercial running market research. Elite race dominance data draws from World Athletics (formerly IAAF) results databases for the six World Marathon Majors.
Countries with the most marathon participation (2024)
| Rank | Country | Annual finishers (est.) | Notable races |
|---|---|---|---|
| 1 | United States | 600,000+ | NYC, Boston, Chicago |
| 2 | Japan | 320,000+ | Tokyo, Osaka, Fukuoka |
| 3 | Germany | 120,000+ | Berlin, Hamburg |
| 4 | France | 90,000+ | Paris, Lyon |
| 5 | United Kingdom | 85,000+ | London, Manchester |
| 6 | South Korea | 70,000+ | Seoul, Gyeongju |
| 7 | Italy | 65,000+ | Rome, Florence |
| 8 | China | 60,000+ | Shanghai, Beijing |
| 9 | Australia | 50,000+ | Gold Coast, Sydney |
| 10 | Brazil | 45,000+ | São Paulo, Rio |
| 11 | Canada | 40,000+ | Toronto, Vancouver |
| 12 | Spain | 38,000+ | Valencia, Madrid |
| 13 | Netherlands | 35,000+ | Amsterdam, Rotterdam |
| 14 | Switzerland | 25,000+ | Zurich |
| 15 | Kenya | ~10,000 participants | Nairobi, Lewa |
Source: Running USA Annual Marathon Report, AIMS member race database, national athletics federation reports, Road Race Management 2024–2025 finisher surveys.
Where this data comes from
Marathon participation estimates come from three primary sources: Running USA's comprehensive annual report covering US events (the most complete national dataset), the AIMS member race database (covering major international events), and race-organizer published finisher counts. For countries lacking complete national coordination (China, Brazil), estimates are derived from major known races plus market research reports from firms like RunRepeat. Elite race dominance data draws from World Athletics official results databases. A critical limitation: not all marathon events are tracked centrally, so global totals represent documented finishers and are likely underestimates. China's explosive growth in 2010–2019 was undercounted until event registration became more systematic.
Historical context: how the marathon got its modern form
The Olympic marathon distance is famously set by one of sport's more colorful bureaucratic accidents. The first modern Olympic marathon, held in Athens in 1896, covered approximately 40 km from Marathon to Athens — commemorating the legendary run of the Greek soldier Pheidippides in 490 BCE. The distances varied in early Olympics: 40 km in 1896, 40.26 km in 1900, 41 km in 1904.
The current 42.195 km was fixed at the 1908 London Olympics for a specific practical reason: the distance from Windsor Castle (where the royal family wanted the race to start) to the Olympic stadium in White City, plus the additional 385 yards (352 m) to place the finish directly in front of the royal box. This convenience arrangement became the official Olympic standard at the 1921 IAAF Congress and has never been changed.
The modern mass-participation marathon was essentially invented by the 1976 New York City Marathon, when race director Fred Lebow opened the event to all runners — not just qualified athletes — and routed it through all five boroughs. That race drew 2,090 finishers. By 1979, New York had 11,533 finishers. The model it demonstrated — road closure, public spectator involvement, chip timing, charity entry — became the template replicated by every major city marathon globally.
Source: New York Road Runners historical records — documents the 1976 NYC Marathon as the founding event of modern mass-participation marathon racing, with full finisher count records from 1970 to present.
The Boston Marathon (founded 1897) holds the distinction of being the world's oldest annual marathon, but for most of its history was an elite-only event with strict qualifying times. It was the NYC model of mass participation that created the global running boom of the late 1970s and 1980s, subsequently exported to London (first mass-participation marathon 1981), Berlin (1974, mass-participation format later), Chicago (1977), and Tokyo (2007).
The 1980s running boom faded but left permanent infrastructure: running clubs, specialty retailers, race timing companies, and a culture of recreational distance running. The second boom, from roughly 2000–2013, was driven by the internet enabling training communities, the charity entry model creating additional motivation, and demographic shifts toward fitness as a lifestyle statement in affluent populations. AIMS data shows global marathon finisher numbers roughly tripled between 2000 and 2015.
Why this matters beyond sport
Marathon participation correlates meaningfully with public health indicators. Regular aerobic exercise at the levels required for marathon training — typically 40–80 km per week over a 16–20 week training program — is associated with significant cardiovascular, metabolic, and mental health benefits. Countries with high marathon participation rates also tend to have lower obesity rates and longer healthy life expectancy, though causation is difficult to establish (healthier populations also self-select into running).
The economic footprint of marathon running is substantial. The Boston Marathon alone contributes an estimated $211 million to the Greater Boston economy annually, according to analysis by the Discover Boylston Street organization — driven by travel, accommodation, race-related spending, and charitable fundraising. The New York City Marathon contributes an estimated $415 million to the NYC economy. Globally, the marathon industry — including entry fees, training gear, travel, and events — is estimated to exceed $5 billion annually.
Source: Boston Athletic Association / Discover Boylston Street (2023) — economic impact analysis of Boston Marathon, $211M annual contribution to Massachusetts economy.
United States: the participation giant
The US marathon scene is defined by mass participation rather than elite dominance:
The US has approximately 600,000 marathon finishers annually across more than 1,100 certified marathon events — representing approximately 54% of estimated global marathon completions. This is not simply a population-size effect: the US's per-capita marathon participation rate substantially exceeds most other large countries. Japan (second in absolute finishers) has a higher per-capita rate in a smaller population; among countries above 300 million people, the US has no participation peer.
US marathon participation grew from roughly 300,000 finishers in 2000 to a peak around 550,000 in 2013, declined slightly through 2019, then dropped sharply during the COVID-19 pandemic in 2020–2021 when most mass events were canceled. The market has recovered and grown: Running USA's 2024 data shows approximately 600,000 annual finishers, exceeding the pre-pandemic peak.
Source: Running USA (2024) — US Running Trends Report, tracking marathon, half-marathon, and road race participation annually since 1990.
The charity entry model is central to US marathon participation. Runners who cannot secure ballot entry to oversubscribed races (Boston, New York, Chicago) can enter by committing to raise a minimum amount — typically $2,500–$5,000 — for a charity partner. The New York City Marathon generates over $40 million in annual charitable fundraising through this model. Boston's Dana-Farber team alone raises over $10 million per year. This mechanism adds a fundraising motivation layer that reinforces participation and partly explains why US marathon fields are extraordinarily large even for runners with modest performance aspirations.
Boston Marathon stands entirely apart from this structure. It is the only major marathon in the world that requires a qualifying time for standard entry — runners must achieve a time standard in a certified marathon within the eligibility window (typically 18 months prior), with standards ranging from 3:00 for men aged 18–34 to 5:25 for men aged 80+. This selectivity maintains Boston's status as the aspirational goal of serious recreational runners. A "BQ" (Boston Qualifier) is widely used shorthand for a meaningful personal achievement.
Kenya and Ethiopia: elite dominance with historical roots
While the US dominates participation, East Africa dominates performance by a margin that has no equivalent in any other mass sport.
At the six World Marathon Majors (Boston, Tokyo, London, Berlin, Chicago, New York) since 2010, Kenyan athletes have won approximately 60% of men's open titles. Ethiopian athletes have won approximately 20%. Combined East African dominance exceeds 80% of open division titles across both sexes.
Understanding why requires engaging with physiology, environment, and culture simultaneously — no single factor explains it.
Altitude physiology. Kenya's Rift Valley and Ethiopia's highlands sit at 1,800–2,500m above sea level. Training at altitude increases the production of erythropoietin (EPO), a hormone that stimulates red blood cell production, increasing the blood's oxygen-carrying capacity. Athletes who train at altitude and compete at sea level have a measurable physiological advantage in events where aerobic capacity is limiting — which includes every distance from 1,500m to the marathon.
Running biomechanics. Studies at Makerere University and elsewhere have documented that Kenyan elite runners tend to have specific biomechanical characteristics — lighter limbs relative to total body mass, longer ankle tendons storing elastic energy, and efficient running mechanics developed through years of barefoot and minimal-footwear childhood running — that reduce the metabolic cost of running at a given speed.
Cultural infrastructure. Training centers in Iten (Kenya) and Bekoji (Ethiopia) operate an informal system where talented young runners are identified, housed in group training camps, coached by former champions, and professionally managed to international race circuits. The economic incentive is substantial: a marathon win at Berlin or London now carries a prize of $50,000–$60,000 plus time bonuses, equivalent to decades of median local income. This creates intense selection pressure — the best runners find their way to the system; others try everything to get in.
Source: World Athletics (IAAF) results database — World Marathon Major results 2010–2024, showing country of citizenship for open division winners at all six Major events.
Eliud Kipchoge's historical position. Kenya's Eliud Kipchoge holds the official marathon world record of 2:00:35, set at the 2023 Berlin Marathon, and the unofficial sub-2-hour time of 1:59:40 at the INEOS 1:59 Challenge in Vienna in October 2019. The Vienna run used pacers arranged in a formation designed to minimize aerobic drag — conditions that violated World Athletics record rules, which prohibit pre-positioned pacing arrangements. The official record remains 2:00:35. Kipchoge's combination of four Berlin Marathon victories, two Olympic gold medals (Rio 2016, Tokyo 2020), and the sub-2-hour demonstration makes him the most accomplished marathon runner in documented history.
Source: World Athletics official marathon world record page — 2:00:35, Eliud Kipchoge, Berlin Marathon, September 24, 2023.
Tigst Assefa's 2:09:56. The women's world record, set by Ethiopia's Tigst Assefa at the 2023 Berlin Marathon, is 2:09:56 — an improvement of more than two minutes over the previous record. Women's marathon times have improved faster than men's over the past two decades: the women's record has improved by approximately 12 minutes since 2000, versus approximately 3 minutes for men. This reflects a combination of more women competing at elite level, improved coaching, and the women's event being younger (the Olympic women's marathon was not added until 1984).
Japan: the depth of running culture
Japan's marathon culture is distinctive in ways that do not translate directly into any other country's running ecosystem.
Japan has approximately 320,000 annual marathon finishers in a country of 125 million — a per-capita participation rate that exceeds the United States when population is controlled for. The Tokyo Marathon (founded 2007) received 336,000 applications for 38,000 places in 2024 — a 12% acceptance rate that makes it the world's most oversubscribed major athletic event by application ratio.
The foundation of Japanese running culture is the ekiden — a long-distance relay race in which teams of five to ten runners each cover a segment of a course totaling a marathon distance or more. The Hakone Ekiden, run between Tokyo and Hakone over two days with ten runners per team covering 217.9 km total, is one of Japan's most-watched sporting events — drawing television audiences of approximately 30 million on each day. University ekiden competition is how Japan identifies and develops marathon talent. Corporate ekiden teams (companies sponsor teams of dedicated professional runners who train full-time and compete in corporate league events) are how elite performance is sustained into runners' professional careers.
Source: Hakone Ekiden official records and Kanto Student Athletics Federation — event records from 1920, with viewership data from Nippon Television audience ratings.
This structure produces an unusually deep pipeline of competitive runners. A company like Toyota, Honda, or NTT might field a corporate ekiden team whose members run 200+ km per week as their full-time job, competing against other corporate teams in events that attract genuine public interest. Japan's approach is essentially semi-professional mass competition — not as commercially visible as the elite circuit, but producing training volumes and competitive standards that sustain Japan's position as the world's second-largest marathon participation country and a consistent presence in Olympic and World Championships distance running.
The Tokyo Marathon's course design is worth noting: the flat, point-to-point (in practice a large loop) route through central Tokyo, with over 2 million spectators, has produced multiple course records and makes it one of the fastest major marathon courses in the world. Venue is not incidental to participation growth — accessible, urban, festive course environments drive participation.
Germany and the Berlin Marathon model
Germany's 120,000+ annual marathon finishers are anchored by two events with different characters. The Berlin Marathon (held annually since 1974, mass-participation format since the late 1970s) is the world's fastest major marathon course — a flat, city-center route that has produced more world records than any other marathon in history. Both the men's world record (Kipchoge, 2023) and the women's world record (Assefa, 2023) were set in Berlin.
Berlin's record-production is not accidental. The course is designed for speed: minimal turns, gentle camber, urban canyon microclimate, and a cool-weather late-September race date that consistently provides near-optimal temperatures (8–14°C). Elite race directors specifically select Berlin for record attempts because the combination of course and conditions is reliably the fastest available.
Source: Berlin Marathon (SCC Events) official race history — documents world records set on the course, including men's records in 1998, 2003, 2007, 2008, 2011, 2013, 2018, and 2023.
The Hamburg Marathon draws approximately 15,000 finishers and serves a different market: the recreational runner for whom participation, not performance, is the goal. Germany's running culture is organized, well-funded through sports club infrastructure (Sportvereine), and embedded in a public health culture that treats physical activity as a civic responsibility rather than a personal luxury.
South Korea: running culture built in one generation
South Korea's 70,000+ annual marathon finishers represent a running culture largely built since the 1990s. The Seoul International Marathon (Dong-A Ilbo Marathon, founded 1931 in Japanese colonial Korea) is one of Asia's oldest, but mass participation exploded after South Korea's rapid economic development created both the leisure time and the affluence to support recreational sport.
South Korea's running participation growth mirrors its economic trajectory. As household incomes rose past $20,000–$30,000 per capita, recreational running — which requires only shoes and time — became accessible to a middle-class that previously lacked leisure time. This pattern is visible in multiple Asian economies: China's marathon participation has grown from essentially zero organized events in 2010 to 60,000+ finishers in 2024 as urban middle-class incomes have risen.
Per-country deep dive: what the data reveals
France and Spain demonstrate the Mediterranean running culture variant: large races with festive atmospheres, participation integrated into lifestyle rather than treated as a performance pursuit. The Paris Marathon (40,000+ finishers) and Valencia Marathon (30,000+ finishers) draw large tourist running contingents — runners who travel specifically to run a city marathon as a tourism experience. Valencia has become one of Europe's fastest-growing marathons by combining a fast, flat course with Spain's reputation for runner hospitality and good weather in December.
Australia punches significantly above its population weight in marathon participation. Gold Coast Marathon, Sydney Marathon, and Melbourne Marathon collectively draw approximately 50,000 finishers from a population of 26 million. Running Australia research shows marathon participants skew heavily toward the 35–55 age bracket — the economic cohort with sufficient income, time, and health motivation to sustain a training habit requiring 8–15 hours per week.
China represents the largest growth story in global marathon running. The China Athletics Association registered essentially zero certified marathons in 2010; by 2019 (pre-pandemic), it certified over 1,500 events with approximately 6 million participants across all road distances. Marathon-specific finishers are harder to isolate, but 60,000+ is a conservative estimate for 2024. The government has actively promoted marathon running as part of public health policy, and corporate sponsorship of city marathons has driven explosive event growth.
Source: China Athletics Association (CAA) — annual road running event registration data, showing growth from approximately 13 certified events in 2010 to 1,581 in 2019, with partial recovery post-pandemic to approximately 800+ certified events in 2023.
The marathon in numbers
| Metric | Value |
|---|---|
| Global marathon finishers annually | ~1.1 million |
| Marathon events worldwide | ~900 |
| Men's world record | 2:00:35 (Kipchoge, Berlin 2023) |
| Women's world record | 2:09:56 (Assefa, Berlin 2023) |
| Oldest annual marathon | Boston (1897) |
| Largest by finishers | New York City (~55,000) |
| Most oversubscribed | Tokyo (336,000 applications for 38,000 places) |
| Average global finishing time | 4:29 (men 4:13, women 4:42) |
Trends in global marathon running
The global marathon community is undergoing several structural shifts that will define participation patterns through the 2030s.
Supershoe technology. The introduction of carbon fiber plate running shoes (Nike Vaporfly 4%, 2017; followed by Adidas Adizero Adios Pro, Asics Metaspeed Sky, and others) has measurably improved marathon times at every level of the performance spectrum. World Athletics analyses estimate carbon-plate shoes improve marathon performance by 2–4%. At the elite level, this has contributed to the wave of world records since 2018. At the recreational level, average finishing times have improved by several minutes across major marathons. The AIMS-member race that previously averaged 4:35 now averages 4:28 for the same demographic profile.
Women's participation growth. Women represented approximately 22% of US marathon finishers in 1990; they now represent approximately 46%. This trend is visible globally. As gender norms around female athletic participation shift in more countries, women's marathon participation is growing faster than men's. The International Olympic Committee's expansion of women's track and field events has contributed to legitimizing distance running for women at the grassroots level.
Masters runners driving participation. The fastest-growing age demographic in marathon running globally is 50–64. As the demographic bulge of post-war baby boomers ages, a cohort with sufficient wealth, time, and health consciousness is increasingly taking up marathon running as a longevity practice. Boston Marathon currently has more finishers over 50 than under 30.
Source: Running USA 2024 state of the sport report — age and gender demographic data for US marathon finishers, 1990–2024 trend series.
Streaming and virtual marathons. The COVID-19 pandemic accelerated the adoption of virtual race formats — events where participants complete the distance on their own route, submit GPS data, and receive official timing. While virtual marathons do not replicate the experience of a mass event, they have expanded access for participants in countries with fewer organized events. Some race organizations have maintained hybrid virtual-physical formats post-pandemic as a participation tool.
Frequently asked questions
Q: How long does it take the average person to run a marathon?
A: The global average marathon finishing time is approximately 4 hours 29 minutes in 2024 — equivalent to an average pace of 6:23 per kilometre. This varies by country: US average is 4:32 (reflecting a broad base including first-time finishers); German runners average 4:05; Japanese runners typically below global average. Training volume, weather conditions, and course profile affect times significantly. The carbon-plate shoe generation has pulled averages down across most markets.
Q: What is the hardest marathon in the world?
A: Among recognized 42.195 km road marathons, the most technically demanding are high-altitude events: the Everest Marathon (starting at Everest Base Camp, 5,364m) poses extreme physiological challenges with finishing times exceeding 6 hours. Among the six World Marathon Majors, New York's five-bridge course and Boston's Heartbreak Hill (km 32–36) are most challenging. Boston's difficulty is amplified by its heat-risk April race date.
Q: Is marathon running healthy for you?
A: Research shows a nuanced picture depending on training volume and health status. Regular aerobic training at marathon-preparation volumes (40–80 km/week) is associated with reduced cardiovascular mortality and lower all-cause mortality. A 2017 meta-analysis found regular runners have 25–40% lower all-cause mortality than non-runners. Marathon race events carry small acute cardiac risk: approximately 0.5–1.0 sudden cardiac arrests per 100,000 finishers.
Q: What is the Boston qualifying time?
A: Boston Athletic Association standards vary by age and gender. For the 2025 Boston Marathon, the standard for men aged 18–34 was 3:00:00; for men 35–39, 3:05:00; for women 18–34, 3:30:00. The cut-off for entry is typically faster than the posted standard due to oversubscription — runners needed to beat their standard by 2–6 minutes in recent years.
Q: Why do Kenyans and Ethiopians dominate marathon running?
A: No single factor explains East African dominance. The combination of altitude training (improving aerobic capacity), biomechanical efficiency (particularly elastic energy storage in longer Achilles tendons), a cultural infrastructure of group training, strong economic incentive relative to local wages, and self-selection into intensive semi-professional training at a young age creates a system producing marathon champions at unmatched rates. Genetic factors likely play a role but remain undifferentiated from environmental factors.
Q: What is the difference between a road marathon and a trail marathon?
A: A road marathon is run on paved surfaces over standard 42.195 km. A trail marathon is run on unpaved trails and may vary in distance — World Athletics does not ratify trail records. Trail marathons are typically much slower (5–8 hours for competitive times) due to elevation gain, technical terrain, and altitude. Trail running has grown as a distinct discipline with its own culture and governing body (ITRA).
Sources
- Running USA Annual Marathon Report 2024
- AIMS World Running — Global Race Statistics
- World Athletics Marathon Records and Results
- Boston Athletic Association Historical Data
- Road Race Management: Global Finisher Statistics 2025
Related reading:
Follow new articles
Add SciHub101 to your feed reader to see new science and technology stories.
About the Author
SciHub101 is an independent science and technology publication founded and edited by Buğra Sözeri, a software engineer and app developer based in Türkiye. AI tools assist with drafting and research. Source documentation in the existing archive is uneven, and articles are being reviewed and corrected. The Editorial Team byline identifies editorial responsibility; it does not certify specialist or independent human review. Where we compare products, anything built by our own team is labelled as such — see the editorial guidelines and About page for how corrections and disclosures work.
Related Articles

Countries with the Most Tattoos (2025 Ranked)
Italy has the highest tattoo prevalence of any country — 48% of Italians have at least one tattoo. The United States has the world's largest tattoo industry at $1.8 billion annually. New Zealand's Māori ta moko tradition is one of the world's oldest continuous tattooing cultures.

Countries with the Most Chess Players (2025 Ranked)
Russia has produced more World Chess Champions than any country — 16 of 17 champions from 1927 to 2007 were Soviet or Russian. India is now the world's fastest-growing chess nation with 80+ active grandmasters. Magnus Carlsen of Norway held the world title for 10 years. Here are the countries dominating chess.
Countries with the Most Olympic and World Sport Medals (2025 Ranked)
The United States leads all-time Olympic medal tables with 2,631 total medals. China dominates weightlifting and diving. Kenya owns distance running. Jamaica dominates sprints. Here's the full breakdown of which countries dominate which sports — and what drives sporting excellence.

Countries With the Most Olympic Gold Medals Per Capita (All Time)
When you adjust for population size, Finland, Norway, and Sweden dwarf the USA and China in Olympic gold medal performance. See the full ranking of countries by all-time Olympic gold medals per million people and discover the small-nation sports powerhouses you never knew existed.
Countries with the Most Olympic Gold Medals All Time (Total Ranked)
The United States has won more than 1,100 Olympic gold medals since 1896 — more than any other nation. The Soviet Union, which no longer exists, ranks second. Here's the all-time medal table, the stories behind the dominant nations, and how the balance of Olympic power has shifted over 130 years.

Top 10 Greatest Basketball Players of All Time (2026 Ranked)
Michael Jordan went 6-0 in NBA Finals. LeBron James is the all-time leading scorer. Kareem Abdul-Jabbar held the scoring record for 39 years. The 10 greatest basketball players ranked by championships, statistics, and impact.