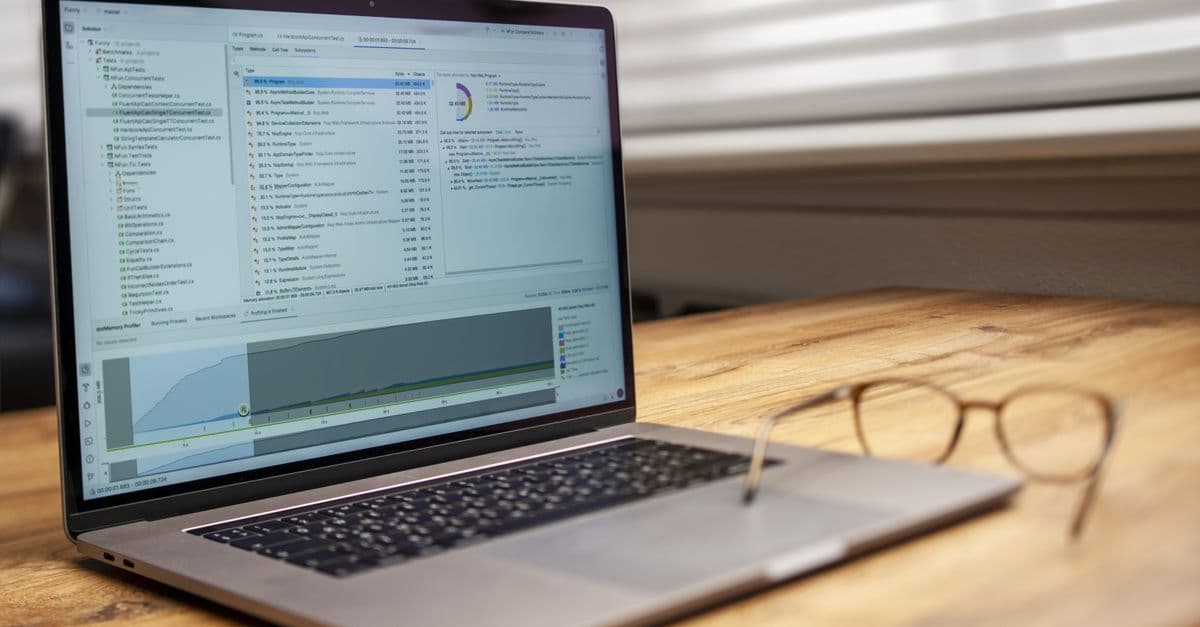
Data Visualization Tools — Tableau vs Power BI vs Plotly
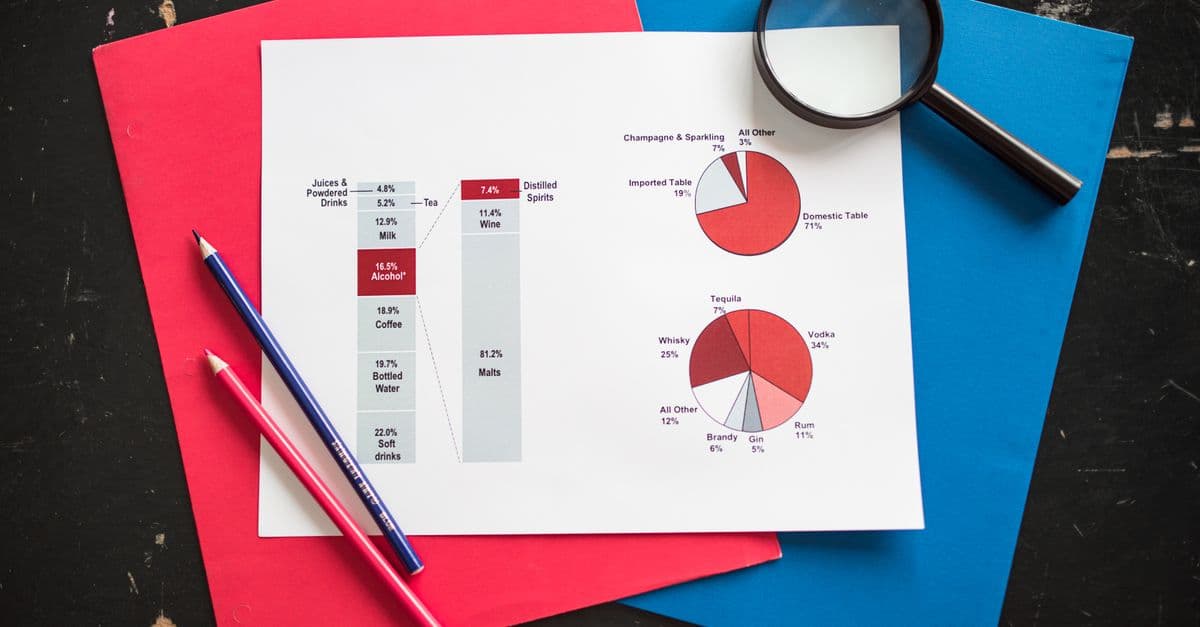
Photo: RDNE Stock project / Pexels
A model that predicts churn is useless if the people who must act on it cannot see what it found. A chart that makes a pattern obvious can be worth more than a thousand rows of data, and a bad chart can send a company in the wrong direction with great confidence. The tools differ mainly in who they are built for: analysts exploring data in code, or business users who want to click through a dashboard. This article compares the main data visualization tools, shows short working examples, and explains how to choose.
Which kind of tool fits your job?
Visualization software falls into three families, and most of the confusion about "which is best" comes from comparing tools across families.
| Family | Examples | You work by | Best when |
|---|---|---|---|
| Code libraries | Matplotlib, seaborn, Plotly | Writing Python (or R, JavaScript) | You are exploring data, need reproducibility, or need a custom chart |
| Declarative grammars | Vega-Lite and its Python wrapper Altair | Describing what maps to what, and letting the library draw it | You want concise, consistent charts without managing every pixel |
| Business intelligence (BI) platforms | Tableau, Power BI, Looker Studio | Dragging fields onto a canvas | Many non-technical people need to filter and explore shared dashboards |
An analogy: code libraries are a woodworking shop where you can build anything if you know the tools, while BI platforms are a furniture showroom where the pieces are ready to arrange and customers can rearrange them. Most data teams use both, with code for analysis and BI for sharing results.
How does Matplotlib work, and why does everything build on it?
Matplotlib is the foundation of Python plotting. Its documentation explains that its creator, John D. Hunter (1968 to 2012), used MATLAB for data analysis and visualization, started building an application for EEG (brain-wave) data, found MATLAB limiting as a general programming language, and moved to Python. Python had no 2D plotting package that met his needs, so he wrote one. His requirements included publication-quality plots with good antialiased text, PostScript output for TeX documents, embedding in graphical user interfaces, and code that is easy to extend. He copied MATLAB's plotting commands because many users already knew them, which is why the pyplot interface looks the way it does.
The library has three layers: a MATLAB-like pyplot interface for quick plots, an object-oriented front end with classes for figures, axes, lines, and text, and backends that render to formats such as PNG, PDF, and SVG. Knowing this explains a common beginner stumble. The quick plt.plot() style and the explicit fig, ax style are two doors into the same room, and the second scales better to multi-panel figures.
import matplotlib.pyplot as plt

fig, axes = plt.subplots(2, 2, figsize=(12, 8))

# Scatter plot
axes[0, 0].scatter(df['age'], df['salary'], alpha=0.5, c='steelblue')
axes[0, 0].set_xlabel('Age')
axes[0, 0].set_ylabel('Salary')
axes[0, 0].set_title('Age vs Salary')

# Histogram
axes[0, 1].hist(df['salary'], bins=30, color='orange', edgecolor='black')
axes[0, 1].set_title('Salary Distribution')

# Line chart
axes[1, 0].plot(monthly_data['month'], monthly_data['revenue'],
                marker='o', color='green')
axes[1, 0].set_title('Monthly Revenue')

# Horizontal bar chart
dept_avg.plot(kind='barh', ax=axes[1, 1])
axes[1, 1].set_title('Average Salary by Department')

plt.tight_layout()
plt.savefig('analysis.png', dpi=150, bbox_inches='tight')
Where Matplotlib fits: figures for papers and reports, custom layouts, and any situation that needs control over individual elements. It is also the engine under seaborn and under pandas' built-in .plot() method. Its main limitations are that output is static by default and that a polished chart takes more lines of code than in higher-level libraries. For the data structures that feed these plots, see the NumPy guide and the Python data libraries cheat sheet.
What does seaborn add on top?
Seaborn describes itself as a library "for drawing attractive and informative statistical graphics," built on top of matplotlib. It provides relational, distribution, categorical, and regression plots, multi-plot grids, figure theming, and color palettes, plus a newer objects interface. The practical effect is that statistical charts which take 20 lines in Matplotlib take two or three in seaborn, with sensible defaults.
import seaborn as sns
import matplotlib.pyplot as plt

sns.set_theme(style="whitegrid", palette="colorblind")

fig, axes = plt.subplots(1, 3, figsize=(15, 4))

sns.histplot(df['salary'], kde=True, ax=axes[0])
axes[0].set_title('Salary Distribution')

sns.boxplot(data=df, x='department', y='salary', ax=axes[1])
axes[1].tick_params(axis='x', rotation=45)
axes[1].set_title('Salary by Department')

corr_matrix = df[numeric_cols].corr()
sns.heatmap(corr_matrix, annot=True, fmt='.2f', cmap='coolwarm', ax=axes[2])
axes[2].set_title('Feature Correlations')

plt.tight_layout()
Several seaborn functions are worth knowing by name.
sns.pairplot()draws a scatterplot matrix for the numeric columns, a fast way to spot relationships and odd points.sns.violinplot()combines a distribution estimate with box-plot style summaries.sns.heatmap()shows matrices such as correlations as a color grid.sns.lmplot()fits and draws a regression line over a scatter plot.
Seaborn's strength is exploratory data analysis (EDA), the first pass where you look at distributions, outliers, and relationships. Outliers in particular deserve a look before any summary statistic is trusted, a point developed in why outliers can change averages. Seaborn is for analysts who already work in pandas. If you are choosing a data frame library as well, the comparison of Polars and pandas is relevant.
When should you reach for Plotly and Dash?
Plotly's Python library describes itself as making "interactive, publication-quality graphs," and it is free and open source. Charts have hover tooltips, zoom, and filtering built in, and they work in Jupyter notebooks and in web pages. Plotly Express is the short, high-level interface.
import plotly.express as px

fig = px.scatter(
    df,
    x='years_experience',
    y='salary',
    color='department',
    size='team_size',
    hover_data=['name', 'city'],
    title='Salary vs Experience by Department'
)
fig.update_layout(template='plotly_white')
fig.show()

# Save as a standalone interactive HTML file
fig.write_html('salary_analysis.html')
Dash, Plotly's framework for analytical web apps, lets you wire charts to dropdowns and sliders without writing JavaScript. One detail trips people up when they copy older tutorials. In the Dash changelog, version 2.18.1 (September 12, 2024) deprecated Dash.run_server in favor of Dash.run, and version 3.0.0 (March 17, 2025) removed run_server entirely. Use app.run.
from dash import Dash, dcc, html, Input, Output
import plotly.express as px

app = Dash(__name__)

app.layout = html.Div([
    dcc.Dropdown(options=departments, id='dept-filter'),
    dcc.Graph(id='salary-chart')
])

@app.callback(Output('salary-chart', 'figure'), Input('dept-filter', 'value'))
def update_chart(department):
    filtered = df[df['department'] == department] if department else df
    return px.box(filtered, x='seniority', y='salary',
                  title='Salary Distribution')

if __name__ == '__main__':
    app.run(debug=True)
For a lighter way to turn a script into a shareable web app, the Streamlit tutorial covers an alternative. Both approaches suit internal tools and prototypes. They require someone who can write and maintain Python, which is the main trade-off against BI platforms.
What is the grammar of graphics, and where do Vega-Lite and Altair fit?
The "grammar of graphics" idea is to describe a chart as a mapping from data fields to visual properties, instead of issuing drawing commands. Vega-Lite, which its documentation calls a "high-level grammar of interactive graphics," uses a concise, declarative JSON syntax. You specify that the x position is a date, the y position is a sum, and the color is a region, and the compiler generates axes, legends, and scales with built-in design rules. The project is led by alumni and members of the University of Washington Interactive Data Lab, including Jeffrey Heer. Vega-Lite compiles to the lower-level Vega, so users can drop down when they need more control, and the documentation lists the Python library Altair among related projects.
The grammar approach is a good fit when you want consistent, readable charts with little code, and it appears in tools beyond Python. Its trade-off is that unusual, highly customized charts can be harder to express than in Matplotlib.
What do Tableau, Power BI, and Looker Studio do differently?
Business intelligence platforms replace code with a visual canvas, a data model, and a publishing system. They are designed for people who need to look at the same dashboard, filter it themselves, and trust that it updates.
Tableau
Tableau is a long-established BI platform for connecting to many data sources, building interactive dashboards with filters and drill-downs, and publishing them for an organization. Salesforce completed its acquisition of Tableau Software on August 1, 2019, and said at the time that Tableau would continue to operate under its own brand. Pricing is per user and depends on the license type and deployment, and Tableau changes its price list, so check the vendor's current pricing page rather than relying on a number quoted in an article. The typical workflow runs from connecting to a data source, dragging dimensions (categories) and measures (numbers) onto rows and columns, choosing a chart type, adding filters and tooltips, combining sheets into a dashboard, and publishing it.
Tableau tends to be chosen when teams want flexible layout, many connectors, and a mature community. The costs are licensing and the time to learn its calculation language for advanced work.
Power BI
Microsoft's Power BI has a free authoring tool, Power BI Desktop, and charges for sharing. According to Microsoft's pricing page, a free account lets you build reports in Desktop but requires an upgrade to Pro or Premium to share them. Power BI Pro is $14.00 per user per month billed yearly, and Premium Per User is $24.00 per user per month billed yearly with larger model sizes and more frequent refreshes. Larger deployments can use Fabric capacities with variable pricing. Prices change, so confirm on Microsoft's page.
Power BI's calculation language is DAX (Data Analysis Expressions). Microsoft's learning documentation describes it as "a collection of functions, operators, and constants that can be used in a formula, or expression, to calculate and return one or more values." Its example measure shows both the appeal and the learning curve.
Previous Quarter Sales =
    CALCULATE(
        SUM(Sales[SalesAmount]),
        PREVIOUSQUARTER(Calendar[DateKey])
    )
Here SUM totals a column, and CALCULATE evaluates that total in a context modified by a filter, in this case the previous quarter. DAX has two kinds of context, row context (the current row) and filter context (the filters applied by the report or formula), and understanding the difference is the core of learning it. People who know Excel formulas have a head start, though Microsoft stresses that DAX functions reference whole columns or tables rather than cell ranges.
Power BI is the natural choice where an organization already runs on Microsoft 365 and Azure, and its low entry price for authoring makes it easy to prototype.
Looker Studio (now called Data Studio in Google's documentation)
Google's free dashboarding tool was originally Google Data Studio, was later renamed Looker Studio, and Google's current documentation says it is "now called Data Studio." Google describes it as a no-cost tool for building dashboards and reports. It connects natively to Google products such as Google Analytics, Google Ads, BigQuery, and Google Sheets, which is why marketing teams use it for reporting.
| Strengths | Limits to plan for |
|---|---|
| No license cost for the core product | Less flexible for heavy data transformation than Tableau or Power BI |
| Easy sharing like a Google Doc | Fewer advanced chart types |
| Native Google data connectors | Works best when most of your data already lives in Google products |
Because the product name has changed twice, search results and tutorials may use any of the three names.
How do the tools compare side by side?
The prices below are those verified from vendor pages at the time of writing; the others are described qualitatively because list prices change often.
| Tool | Cost | Interactivity | Skill needed | Best for |
|---|---|---|---|---|
| Matplotlib | Free, open source | Static by default | Python | Custom and publication figures |
| seaborn | Free, open source | Static | Python and pandas | Statistical EDA |
| Plotly and Dash | Free, open source | Interactive | Python | Interactive exploration and internal apps |
| Altair and Vega-Lite | Free, open source | Interactive | Python or JSON | Concise declarative charts |
| Tableau | Per-user subscription; see vendor page | Interactive | Drag-and-drop, then calculations | Enterprise dashboards |
| Power BI | Desktop free; Pro $14 per user per month, billed yearly | Interactive | Drag-and-drop, then DAX | Microsoft-centered organizations |
| Looker Studio (Data Studio) | Free core product | Interactive | Drag-and-drop | Google data and quick reports |
Which tool should you choose?
The right choice depends mostly on who will read the output and who will maintain it.
| Your situation | Reasonable starting point |
|---|---|
| Data scientist doing exploratory analysis | Matplotlib and seaborn |
| Sharing an analysis inside a Jupyter notebook | Plotly |
| Building a small internal web app | Dash or Streamlit |
| Analyst whose company runs on Microsoft 365 | Power BI |
| Analyst at a company that already licenses Tableau | Tableau |
| Marketing team with Google Analytics and Ads data | Looker Studio (Data Studio) |
| Student or beginner | Matplotlib first, then seaborn |
| Small team on a tight budget | Free Python libraries, plus Power BI Desktop if you do not need sharing |
Two practical points. First, the best tool is often the one your organization already pays for and that your colleagues can maintain, because dashboards need an owner. Second, skills transfer. The ideas of dimensions and measures, filters, aggregations, and chart types carry over between tools, and the SQL that feeds them is the same everywhere, as covered in SQL for data science. A broader catalog of what else belongs in the stack is in the best data science tools guide, and the choice of language is discussed in Python vs R for data science.
Does the tool matter more than the chart design?
Not by much. A beautiful dashboard on top of a misleading chart is still misleading. Three classic ideas explain why.
Why should you always plot the data?
In 1973 the statistician Francis Anscombe published four small data sets that share almost identical summary statistics but look completely different when graphed. Each has a mean of x of 9 and a sample variance of x of 11, a mean of y of 7.50 and a sample variance of y of about 4.125, a correlation of 0.816, and the same regression line, y = 3.00 + 0.500x. One set is a clean linear trend, one is a smooth curve, one is a line with a single outlier, and one is a vertical stack of points with one influential point. Anscombe wanted to counter the view that numerical calculations are exact but graphs are rough. The lesson for tool users is to draw the data before trusting the summary. A confidence interval is another summary that can hide structure, and what a confidence interval really means covers how to read one.
What is chartjunk?
Edward Tufte, a statistician and professor emeritus at Yale, self-published The Visual Display of Quantitative Information in 1982. He coined the term "chartjunk" for useless, non-informative, or information-obscuring elements in quantitative displays, and used the idea of the data-ink ratio to argue against excessive decoration. The practical advice is to remove gridlines, borders, 3D effects, and shading that do not carry information. BI tools make decoration one click away, which is why this lesson matters more, not less, in dashboards.
How accurately do people read different chart types?
In 1984 William Cleveland and Robert McGill published a study that ranked how accurately people judge elementary graphical tasks, including position along a common scale. Designers commonly draw the practical conclusion that bars aligned to a shared baseline are easier to compare than angles or areas, which is the usual argument for being careful with pie charts. Treat that as a guideline rather than a law, because context and labeling also matter.
The table maps common questions to chart types.
| Question | Typical chart | Watch out for |
|---|---|---|
| Compare categories | Bar chart, starting at zero | Truncated axes that exaggerate differences |
| Change over time | Line chart | Mixing different time scales; for forecasting, see how time series forecasting works |
| Distribution | Histogram, box plot, violin plot | Bin sizes that hide or invent structure |
| Relationship between two variables | Scatter plot | Reading correlation as causation |
| Part of a whole | Stacked bar or a pie with few slices | Too many categories |
| Many variables at once | Heatmap, small multiples | Color scales that mislead |
For a catalog of the ways charts distort, see how data visualization can mislead.
How should you choose colors?
Use color to encode meaning, not to decorate. Some readers have color vision deficiency, so avoid encoding categories by red versus green alone. Seaborn includes a "colorblind" palette, and a good habit is to add direct labels, shapes, or line styles so that the chart does not depend on color alone. For how screens represent color in the first place, see the explainer on digital color spaces.
import seaborn as sns
sns.set_palette("colorblind")   # or "tab10" for many categories

# Matplotlib: assign colors by meaning, then reuse them everywhere
colors = {'revenue': '#2196F3', 'cost': '#F44336', 'profit': '#4CAF50'}
Label axes with units and time periods, and annotate the events that explain a change.
plt.xlabel('Months Since Signup', fontsize=12)
plt.ylabel('Monthly Active Users', fontsize=12)
plt.title('User Retention by Cohort', fontsize=14, fontweight='bold')
A worked example: the same question in three tools
Suppose the question is "How did monthly revenue by region change this year?" Each tool answers it in its own idiom.
Seaborn. One call draws one line per region from a tidy table with columns month, region, and revenue.
sns.lineplot(data=sales, x='month', y='revenue', hue='region', marker='o')
Plotly. The same call with a different function name gives hover values and zoom, and the figure can be exported to a standalone HTML page.
px.line(sales, x='month', y='revenue', color='region', markers=True)
Power BI. You import the table, create a measure such as Total Revenue = SUM(Sales[Revenue]), drag month to the axis, Total Revenue to values, and region to the legend, then add a region slicer so viewers can filter.
Notice what stays constant: the data must be tidy, the question must be specific, and the axes must be honest. The tool changes only the syntax. If the table has duplicate rows or missing months, every one of these charts will be wrong in the same way, which is why data preparation is covered separately in what data cleaning actually involves and not in this article.
What mistakes do people make with visualization tools?
- Starting with the tool instead of the question. Decide what decision the chart supports before choosing a chart type.
- Overloading a dashboard. Fifteen charts on a page usually means the author has not decided which three matter.
- Dual axes without explanation. Two y-axes with different scales let you make any two lines appear correlated.
- Default colors and defaults in general. Defaults are tuned to look acceptable on average data, not to communicate your specific point.
- Skipping the owner. A dashboard with no maintainer decays as data sources change. Assign someone to keep it correct.
- Sharing a notebook screenshot as a deliverable. If stakeholders will return to it weekly, move it to a tool built for sharing, such as a BI platform or a Dash or Streamlit app.
AI assistants can now generate chart code or even whole dashboards from a prompt, which can speed up drafting. They do not remove the need to check axes, scales, and filters, so evaluate any generated chart the same way you would a colleague's. For a survey of this category, see the list of AI data analysis tools.
What is a sensible learning path?
This is a suggested order of study, not a fixed timeline.
| Stage | Focus |
|---|---|
| First | Matplotlib basics: scatter, line, bar, histogram, saving figures |
| Second | seaborn for statistical charts and palettes |
| Third | Plotly for interactivity, then Dash or Streamlit for small apps |
| Fourth | One BI tool, chosen by what your target employer or team uses |
Analysts aiming at business reporting may reverse the order and start with Power BI or Tableau, then add Python when they need custom analysis. In either case, spend as much time on chart choice, labeling, and color as on tool mechanics.
Frequently asked questions
Q: Should I learn Tableau or Power BI first? A: Start with whichever your current or target employer uses, because the concepts transfer between them. Power BI Desktop is free to download for authoring, which makes it easy to practice, while sharing reports requires a paid license.
Q: Are free tools enough for professional work? A: For analysis and one-off visuals, yes. Matplotlib, seaborn, Plotly, and Altair are widely used, open source, and produce publication-quality output. BI platforms earn their cost when many non-technical people need to explore, filter, and refresh shared dashboards without involving an analyst.
Q: Can Plotly Dash or Streamlit replace Tableau or Power BI? A: For internal tools built by people who write Python, often yes. For self-service analytics across a large organization, where permissions, scheduled refresh, and non-programmers matter, BI platforms are usually the more practical choice.
Q: Why does my older Dash code fail with "run_server"?
A: Dash 3.0.0, released March 17, 2025, removed Dash.run_server in favor of Dash.run. Replace app.run_server(debug=True) with app.run(debug=True), or pin an older Dash version if you must keep legacy code.
Q: What is the difference between Looker Studio and Data Studio? A: They are the same family of product under different names. Google Data Studio was renamed Looker Studio, and Google's current documentation says it is now called Data Studio. Older tutorials may use any of the names.
Q: Which chart should I use to show a distribution? A: A histogram, box plot, or violin plot, depending on how much detail you need. Plot the raw data or a density estimate first, since Anscombe's quartet shows that summary statistics alone can hide important structure.
The takeaway
The most useful way to think about visualization tools is as a decision about audience and maintenance, not about features. Code libraries give analysts speed, control, and reproducibility. BI platforms give organizations sharing, permissions, and refresh. In both cases, the quality of the result depends on whether the chart answers a specific question honestly. Anscombe showed in 1973 that identical statistics can describe very different data, and Tufte argued in 1982 that decoration is a cost, not a benefit. Pick the tool your team can maintain, plot the data before you summarize it, and judge every chart by what a first-time viewer would conclude in five seconds.
Sources
- Matplotlib documentation, History
- seaborn documentation
- Plotly Python documentation and Dash changelog
- Vega-Lite documentation
- Microsoft, Power BI pricing
- Microsoft Learn, Learn DAX basics in Power BI Desktop
- Google, Data Studio (formerly Looker Studio) documentation
- Salesforce, "Salesforce Completes Acquisition of Tableau"
- Anscombe's quartet (Wikipedia) and The Visual Display of Quantitative Information (Wikipedia)
- Cleveland and McGill, "Graphical Perception," 1984
Prices and product names are as of October 19, 2026 and change often; confirm on the vendor's page before purchasing.
Follow new articles
Add SciHub101 to your feed reader to see new science and technology stories.
About the Author
SciHub101 is an independent science and technology publication founded and edited by Buğra Sözeri, a software engineer and app developer based in Türkiye. AI tools assist with drafting and research. Source documentation in the existing archive is uneven, and articles are being reviewed and corrected. The Editorial Team byline identifies editorial responsibility; it does not certify specialist or independent human review. Where we compare products, anything built by our own team is labelled as such — see the editorial guidelines and About page for how corrections and disclosures work.
Related Articles

SQL for Data Science — Essential Queries to Master
Learn the SQL data scientists use daily: SELECT, JOINs, GROUP BY, window functions, CTEs, and date handling, with PostgreSQL examples and common pitfalls.

How to Handle Missing Data — Imputation Strategies
Handle missing data in ML datasets: deletion, mean/median imputation, forward fill, KNN imputation. When to use each method with Python code examples.
Best AI Data Analysis Tools 2026 — Analyze Without Code
Best AI data analysis tools 2026: ChatGPT Advanced Data Analysis, Julius, Claude, Microsoft Copilot, Tableau Pulse compared for charts, stats, and insights — no code.

A/B Testing for Data Scientists — Statistical Fundamentals
A/B testing statistics explained: hypotheses, sample size, p-values, power, confidence intervals, and the seven mistakes that invalidate experiments.
Best Data Science Tools in 2026: An Evidence-Based Stack Comparison
Which data science tools people actually use in 2026, from Python, SQL and pandas to Jupyter and PyTorch, compared with survey data and official documentation.