Best Data Science Tools in 2026: An Evidence-Based Stack Comparison
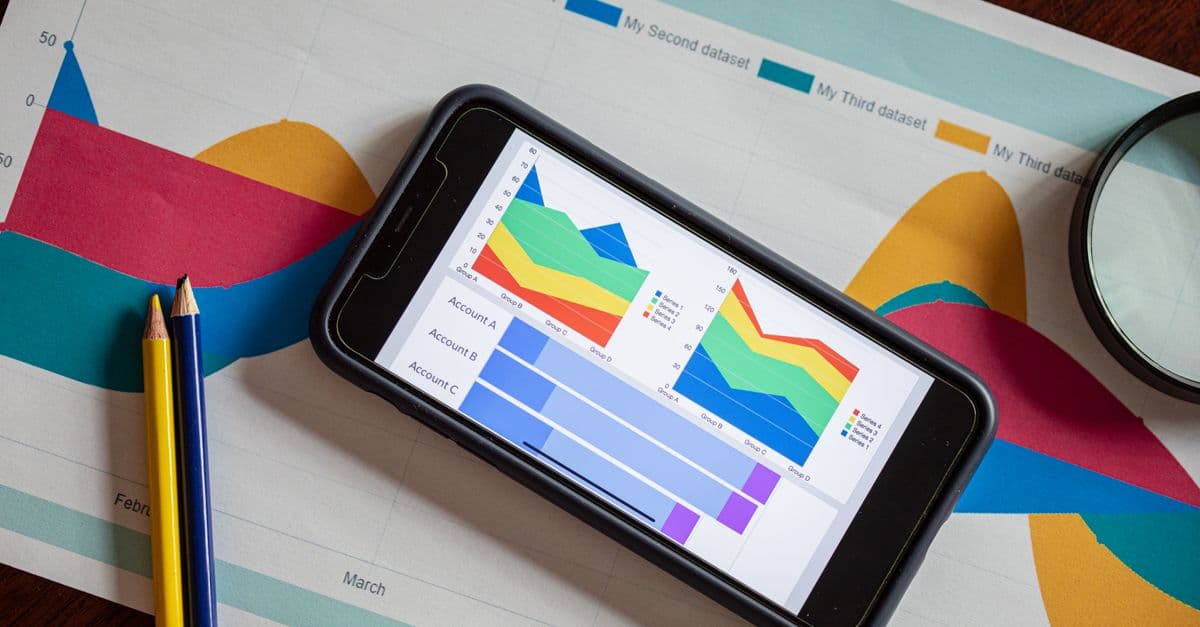
Photo: RDNE Stock project / Pexels
Lists of "best data science tools" are usually built on opinion, affiliate deals, or both. This article takes a different approach. It starts from what large developer surveys report people actually use, checks each tool's capabilities and limits against its official documentation, and then explains where each tool fits in a real workflow. Where the evidence is thin, the article says so.
Two surveys anchor the comparison. The Stack Overflow Developer Survey 2025 covers developers in general, so it shows how common a tool is across the software world. The Python Developers Survey 2024, run by the Python Software Foundation and JetBrains, drew more than 30,000 respondents and asks Python users specifically which data libraries they use. Neither survey is a random sample of data scientists, and both lean towards people who are active online, so treat the percentages as strong signals rather than precise measurements of the profession.
None of the tools recommended here requires a purchase. The core stack is open source, and the paid products discussed later are mentioned because many employers use them, not because readers need to buy anything.
Key Takeaways
- SQL (58.6%) and Python (57.9%) were used by nearly identical shares of all respondents in the Stack Overflow 2025 survey; R was used by 4.9%.
- Among Python users who do data work, the PSF/JetBrains 2024 survey found pandas at 80%, NumPy at 75%, scikit-learn at 68%, PyTorch at 66% and TensorFlow at 49%. Polars reached 15%.
- VS Code is the dominant editor: 75.9% of Stack Overflow respondents used it, and 48% of Python survey respondents named it their main editor. Jupyter is more often a second tool than a main one.
- PostgreSQL (55.6%) was the most used database in the Stack Overflow survey. Cloud warehouses such as BigQuery (6.5%) and Snowflake (4.1%) are much less common across all developers but central in many analytics teams.
- The entire core stack is free and open source. Paid tools become relevant for very large data, managed infrastructure, or dashboards for non-technical users.
What the Surveys Say: The Numbers in One Table
| Tool or category | Usage figure | Population surveyed | Source and year |
|---|---|---|---|
| SQL | 58.6% | All Stack Overflow respondents | Stack Overflow, 2025 |
| Python | 57.9% | All Stack Overflow respondents | Stack Overflow, 2025 |
| R | 4.9% | All Stack Overflow respondents | Stack Overflow, 2025 |
| pandas | 80% | Python survey, data-science frameworks question | PSF/JetBrains, 2024 |
| NumPy | 75% | Same | PSF/JetBrains, 2024 |
| scikit-learn | 68% (67% in 2023) | Same | PSF/JetBrains, 2024 |
| PyTorch | 66% (60% in 2023) | Same | PSF/JetBrains, 2024 |
| TensorFlow | 49% (48% in 2023) | Same | PSF/JetBrains, 2024 |
| Polars | 15% | Same | PSF/JetBrains, 2024 |
| VS Code | 75.9% | All Stack Overflow respondents | Stack Overflow, 2025 |
| VS Code as main editor | 48% | Python survey respondents | PSF/JetBrains, 2024 |
| PyCharm as main editor | 25% | Python survey respondents | PSF/JetBrains, 2024 |
| Jupyter as main editor / additional editor | 4% / 21% | Python survey respondents | PSF/JetBrains, 2024 |
| Jupyter Notebook / JupyterLab | 14.1% | All Stack Overflow respondents | Stack Overflow, 2025 |
| PostgreSQL | 55.6% | All Stack Overflow respondents | Stack Overflow, 2025 |
| MySQL / SQLite | 40.5% / 37.5% | All Stack Overflow respondents | Stack Overflow, 2025 |
| BigQuery / Snowflake / DuckDB | 6.5% / 4.1% / 3.3% | All Stack Overflow respondents | Stack Overflow, 2025 |
| Docker | 71.1% | All Stack Overflow respondents | Stack Overflow, 2025 |
| AWS / Azure / Google Cloud | 43.3% / 26.3% / 24.6% | All Stack Overflow respondents | Stack Overflow, 2025 |
Two cautions apply. First, the Stack Overflow figures describe all developers, most of whom are not data scientists, so they understate tools that are specific to analytics, such as Jupyter. Second, the PSF/JetBrains framework percentages come from a question shown to Python users doing data work, which is why they are much higher than the general figures. The surveys measure different populations, and the numbers should not be compared directly across rows from different sources.
The Shape of a Typical Workflow
Most data science work, whether in a start-up or a research lab, moves through the same stages. Tool choices are easier to understand once you see which stage each tool serves.
- Get the data. Usually SQL against a database or warehouse, sometimes files or APIs.
- Clean and reshape it. pandas, Polars or DuckDB in Python; dplyr in R.
- Explore and visualise. Matplotlib, seaborn or Plotly, typically inside a notebook.
- Model. scikit-learn and gradient-boosting libraries for tabular data; PyTorch or TensorFlow for deep learning.
- Share or deploy. Reports, dashboards (Streamlit, Tableau, Power BI), or a model served behind an API.
Cleaning usually takes more time than modelling, which is why the tools for stages 1 and 2 deserve as much attention as the machine learning libraries. Our explainer on what data cleaning actually involves shows why.
Languages: Python, SQL and R
Python
Python is the default language for data science because the libraries most people need, from pandas to PyTorch, are written for it first. That is the practical reason to learn it: not that the language is uniquely elegant, but that the ecosystem, documentation and community answers are concentrated there. Python is also a general-purpose language, so the same skills cover automation scripts, web APIs and model deployment.
Its weaknesses are real. Pure Python loops are slow, which is why the heavy numerical work in NumPy, pandas and PyTorch happens in compiled code underneath. Packaging and environment management have historically been confusing, and tools such as virtual environments, conda and newer installers exist to manage that.
import pandas as pd

df = pd.read_csv("customers.csv")
top_customers = (
    df.groupby("customer_id")
      .agg(revenue=("revenue", "sum"), orders=("order_id", "count"))
      .sort_values("revenue", ascending=False)
      .head(10)
)
SQL
SQL deserves equal billing with Python. In the Stack Overflow 2025 survey it was used by slightly more respondents than Python, and in analytics teams it is the language used to pull data out of the systems where it actually lives. It is also the language most data science interviews test, often with window functions and joins.
SELECT
    customer_segment,
    COUNT(DISTINCT customer_id) AS customers,
    SUM(revenue)               AS total_revenue,
    RANK() OVER (ORDER BY SUM(revenue) DESC) AS revenue_rank
FROM customer_transactions
WHERE transaction_date >= DATE '2026-01-01'
GROUP BY customer_segment
HAVING SUM(revenue) > 10000
ORDER BY total_revenue DESC;
SQL dialects differ in details such as date functions, but the core of SELECT, JOIN, GROUP BY and window functions transfers across PostgreSQL, BigQuery, Snowflake and DuckDB. Our SQL for data science guide covers the queries that come up most often.
R
R was designed by statisticians for statistics, and it remains strong in academic research, biostatistics and some parts of economics and social science. Its tidyverse packages, including dplyr and ggplot2, are widely regarded as a very clean way to manipulate and plot data, and many statistical methods appear as R packages before anyone ports them to Python. Its share of general developers is small (4.9% in the Stack Overflow 2025 survey), but that understates its weight in specific fields. If your target field publishes analysis in R, learn R. Otherwise, Python first is the safer default. The trade-offs are covered in detail in Python vs R for data science.
Where You Write Code: VS Code, Jupyter, PyCharm and Colab
Jupyter Notebook and JupyterLab
Project Jupyter grew out of IPython and gave data science its most recognisable format: the notebook, a document mixing code, output, charts and text. Notebooks are excellent for exploration, teaching and sharing an analysis with its reasoning visible.
The PSF/JetBrains data shows an interesting pattern: only 4% of Python respondents named Jupyter as their main editor, but 21% used it as an additional one. That matches how many practitioners work. They explore in a notebook and then move code into ordinary Python files once it needs tests, version control and reuse. Notebooks have well-known pitfalls: cells can be run out of order, hidden state makes results hard to reproduce, and notebook files produce noisy diffs in Git.
pip install jupyterlab
jupyter lab
VS Code
Visual Studio Code is the most used editor across the software world (75.9% of Stack Overflow 2025 respondents) and the most common main editor among Python developers (48%). For data work its main advantage is that one tool covers notebooks, scripts, terminals, Git and remote connections to servers or containers. Microsoft's Python and Jupyter extensions add debugging, linting and the ability to run notebook files inside the editor.
PyCharm
PyCharm, JetBrains' Python IDE, was the main editor for 25% of Python survey respondents. It offers deeper code analysis and refactoring out of the box than VS Code, at the cost of being heavier. Its professional edition includes notebook and database tools. Bear in mind that the survey is co-run by JetBrains, which may slightly favour PyCharm users responding.
Google Colab
Colab is a hosted Jupyter environment that runs in the browser with no installation, which makes it useful for learning and for trying out GPU-based deep learning. Its own FAQ is clear about the limits of the free tier: notebooks can run for at most 12 hours depending on availability and usage, Colab does not publish its usage limits, and hardware availability can change dynamically. It is a good learning environment, not a guaranteed compute service. See the Colab FAQ for current terms.
| Environment | Best for | Main limitation |
|---|---|---|
| JupyterLab | Exploration, teaching, narrative analysis | Hidden state, hard to test and review |
| VS Code | Mixed notebook and script work, remote development | Needs extensions configured |
| PyCharm | Large Python codebases, refactoring | Heavier; advanced features in paid edition |
| Google Colab | Learning, free short GPU sessions | No guaranteed resources; session limits |
Data Manipulation: pandas, NumPy, Polars and DuckDB
pandas
pandas is the most used data library among Python data practitioners, at 80% in the 2024 PSF/JetBrains survey. According to the pandas project's own history, development began in 2008 at AQR Capital Management, the library was open-sourced by the end of 2009, and it has been a NumFOCUS-sponsored project since 2015. Its DataFrame, a table with labelled columns and an index, became the standard way to hold tabular data in Python.
import pandas as pd

df = pd.read_csv("sales.csv", parse_dates=["date"])
df = df.dropna(subset=["customer_id"])

monthly = (
    df.groupby(df["date"].dt.to_period("M"))["revenue"]
      .agg(["sum", "mean", "count"])
      .reset_index()
)
monthly.to_csv("monthly_report.csv", index=False)
pandas' main limits are memory and speed on large data. It generally works on data held in memory, and many operations run on a single CPU core. That is not a problem for most business datasets, but it becomes one at tens of gigabytes.
NumPy
NumPy provides the n-dimensional array and fast vectorised mathematics that most of the scientific Python stack is built on. pandas, scikit-learn and many plotting libraries use NumPy arrays internally. You will use it directly for array maths, linear algebra and random number generation. Our NumPy guide covers the essentials.
import numpy as np

rng = np.random.default_rng(seed=42)   # reproducible random numbers
A = rng.standard_normal((100, 5))
cov = np.cov(A, rowvar=False)          # 5 x 5 covariance matrix
print(cov.shape)
Polars and DuckDB: the newer options
Two newer tools have grown quickly because they handle larger data on a single machine. Polars is a DataFrame library with a Rust core, multi-threaded execution and a lazy query planner that optimises a chain of operations before running it. It reached 15% in the 2024 Python survey. DuckDB is an in-process analytical SQL database: it runs inside your Python session, needs no server, and can query Parquet and CSV files directly. DuckDB was used by 3.3% of all Stack Overflow 2025 respondents, a small but notable figure for a tool aimed at analysts.
Neither replaces pandas for everyone. pandas still has the widest ecosystem and the most documentation. The practical comparisons are in Polars vs pandas and DuckDB vs pandas.
| Library | Interface | Strengths | Watch out for |
|---|---|---|---|
| pandas | Python DataFrame | Largest ecosystem, most tutorials | Memory use, mostly single-threaded |
| Polars | Python DataFrame (Rust core) | Speed, multi-threading, lazy optimisation | Different API; fewer integrations |
| DuckDB | SQL (and Python API) | Fast SQL on local files, no server | SQL-first; not a full replacement for a warehouse |
Visualisation: Matplotlib, seaborn and Plotly
Matplotlib is the oldest and most widely used Python plotting library. It can produce almost any static chart, but its default styling is plain and its API is verbose. seaborn is built on top of Matplotlib and adds statistical plots, such as distributions, box plots and regression lines, with better defaults. Plotly is a separate library, not built on Matplotlib, that produces interactive charts in the browser and can export standalone HTML files.
import matplotlib.pyplot as plt
import seaborn as sns

sns.set_theme(style="whitegrid")
fig, axes = plt.subplots(1, 2, figsize=(12, 4))
sns.histplot(df["revenue"], kde=True, ax=axes[0])
sns.boxplot(data=df, x="region", y="revenue", ax=axes[1])
plt.tight_layout()
plt.savefig("analysis.png", dpi=150)
Choosing a plotting tool matters less than choosing an honest chart. Truncated axes, cherry-picked time windows and dual axes mislead readers regardless of the library, a topic covered in how data visualization can mislead. For business-facing tools, see our comparison of data visualization tools.
Machine Learning: scikit-learn, Gradient Boosting, PyTorch and TensorFlow
scikit-learn
scikit-learn is the standard library for classical machine learning in Python and was used by 68% of Python data respondents in 2024. According to its official history, it began in 2007 as a Google Summer of Code project by David Cournapeau; researchers at INRIA took over leadership in 2010 and made the first public release on 1 February 2010. Its strength is a consistent API: almost every model has fit, predict and score, and preprocessing steps can be chained into a pipeline.
from sklearn.model_selection import train_test_split, cross_val_score
from sklearn.pipeline import make_pipeline
from sklearn.preprocessing import StandardScaler
from sklearn.ensemble import RandomForestClassifier

X_train, X_test, y_train, y_test = train_test_split(
    X, y, test_size=0.2, random_state=42, stratify=y
)

model = make_pipeline(StandardScaler(), RandomForestClassifier(n_estimators=200, random_state=42))
scores = cross_val_score(model, X_train, y_train, cv=5, scoring="roc_auc")
print(f"CV ROC AUC: {scores.mean():.3f}")
Putting the scaler inside the pipeline matters. If you scale the full dataset before splitting, information from the test set leaks into training and the evaluation becomes optimistic. That failure is common enough to have its own explainer: why data leakage breaks AI evaluations.
Gradient boosting: XGBoost, LightGBM and CatBoost
For structured, tabular data, such as customer records, transactions or sensor readings, gradient-boosted decision trees are often the strongest practical choice. XGBoost, LightGBM and CatBoost are the three common libraries, and all offer scikit-learn-compatible interfaces. They build many small decision trees in sequence, each correcting the errors of the ones before. See XGBoost explained for how they work and when they beat neural networks.
PyTorch and TensorFlow
For deep learning, the two main frameworks are PyTorch and TensorFlow (with its Keras API). The 2024 Python survey shows PyTorch ahead and growing faster: 66% versus 49%, up from 60% and 48% in 2023. PyTorch's define-by-run style, where the model is ordinary Python code, made it popular in research, and most new open-source models are released with PyTorch code. TensorFlow retains a strong deployment toolchain and remains common in established production systems. JAX is a third option, popular in some research groups for its composable transformations.
import torch
import torch.nn as nn

class NeuralNet(nn.Module):
    def __init__(self, input_dim: int, hidden_dim: int, output_dim: int):
        super().__init__()
        self.layers = nn.Sequential(
            nn.Linear(input_dim, hidden_dim),
            nn.ReLU(),
            nn.Dropout(0.3),
            nn.Linear(hidden_dim, output_dim),
        )

    def forward(self, x):
        return self.layers(x)

model = NeuralNet(input_dim=20, hidden_dim=64, output_dim=1)
optimizer = torch.optim.Adam(model.parameters(), lr=1e-3)
loss_fn = nn.BCEWithLogitsLoss()
For a side-by-side look at the three frameworks, see PyTorch vs TensorFlow vs JAX.
| Task | Usual first choice | Why |
|---|---|---|
| Tabular classification or regression | scikit-learn, then gradient boosting | Strong accuracy, fast to train, easy to explain |
| Clustering, dimensionality reduction | scikit-learn | Mature implementations, consistent API |
| Images, audio, text, large language models | PyTorch | Research and open-model ecosystem |
| Existing TensorFlow production systems | TensorFlow/Keras | Deployment tooling and continuity |
Databases and Warehouses
Most analysis starts by querying data where it is stored. The Stack Overflow 2025 survey ranked PostgreSQL first among all developers at 55.6%, followed by MySQL (40.5%) and SQLite (37.5%). These are transactional databases, the systems behind applications. Analytical work on large volumes usually runs in a columnar cloud warehouse instead.
- PostgreSQL is a free, open-source relational database with strong standards support. It is a sensible database to learn SQL on, because what you learn transfers.
- SQLite is a file-based database embedded in countless applications. It is useful for small local projects.
- BigQuery is Google Cloud's serverless warehouse. Google's pricing documentation describes two compute models: on-demand pricing, billed per TiB of data processed by queries, and capacity pricing based on reserved compute. Because on-demand queries are billed by bytes scanned, partitioning and clustering tables, and selecting only needed columns, directly lowers cost.
- Snowflake separates storage from compute. Its documentation explains that virtual warehouses consume credits while they run queries and load data, so cost depends on warehouse size and how long it runs.
- DuckDB fills the gap between the two worlds: warehouse-style SQL on a laptop, as described in what DuckDB is.
Transformation of warehouse data is increasingly managed with tools such as dbt, which applies software practices like version control and testing to SQL; see our dbt guide.
Sharing Results: Streamlit, Tableau and Power BI
Streamlit turns a Python script into an interactive web app, which makes it a fast way for data scientists to share models and analyses without writing front-end code.
import pandas as pd
import plotly.express as px
import streamlit as st

st.title("Sales Dashboard")
uploaded = st.file_uploader("Upload CSV")
if uploaded:
    df = pd.read_csv(uploaded, parse_dates=["date"])
    regions = st.multiselect("Region", sorted(df["region"].unique()))
    view = df[df["region"].isin(regions)] if regions else df
    st.metric("Total revenue", f"${view['revenue'].sum():,.0f}")
    st.plotly_chart(px.line(view, x="date", y="revenue"))
Run it with streamlit run app.py. Our Streamlit guide covers deployment.
Tableau and Power BI serve a different audience: business users who need to explore dashboards without code. They are commercial products with per-user licensing, and which one a team uses is usually decided by the organisation's existing software, Power BI being common in companies already standardised on Microsoft tools. For an analyst, the useful skill is understanding data models and good dashboard design, which transfers between them.
Production and Cloud
Moving a model from a notebook into a system that runs every day brings in a different set of tools: Docker for packaging (used by 71.1% of all Stack Overflow 2025 respondents), a cloud platform for compute and storage, a scheduler or orchestrator for pipelines, and monitoring for data and model quality. Among cloud providers, the 2025 survey reported AWS at 43.3%, Azure at 26.3% and Google Cloud at 24.6% of all respondents. Each offers managed machine learning services, but the underlying concepts are the same; see cloud computing on AWS, Azure and GCP explained and MLOps explained for beginners.
Cost: What Is Free and What Is Not
| Tool | Licence or cost model | Notes |
|---|---|---|
| Python, R | Open source, free | |
| pandas, NumPy, Polars, scikit-learn | Open source, free | BSD or MIT-style licences |
| PyTorch, TensorFlow, XGBoost | Open source, free | GPU hardware or cloud compute may cost money |
| JupyterLab, VS Code | Free | VS Code extensions are mostly free |
| PostgreSQL, SQLite, DuckDB | Open source, free | |
| Streamlit | Open-source library | Hosting options vary |
| Google Colab | Free tier with no guaranteed resources | Paid tiers add more compute |
| BigQuery | On-demand per TiB scanned, or capacity pricing | Check current regional prices |
| Snowflake | Credits consumed by running warehouses | Cost scales with size and runtime |
| Tableau, Power BI | Commercial per-user licences | Usually paid by the employer |
The point of this table is not to recommend purchases but to show that cost is not a barrier to learning. Everything in the core workflow can be installed and used for free. Paid services become relevant when data volume, team collaboration or business reporting requires them, and that decision is usually made by an employer.
A Learning Order That Matches the Evidence
The surveys suggest a sensible order: learn the tools with the widest use first, then specialise.
| Stage | Focus | Tools |
|---|---|---|
| 1 | Programming basics and environment | Python, VS Code or JupyterLab |
| 2 | Querying data | SQL on PostgreSQL or DuckDB |
| 3 | Data manipulation | pandas, NumPy |
| 4 | Visualisation and statistics | Matplotlib, seaborn, basic statistics |
| 5 | Classical machine learning | scikit-learn, one gradient-boosting library |
| 6 | Portfolio projects | All of the above, with Git |
| 7 | Specialisation | Deep learning (PyTorch), data engineering (dbt, warehouses) or BI tools |
These stages overlap. It is better to start a small project in stage 2 than to wait until every tool is mastered. Statistics deserves more time than most tool lists give it: knowing which question a model answers, and how uncertain the answer is, matters more than which library produced it.
Common Misconceptions
"You need expensive software to do data science." The most used tools in both surveys are open source and free.
"Python has replaced SQL." The Stack Overflow 2025 data shows SQL used by slightly more developers than Python. In analytics, the two are complements.
"Deep learning is the default for every problem." For tabular business data, scikit-learn models and gradient boosting are usually the first and often the best choice.
"Notebooks are enough for production." Notebooks are good for exploration, but scheduled pipelines and deployed models need tested, version-controlled code.
"The newest tool is always better." Polars and DuckDB are fast and growing, but pandas' 80% usage reflects a deep ecosystem that newer libraries are still building.
Frequently Asked Questions
Q: What are the most used data science tools in 2026? A: On the latest survey data, the core is Python and SQL, pandas and NumPy for data handling, scikit-learn for classical machine learning, PyTorch for deep learning, and VS Code or Jupyter as the working environment. PostgreSQL is the most used database across developers.
Q: Do I need to buy any tools to get started? A: No. Python, R, pandas, NumPy, scikit-learn, PyTorch, JupyterLab, VS Code, PostgreSQL and DuckDB are all free. Paid services such as cloud warehouses or BI tools are usually provided by employers when the work needs them.
Q: Should I learn Python or SQL first? A: Either order works, and you will need both. Many learners start with Python basics and add SQL within weeks. SQL was used by 58.6% and Python by 57.9% of Stack Overflow 2025 respondents.
Q: Should I learn PyTorch or TensorFlow? A: For most new learners, PyTorch. It was used by 66% of Python data respondents in the 2024 PSF/JetBrains survey versus 49% for TensorFlow, and most recent open-source models ship with PyTorch code. Learn TensorFlow if a job or existing codebase uses it.
Q: Is pandas still worth learning now that Polars exists? A: Yes. pandas was used by 80% of Python data respondents in 2024, against 15% for Polars, and most tutorials and libraries assume it. Polars is worth adding when you work with larger datasets on one machine.
Q: Is Google Colab enough for deep learning? A: For learning and small experiments, often yes. Colab's FAQ states that free notebooks run for at most 12 hours and that resources are not guaranteed, so it is not suited to long or reliable training runs.
The Bottom Line
The evidence points to a stable, free core: Python and SQL, pandas and NumPy, scikit-learn and PyTorch, written in VS Code or Jupyter and stored in a SQL database. Newer tools such as Polars and DuckDB are worth watching and adding once the basics are solid. Paid platforms matter at scale or for business reporting, and the choice is usually made by an employer rather than an individual. Depth in the core tools, combined with sound statistics, is worth more than a long list of products.
Sources
- Stack Overflow Developer Survey 2025, Technology section: survey.stackoverflow.co/2025/technology
- Python Software Foundation and JetBrains, Python Developers Survey 2024 results: lp.jetbrains.com/python-developers-survey-2024
- scikit-learn, About us (project history): scikit-learn.org/stable/about.html
- pandas, About pandas (project history): pandas.pydata.org/about
- Google Colaboratory FAQ: research.google.com/colaboratory/faq.html
- Google Cloud, BigQuery pricing: cloud.google.com/bigquery/pricing
- Snowflake documentation, Understanding compute cost: docs.snowflake.com
Related Articles
- Python vs R for Data Science
- SQL for Data Science — Queries You Need to Know
- Data Visualization Tools — Tableau vs Power BI vs Matplotlib
Last verified: October 2026
Follow new articles
Add SciHub101 to your feed reader to see new science and technology stories.
About the Author
SciHub101 is an independent science and technology publication founded and edited by Buğra Sözeri, a software engineer and app developer based in Türkiye. AI tools assist with drafting and research. Source documentation in the existing archive is uneven, and articles are being reviewed and corrected. The Editorial Team byline identifies editorial responsibility; it does not certify specialist or independent human review. Where we compare products, anything built by our own team is labelled as such — see the editorial guidelines and About page for how corrections and disclosures work.
Related Articles
SQL for Data Science — Essential Queries to Master
Learn the SQL data scientists use daily: SELECT, JOINs, GROUP BY, window functions, CTEs, and date handling, with PostgreSQL examples and common pitfalls.

Python Data Libraries Cheat Sheet 2026 — Quick Reference
Quick reference for Python data libraries 2026: Pandas, Polars, DuckDB, NumPy, Plotly. Common operations side-by-side. Bookmark for daily work.

DuckDB vs Pandas — Which to Use for Data Analysis 2026
DuckDB vs Pandas: when to use each, performance benchmarks, SQL vs Python syntax, real examples. DuckDB is faster and handles larger data — should you switch?

What Is DuckDB? In-Process Analytics SQL
DuckDB is an embedded analytical database — SQLite for analytics. Query Parquet, CSV, and Arrow with SQL, no ETL needed.

Python for Data Science: Complete Guide 2026
Master Python for data science in 2026. Covers essential libraries, workflows, career paths, and learning roadmap with real examples.