Python for Data Science: Complete Guide 2026

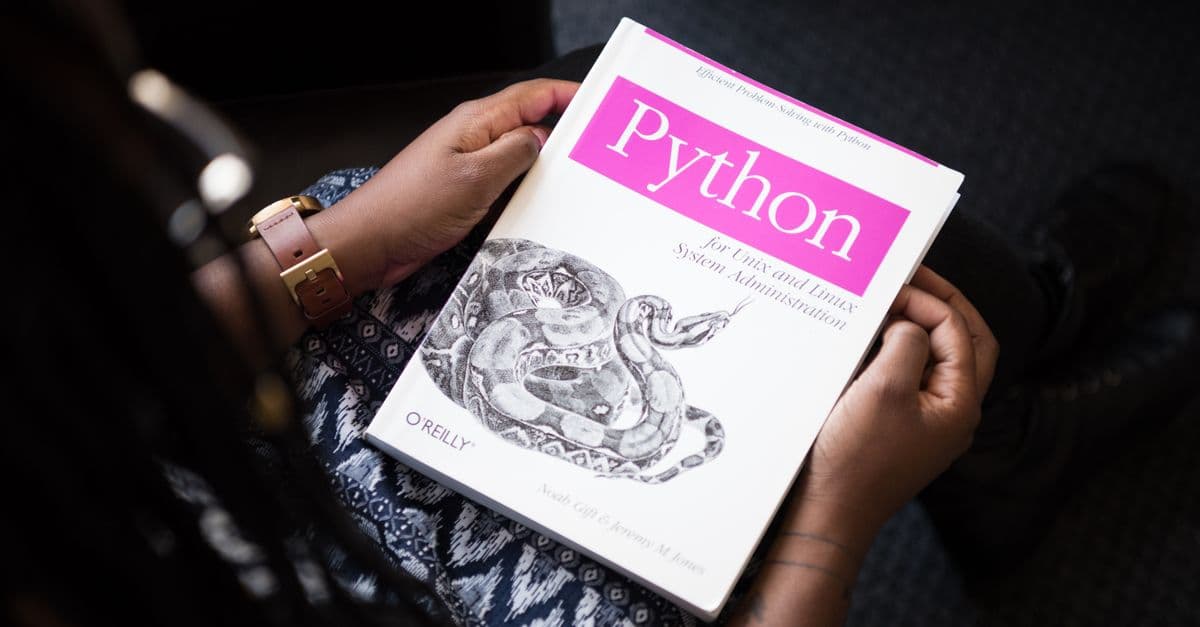
Photo: Christina Morillo / Pexels
Python has held the top spot in the Stack Overflow Developer Survey for 12 consecutive years. In the 2024 edition, 51% of all professional developers use it — and among data scientists, the share is closer to 90%. The Kaggle State of Data Science & Machine Learning Survey 2024 puts Python usage at 88% among practitioners, up from 83% three years ago. No other language is even close.
This guide explains why Python dominates, walks through the essential library stack, covers the real data analysis workflow (including the messy parts), and maps out career paths and learning resources for 2026. Whether you are switching careers or deepening your existing skills, this is where to start.
Why Python Dominates Data Science
Three forces keep Python at the top.
Readability. Python enforces clean indentation and uses plain English keywords. Code that a junior analyst writes looks recognizable to a senior ML engineer. That shared syntax lowers collaboration overhead across data teams that often include people from statistics, engineering, and domain-specific backgrounds.
Ecosystem depth. The scientific Python ecosystem — NumPy, SciPy, pandas, Matplotlib, scikit-learn — has been maintained for over 15 years. Alternatives in R, Julia, or Scala have pockets of strength, but none match the breadth and maturity of the Python stack.
Community and career. Python has more Stack Overflow questions answered, more tutorials written, and more job postings listing it than any rival. For a beginner, that matters enormously: almost any error you encounter has already been solved publicly.
The Essential Python Data Science Stack
Understanding what each library does — and what it does not do — prevents the common mistake of using the wrong tool for a job.
| Library | Primary Use | Strength | Limitation |
|---|---|---|---|
| NumPy | N-dimensional arrays, vectorized math | Extremely fast array operations; backbone of the entire ecosystem | Raw arrays only; no labels or column names |
| pandas | DataFrames — labeled tabular data | Data manipulation workhorse; SQL-like operations in Python | Loads entire dataset into RAM; slow on >10 GB data |
| Matplotlib | Low-level 2D plotting | Maximum control over every visual element | Verbose; many lines of code for simple charts |
| Seaborn | Statistical visualization | Beautiful defaults; built for DataFrames | Limited customization compared to raw Matplotlib |
| scikit-learn | Classical ML algorithms | Consistent .fit() / .predict() API across all models |
Not built for deep learning or very large datasets |
| TensorFlow | Deep learning (Google) | Production-grade; TFServing; TFLite for mobile | Steeper learning curve; less Pythonic API |
| PyTorch | Deep learning (Meta) | Dominant in research; dynamic computation graph; cleaner API | Production serving requires extra setup |
| statsmodels | Statistical tests and regression | Detailed p-values, confidence intervals, R-style formula API | Less focus on prediction; more on inference |
| SQLAlchemy | SQL database connectivity | Works with PostgreSQL, MySQL, SQLite; ORM support | Adds abstraction overhead for simple queries |
| DuckDB | In-process analytical SQL | Reads Parquet/CSV directly; faster than pandas for aggregations | Newer ecosystem; fewer tutorials |
Which deep learning framework to choose in 2026? PyTorch now leads in research publications and has caught up with TensorFlow in production deployments. If you are starting out or working in academia, learn PyTorch first. TensorFlow is still widely used at large companies with existing infrastructure. For a deeper look at when machine learning is appropriate, see Machine Learning Explained: Beginner's Guide.
Jupyter Notebooks: Power and Pitfall
Jupyter notebooks are the standard environment for exploratory data analysis. A notebook is a document that interleaves code cells, output (including inline plots), and Markdown text. This makes it ideal for:
- Exploration — run one cell at a time and see results immediately
- Communication — share a notebook that shows code and findings together
- Teaching — step-by-step walkthroughs with explanatory text
Where notebooks break down:
The biggest problem with notebooks is hidden state. Cells can be run in any order, and variables persist across that order. A notebook that runs clean top-to-bottom when freshly opened may have been developed by running cells in a chaotic order, leaving intermediate objects in memory that are never recreated. This causes reproducibility failures that are notoriously hard to debug.
For production code — pipelines that run automatically, model training scripts, APIs — use .py files organized as proper Python modules. Tools like nbconvert, papermill, and nbmake can help bridge the gap, but the professional standard is to treat notebooks as scratch pads and migrate logic to scripts before deployment.
The Data Analysis Workflow: CRISP-DM
The Cross-Industry Standard Process for Data Mining (CRISP-DM) is the most widely used framework for structuring data projects. It has six phases:
1. Business Understanding Define the actual problem. What decision will this model or analysis support? What does success look like? A vague brief ("make us smarter about customers") needs to become a specific question ("predict which customers will churn in the next 30 days with 80%+ recall").
2. Data Understanding Collect available data sources. Profile each dataset: how many rows, how many columns, what data types, what time range, who collected it and how. Look for obvious quality issues early.
3. Data Preparation This is where 80% of project time actually goes. See the full section below.
4. Modeling Train candidate models. Use cross-validation, not a single train/test split. Compare multiple algorithms before committing to one.
5. Evaluation Check model performance against business criteria, not just accuracy metrics. A 99% accurate fraud detection model that misses 90% of actual fraud is useless.
6. Deployment Put the model into production and monitor it. Deployment is often treated as an afterthought — it should be planned from the start.
Data Cleaning: The Unglamorous 80%
No real-world dataset arrives clean. Here are the most common problems and their solutions.
Missing values
Check with df.isnull().sum(). Options:
- Drop rows (
df.dropna()) — safe only if missingness is random and rows are plentiful - Mean/median imputation — fast but distorts distributions; use
SimpleImputerfrom scikit-learn - Model-based imputation (
IterativeImputer) — better quality but slower - Add an indicator column (
is_age_missing) before imputing — the fact that a value is missing is often itself informative
Outliers Detect with IQR fences or z-scores. Decide whether to cap (winsorize), remove, or transform (log transform often works for right-skewed distributions). Never remove outliers without understanding why they exist — they may be your most important data points.
Duplicates
df.duplicated().sum() first. Exact duplicates are easy to drop. Near-duplicates (same customer, slightly different spelling) require fuzzy matching or domain knowledge.
Data types
Columns that should be datetime but loaded as strings cause cascading bugs. Always run df.dtypes early and fix types explicitly.
Encoding categoricals
- One-hot encoding (
pd.get_dummies) — for low-cardinality nominals - Ordinal encoding — for ordered categories (small/medium/large)
- Target encoding — replace category with the mean of the target variable; powerful but leaks if not done inside cross-validation folds
Exploratory Data Analysis (EDA)
EDA is structured curiosity. Standard starting moves:
df.describe() # count, mean, std, min, quartiles, max
df['col'].value_counts() # frequency table for categoricals
df.corr() # Pearson correlations between numerics
Visualizations that earn their keep:
- Histogram — distribution shape; spot bimodal distributions immediately
- Box plot — outliers and quartile spread across groups
- Correlation heatmap (
seaborn.heatmap(df.corr())) — multicollinearity at a glance - Pair plot (
seaborn.pairplot) — pairwise scatter plots for up to ~10 features; spot clusters and non-linear relationships
The goal of EDA is to form hypotheses, not to produce final visualizations. Keep notes on every surprising finding — they inform feature engineering decisions.
Feature Engineering
Raw data rarely goes directly into a model. Feature engineering transforms raw columns into representations that algorithms can learn from more effectively.
Datetime features From a single timestamp: extract hour, day of week, month, quarter, is_weekend, days_since_last_event. Time-series patterns are invisible to a model that only sees a raw Unix timestamp.
Interaction terms
price_per_sqft = price / sqft — dividing two features sometimes captures the relationship better than either alone.
Polynomial features
PolynomialFeatures from scikit-learn generates squared and cross-product terms automatically. Use with caution — high-degree polynomials overfit aggressively.
Target encoding For high-cardinality categoricals like ZIP code or product ID, replace each category value with the mean of the target variable computed on the training set. Must be computed inside each cross-validation fold to prevent leakage.
Binning Convert continuous variables into ordinal buckets (age groups, income brackets). Loses information but can capture non-linear effects and make models more robust to outliers.
Model Deployment Basics
Training a model on your laptop is the beginning. Putting it in front of users requires several additional steps.
Serialization
Save a trained scikit-learn model with pickle or, preferably, joblib:
import joblib
joblib.dump(model, "model_v1.pkl")
PyTorch models use torch.save(model.state_dict(), "model.pth").
Serving with FastAPI
FastAPI is the current standard for wrapping a model in a REST endpoint. A minimal prediction endpoint loads the model at startup and exposes a POST /predict route that accepts JSON input and returns predictions.
Docker containers
Package your FastAPI app in a Docker image so it runs identically in development and production. Include requirements.txt and pin all dependency versions.
ML monitoring A deployed model degrades as real-world data drifts from training data. Set up monitoring for:
- Prediction distribution shifts (is the model suddenly predicting a very different class balance?)
- Feature distribution drift (are input values falling outside the training range?)
- Business metric drift (conversion rate, churn rate — the downstream signal)
Tools like Evidently AI and Grafana are commonly used for open-source monitoring setups.
Career Paths in Data Science (2026)
Three roles dominate the field, with meaningfully different day-to-day work and compensation:
| Role | Core Skills | Typical 2026 Salary (US) | Focus |
|---|---|---|---|
| Data Analyst | SQL, Excel/Tableau, pandas, basic stats | $75,000 – $110,000 | Reporting, dashboards, ad-hoc analysis |
| Data Scientist | Python, ML, statistics, communication | $110,000 – $160,000 | Predictive models, experimentation (A/B tests) |
| ML Engineer | Python, MLOps, distributed systems, software engineering | $140,000 – $200,000+ | Building, deploying, and maintaining ML systems at scale |
The boundaries are blurry and company-dependent. At smaller companies, a "data scientist" often does work that would be split across all three roles at a large tech firm.
The underrated skill: domain expertise. A data scientist who deeply understands healthcare, logistics, or finance is far more valuable than a technical generalist who needs months to understand the business problem.
Learning Roadmap
Follow this sequence to avoid common detours:
- Python fundamentals (2–4 weeks) — lists, dicts, functions, classes, file I/O. Python.org's official tutorial is sufficient.
- pandas + NumPy (4–6 weeks) — learn by doing real datasets (Kaggle provides hundreds of free ones)
- SQL (3–4 weeks) — still essential; most production data lives in relational databases. Mode Analytics SQL tutorial is free and practical.
- Visualization (2 weeks) — Matplotlib basics, then Seaborn for statistical plots
- Statistics (ongoing) — hypothesis testing, confidence intervals, regression. StatQuest on YouTube is exceptional.
- Machine learning (6–10 weeks) — scikit-learn first; then deeper theory
- Domain expertise (ongoing) — pick an industry and go deep
Free resources that are actually good:
- Kaggle Learn — short, hands-on courses with immediate practice. Free.
- fast.ai — top-down deep learning; practical before theoretical. Free.
- CS229 (Stanford) — Andrew Ng's graduate ML course. Lecture notes and problem sets are publicly available.
- The Elements of Statistical Learning (Hastie, Tibshirani, Friedman) — free PDF; the canonical statistical ML textbook.
Common Interview Topics
Interviewers for data science roles consistently probe these areas:
- SQL — window functions, CTEs, joins, aggregations on messy data
- pandas — groupby, merge, pivot_table, handling nulls
- Probability and statistics — Bayes' theorem, p-values, A/B test design, Central Limit Theorem
- ML algorithms — how does gradient boosting work? What is regularization? Bias-variance tradeoff?
- Case studies — "design a recommendation system for X"; evaluate both technical and communication clarity
- Take-home projects — given a messy CSV, produce insights and a model; code quality matters as much as results
The pattern that distinguishes strong candidates: they always ask what success looks like before writing a single line of code.
FAQs
Q: Do I need a degree to become a data scientist? A: No, but you need demonstrable skills. Bootcamp graduates and self-taught practitioners regularly get hired. A strong portfolio of Kaggle notebooks and GitHub projects can outweigh a degree in an unrelated field. That said, a graduate degree in statistics or computer science still opens doors at research-heavy companies.
Q: Should I learn R or Python for data science? A: Python is the better choice for most people. R has genuine strengths in academic statistics and bioinformatics, but Python has broader industry adoption, stronger ML tooling, and transfers to software engineering work. The Kaggle 2024 survey shows 88% of data practitioners use Python versus 28% for R (many use both).
Q: How important is SQL for data scientists? A: Extremely important. Most real data lives in relational databases or data warehouses (BigQuery, Snowflake, Redshift). A data scientist who cannot write intermediate SQL — window functions, CTEs, complex joins — is severely limited. Treat SQL as a core skill, not an optional add-on.
Q: What is the fastest way to learn pandas? A: Work through real datasets with a specific question in mind. Kaggle's free practice datasets and "Getting Started" competitions are ideal. The pandas documentation is also unusually good — the "10 minutes to pandas" introduction is genuinely worth reading.
Q: What is the difference between data science and machine learning engineering? A: Data scientists typically focus on analysis, experiment design, and building models. ML engineers focus on productionizing those models — writing scalable code, building data pipelines, deploying to infrastructure, and maintaining reliability. The roles overlap, especially at smaller companies.
Q: Is deep learning required to get a data science job? A: Not for most roles. Classical ML (gradient boosting, logistic regression, random forests) handles the majority of real business problems. Deep learning becomes necessary for computer vision, natural language processing, and audio. Know the fundamentals of neural networks, but do not skip classical methods.
Q: How long does it take to become job-ready as a data scientist? A: With consistent effort (15–20 hours per week), most people reach entry-level readiness in 9–15 months following a structured roadmap. Background matters: someone with a statistics degree may need only 3–4 months of Python practice, while someone starting from scratch may need 18 months.
Q: What Python libraries should I learn first? A: Start with pandas and NumPy — these underpin almost everything. Add Matplotlib for basic visualization, then scikit-learn for ML. Master these four before touching deep learning frameworks. The order matters: jumping to TensorFlow before understanding DataFrames leads to confusion about which layer is causing problems.
Sources
- Stack Overflow Developer Survey 2024 — stackoverflow.com/insights/survey/2024
- Kaggle State of Data Science & Machine Learning 2024 — kaggle.com/c/kaggle-survey-2024
- NumPy documentation — numpy.org/doc
- pandas documentation — pandas.pydata.org/docs
- scikit-learn documentation — scikit-learn.org/stable
- CRISP-DM reference model — IBM SPSS Modeler, 2021
Related reading: Machine Learning Explained: Beginner's Guide — understand the algorithms that power data science models.
Read next:
Follow new articles
Add SciHub101 to your feed reader to see new science and technology stories.
About the Author
SciHub101 is an independent science and technology publication founded and edited by Buğra Sözeri, a software engineer and app developer based in Türkiye. AI tools assist with drafting and research. Source documentation in the existing archive is uneven, and articles are being reviewed and corrected. The Editorial Team byline identifies editorial responsibility; it does not certify specialist or independent human review. Where we compare products, anything built by our own team is labelled as such — see the editorial guidelines and About page for how corrections and disclosures work.
Related Articles
NumPy Guide — Python's Foundation for Data Science
Learn NumPy from scratch — arrays, broadcasting, vectorization, indexing, and linear algebra. The bedrock library behind pandas, scikit-learn, and PyTorch.

What Is DuckDB? In-Process Analytics SQL
DuckDB is an embedded analytical database — SQLite for analytics. Query Parquet, CSV, and Arrow with SQL, no ETL needed.

Python Data Libraries Cheat Sheet 2026 — Quick Reference
Quick reference for Python data libraries 2026: Pandas, Polars, DuckDB, NumPy, Plotly. Common operations side-by-side. Bookmark for daily work.

How to Handle Missing Data — Imputation Strategies
Handle missing data in ML datasets: deletion, mean/median imputation, forward fill, KNN imputation. When to use each method with Python code examples.

Pandas Python Guide — Data Analysis for Beginners
Learn pandas: DataFrames, loading, cleaning, groupby, merging, and plotting, with pandas 3.0 code examples and a full CSV-to-insight analysis pipeline.
Polars vs Pandas 2026 — Should You Make the Switch?
Polars vs Pandas compared: real benchmarks, syntax differences, migration strategy. Why Polars is often 10 to 20x faster and when switching still isn't worth it.