Data Science
Streamlit Tutorial — Build Data Apps in Python in Minutes
Streamlit tutorial for data scientists: build interactive web apps in pure Python. Charts, widgets, deployment guide. The fastest path from notebook to web app.
Data science tools, SQL, Python, visualization, and career guides. Everything you need to become a data scientist.
Streamlit tutorial for data scientists: build interactive web apps in pure Python. Charts, widgets, deployment guide. The fastest path from notebook to web app.

Statistics working data scientists use: descriptive summaries, distributions, hypothesis tests, regression, causal inference, plus worked A/B numbers.

ML job market 2026: BLS growth and pay, Levels.fyi salary data, entry-level hiring trends, skills employers list, and how data science and ML roles differ.
Build a data science portfolio that shows real skills: five project types, a clean GitHub structure, honest metrics, and write-ups hiring teams can read.
Python or R for data science in 2026? Compare ecosystems, statistics, visualization, jobs, and deployment with survey data, and learn which fits your goals.
Why data cleaning takes 80% of a data scientist's time: common issues, pandas workflows, automation tips, and how to clean datasets efficiently in Python.

A/B testing statistics explained: hypotheses, sample size, p-values, power, confidence intervals, and the seven mistakes that invalidate experiments.

Handle missing data in ML datasets: deletion, mean/median imputation, forward fill, KNN imputation. When to use each method with Python code examples.
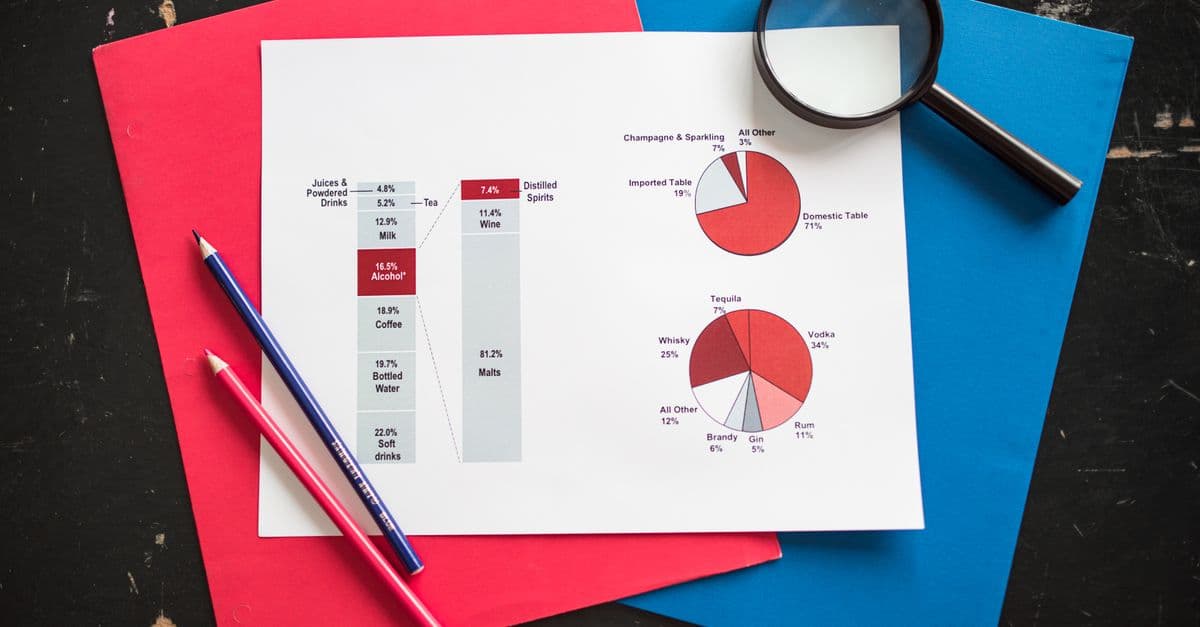
Data visualization tools compared: Matplotlib, seaborn, Plotly, Tableau, Power BI, and Looker Studio, with code, pricing, trade-offs, and how to choose.
Learn the SQL data scientists use daily: SELECT, JOINs, GROUP BY, window functions, CTEs, and date handling, with PostgreSQL examples and common pitfalls.
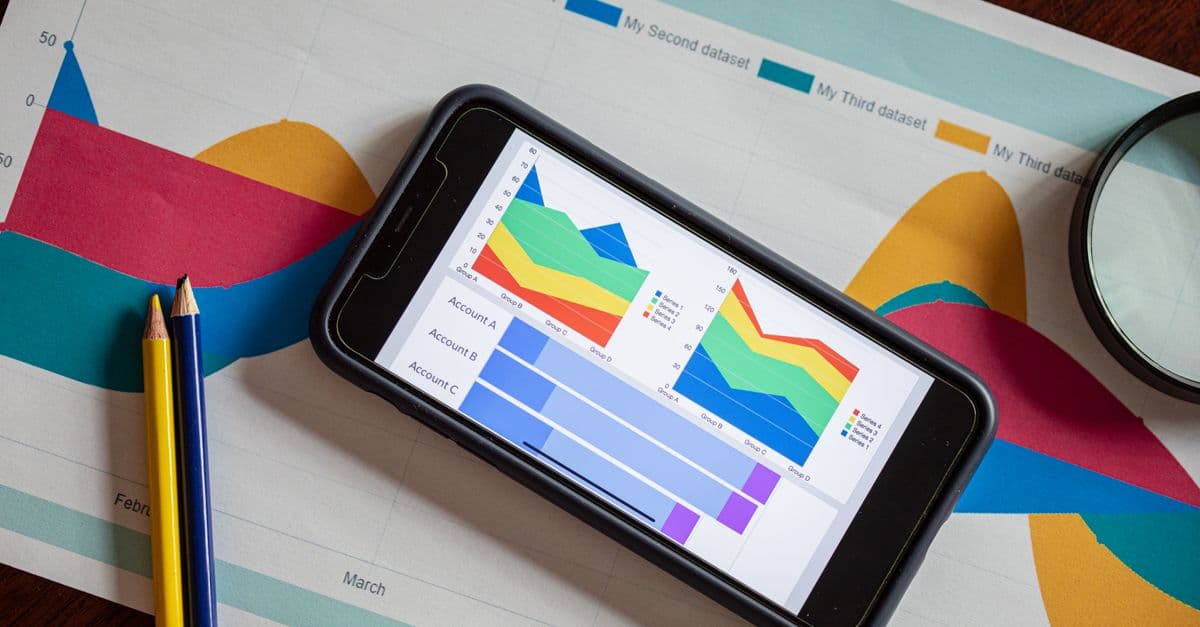
Which data science tools people actually use in 2026, from Python, SQL and pandas to Jupyter and PyTorch, compared with survey data and official documentation.