Countries with the Biggest Trade Surpluses (2025 Ranked)
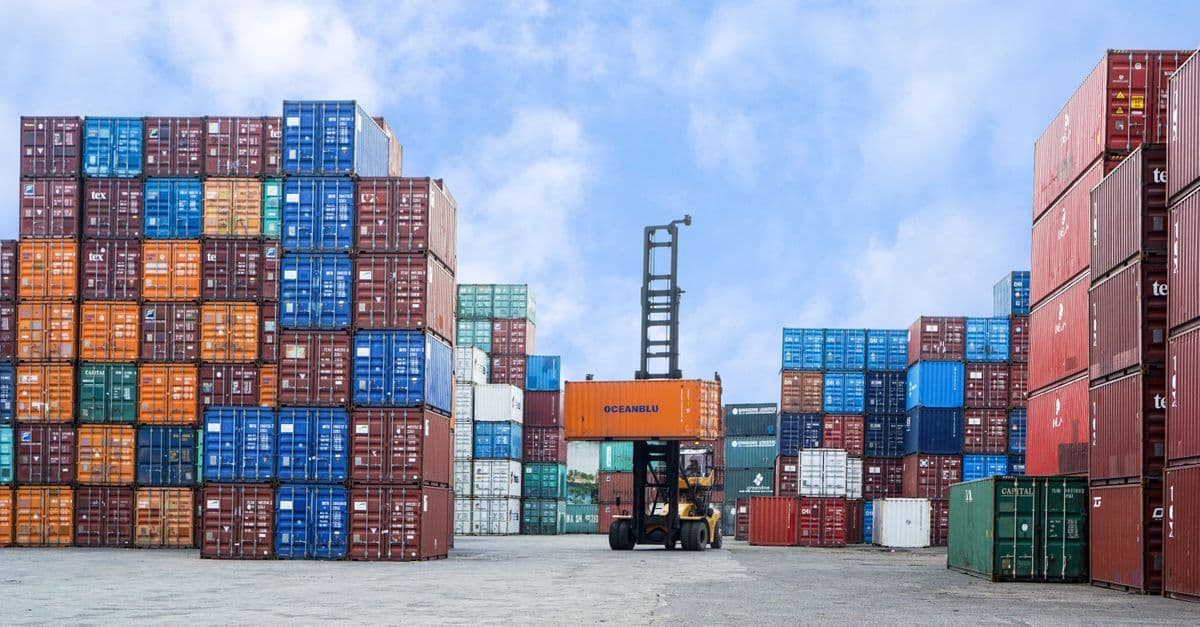
Photo: Aan Amrin / Pexels
A trade surplus occurs when a country exports more than it imports — a positive current account balance. A trade deficit is the reverse. The WTO, IMF, and World Bank track these flows; in 2023 global goods trade totalled approximately $23 trillion.
Educational only — not financial advice. Investing involves risk of loss; past performance does not guarantee future results. Consult a licensed financial advisor before making investment decisions.
Trade surpluses and deficits are not inherently good or bad — but extreme imbalances reflect structural features of economies (high savings rates, export-led growth models, currency management) and create geopolitical friction. The US-China trade conflict, US-EU disputes, and recurring currency wars all have their roots in sustained trade imbalances.
Key takeaways
- China ($830 billion surplus in 2022) has the world's largest trade surplus — driven by manufacturing dominance and high domestic savings.
- Germany ($280 billion) runs the largest surplus in Europe — a consistent target of US and IMF criticism for suppressing European demand.
- The United States ($1 trillion deficit) runs the world's largest trade deficit — importing far more than it exports, particularly in goods.
- Oil exporters (Saudi Arabia, Russia, Norway, UAE) run large surpluses when oil prices are high — and deficits when prices fall.
- Trade surpluses aren't always desirable: Germany's chronic surplus reflects weak domestic consumption and underinvestment in public services.
Countries with the largest trade surpluses
(Current account balance, billions USD, IMF 2022-2023)
| Rank | Country | Surplus ($bn) | % of GDP | Main exports |
|---|---|---|---|---|
| 1 | China | 830 | 4.6% | Electronics, machinery, EVs |
| 2 | Germany | 280 | 6.4% | Autos, machinery, chemicals |
| 3 | Russia | 250 | 10.4% | Oil, gas, metals |
| 4 | Saudi Arabia | 180 | 15.2% | Oil |
| 5 | Japan | 150 | 3.1% | Autos, electronics, machinery |
| 6 | Netherlands | 130 | 11.2% | Re-exports, gas, chemicals |
| 7 | Norway | 115 | 25.0% | Oil and gas |
| 8 | Singapore | 90 | 17.0% | Re-exports, electronics |
| 9 | South Korea | 70 | 3.8% | Semiconductors, autos, ships |
| 10 | Switzerland | 75 | 9.0% | Pharma, finance, watches |
| 11 | UAE | 85 | 16.0% | Oil, re-exports |
| 12 | Taiwan | 100 | 13.0% | Semiconductors |
| 15 | Ireland | 80 | 22% | Pharma (transfer pricing) |
| 20 | Vietnam | 15 | 3.5% | Electronics, garments |
| 25 | Australia | 60 | 3.5% | Iron ore, coal, LNG |
Source: IMF Balance of Payments data (2022–2023) and World Customs Organization trade statistics. Figures represent current account balances (goods and services) in USD billions.
Where this data comes from
Trade surplus and deficit statistics are compiled by the International Monetary Fund (IMF), which collects balance-of-payments data from central banks and customs authorities in every country. Trade flow data also comes from the World Customs Organization and the WTO. These agencies track both imports and exports by category and combine them with services (shipping, financial services, tourism), income flows (dividends, interest on loans), and transfers to produce the "current account" (the broadest measure). The difficulty: countries report their data differently, use different methodologies for attributing trade (particularly complex in global supply chains where components cross borders multiple times), and some may underreport informal trade. Additionally, trade measured at the border (export/import statistics) doesn't capture the full picture — a shirt sewn in Vietnam from fabric made in India from cotton grown in the US counts as Vietnamese export when it leaves Vietnam, obscuring the value-added chain. Finally, services are notoriously hard to measure; cross-border digital services, cloud computing, and IP licensing are rapidly growing but often underreported.
The rebalancing challenge: why surpluses persist despite criticism
The persistence of China's $830 billion surplus and Germany's $280 billion surplus despite decades of international criticism reveals a fundamental asymmetry in trade adjustment: surplus countries benefit from the status quo, while deficit countries bear the political cost. China's exports generate employment and foreign exchange; Germany's exports sustain its industrial base and employment. The US deficit is politically visible and contentious, but adjustment requires either China and Germany to consume more (politically difficult, culturally disfavoured in both places) or the US to save more (requiring reduced consumption, politically unpopular in America). The IMF and economists can prescribe rebalancing, but without binding supranational enforcement mechanisms, individual countries pursue self-interest. Tariffs, currency interventions, and trade wars are how this imbalance plays out — not as rational optimization, but as the collision of incompatible preferences. The 2024 rise of trade protectionism suggests that political tolerance for sustained imbalances is declining.
Countries with the largest trade deficits
| Rank | Country | Deficit ($bn) | % of GDP |
|---|---|---|---|
| 1 | United States | −1,000 | −3.7% |
| 2 | India | −90 | −2.5% |
| 3 | United Kingdom | −110 | −3.8% |
| 4 | France | −60 | −2.2% |
| 5 | Turkey | −50 | −4.5% |
| 6 | Brazil | −30 | −1.3% |
| 7 | Canada | −25 | −1.2% |
China: the export machine
China's trade surplus reflects a structural economic model built over 30 years:
The manufacturing foundation: China became the "world's factory" through combining cheap labour (diminishing but still below developed-world levels), enormous infrastructure investment, and a state-directed industrial policy that supported export champions. Everything from iPhones to solar panels to CCTV cameras is manufactured in China at scale.
The EV surge: China's trade surplus reached record highs in 2022–2023 partly due to EV exports — China's BYD, CATL batteries, and related components became major export items. China became the world's largest vehicle exporter in 2023, surpassing Japan.
Currency management: The yuan (renminbi) is managed by the People's Bank of China rather than freely floating. Critics — primarily the US — argue China manages its currency to remain undervalued, making exports artificially cheap. China disputes this.
The savings explanation: China's surplus reflects extremely high household and corporate savings rates (~45% of GDP) — Chinese households save a larger proportion of income than almost any other country. High savings = low domestic consumption relative to production = exports of the surplus.
Germany: Europe's controversial surplus
Germany's persistent trade surplus (~$280 billion) has been a source of tension within the Eurozone and with the US:
The structural cause: Germany's export prowess in premium machinery, luxury autos (BMW, Mercedes, Porsche), chemicals (BASF, Bayer), and industrial equipment reflects genuine competitive advantage built over generations. German companies compete on quality and engineering precision, not price.
The IMF concern: The IMF and Keynesians argue Germany's surplus is the mirror image of Southern European deficits — Germany's high savings rate suppresses European demand, forcing countries like Greece and Italy to borrow to sustain living standards. Germany should consume more and import more to rebalance.
The Eurozone constraint: Germany cannot devalue its currency (it uses the euro) to make exports cheaper or make imports more attractive — a standard adjustment mechanism for surplus countries. The euro, arguably undervalued for the German economy, amplifies Germany's surplus.
The political response: Germany has resisted calls to stimulate domestic consumption through fiscal spending — a political choice tied to German cultural attitudes toward debt (Schulden — debt — shares a root with Schuld — guilt/fault).
The United States: why the deficit persists
The US trade deficit ($1 trillion goods deficit, partially offset by services surplus) has persisted for decades despite multiple attempts to reduce it:
The reserve currency effect: The US dollar is the world's reserve currency — other countries need to accumulate dollar assets. This creates structural demand for dollars that maintains the dollar's value above what would otherwise equilibrate the current account.
Consumption culture: American households save 5–10% of income vs. Chinese households at 30–40%. Higher consumption means more imports.
Comparative advantage: The US has shifted toward high-value services (finance, software, consulting, IP licensing) — all trade surplus items. US goods deficit coexists with services surplus. Total current account deficit is smaller than goods deficit alone.
The Trump tariffs: The 2018–2019 tariffs on Chinese goods ($360 billion of imports) reduced the US-China bilateral trade deficit modestly — but total US deficit didn't fall much, as Chinese goods simply arrived via Vietnam, Mexico, or other routes.
Frequently asked questions
Is a trade deficit bad?
Not necessarily. The US runs the world's largest trade deficit and the world's largest economy simultaneously. Trade deficits mean consumers are importing more goods at lower prices than they produce domestically — a consumption benefit. Trade deficits must be financed (by borrowing or selling assets to foreigners), which can create long-term vulnerabilities. The key question is whether the deficit finances consumption (potentially problematic long-term) or productive investment (less concerning).
What is the relationship between trade and jobs?
Trade creates winners and losers within countries. The overall economic effect of trade is positive (Ricardian comparative advantage), but specific industries and workers lose jobs when competing imports arrive. The US manufacturing job losses associated with China trade (estimated 2–2.4 million jobs, Autor et al.) were real and concentrated in specific communities, even as overall US consumption benefited. The political backlash against globalisation that produced Brexit, Trump, and European populism reflects these concentrated losses.
What is "reshoring" and is it happening?
Reshoring is the trend of moving manufacturing back to the home country after decades of offshoring. The US Inflation Reduction Act and CHIPS Act are providing $400+ billion in incentives for semiconductor and clean energy manufacturing to return to the US. Europe is similarly incentivising strategic manufacturing reshoring. The trend is real but limited — basic manufactured goods are unlikely to return to wealthy-country production given wage differentials.
The bottom line
Trade surpluses and deficits are not moral categories — they reflect structural features of economies: savings rates, currency regimes, comparative advantages, and domestic consumption patterns. China's $830 billion surplus is the product of 30 years of deliberate export-oriented industrialisation. Germany's surplus is the product of engineering excellence and a cultural preference for saving. The US deficit is the product of consuming more than it saves, in a world that wants to hold dollar assets. The political tensions these imbalances generate are real — tariffs, currency accusations, and trade wars — but the structural forces driving them are deeply embedded. Rebalancing global trade will require China and Germany to consume more and save less; and the US to save more and consume less — a slow adjustment that market forces and policy are gradually producing.
Related Reading
Follow new articles
Add SciHub101 to your feed reader to see new science and technology stories.
About the Author
SciHub101 is an independent science and technology publication founded and edited by Buğra Sözeri, a software engineer and app developer based in Türkiye. AI tools assist with drafting and research. Source documentation in the existing archive is uneven, and articles are being reviewed and corrected. The Editorial Team byline identifies editorial responsibility; it does not certify specialist or independent human review. Where we compare products, anything built by our own team is labelled as such — see the editorial guidelines and About page for how corrections and disclosures work.
Related Articles

Why the World Is Deglobalising and What It Means for Everyone
For 30 years, the world got more connected. Trade barriers fell, supply chains stretched across continents, and goods flowed freely. Now the trend is reversing. Tariffs are rising, supply chains are being reshored, and geopolitical blocs are forming. Here's why deglobalisation is happening and what it means for prices, jobs, and geopolitics.

Countries with the Most Coffee Exports (2025 Ranked)
Brazil ships the most coffee by volume and value. Switzerland and Germany rank high because they re-export processed coffee, and Colombia and Ethiopia earn more per tonne than the volume leaders. Here is how the ranking works and who keeps the money.

Complete Finance Guide 2026 — How Money Really Works
The complete guide to finance in 2026: how money, inflation, and central banks work, investing fundamentals, markets, cryptocurrency, and personal finance explained.

Why Housing Is So Expensive
Housing prices rise when land, zoning, interest rates, construction costs, income, speculation, and supply constraints collide.

Why Interest Rates Affect Everything
Interest rates influence mortgages, stocks, currencies, hiring, inflation, government debt, and startup funding. This guide explains the transmission mechanism.

How Inflation Works — and Why It's So Hard to Stop
Inflation is hard to stop because it feeds itself: rising prices push workers to demand higher wages, which push prices higher still. Here's the full mechanism — the wage-price spiral, self-fulfilling expectations, and why central bank tools work with long and variable lags.