Countries with the Most Coffee Exports (2025 Ranked)
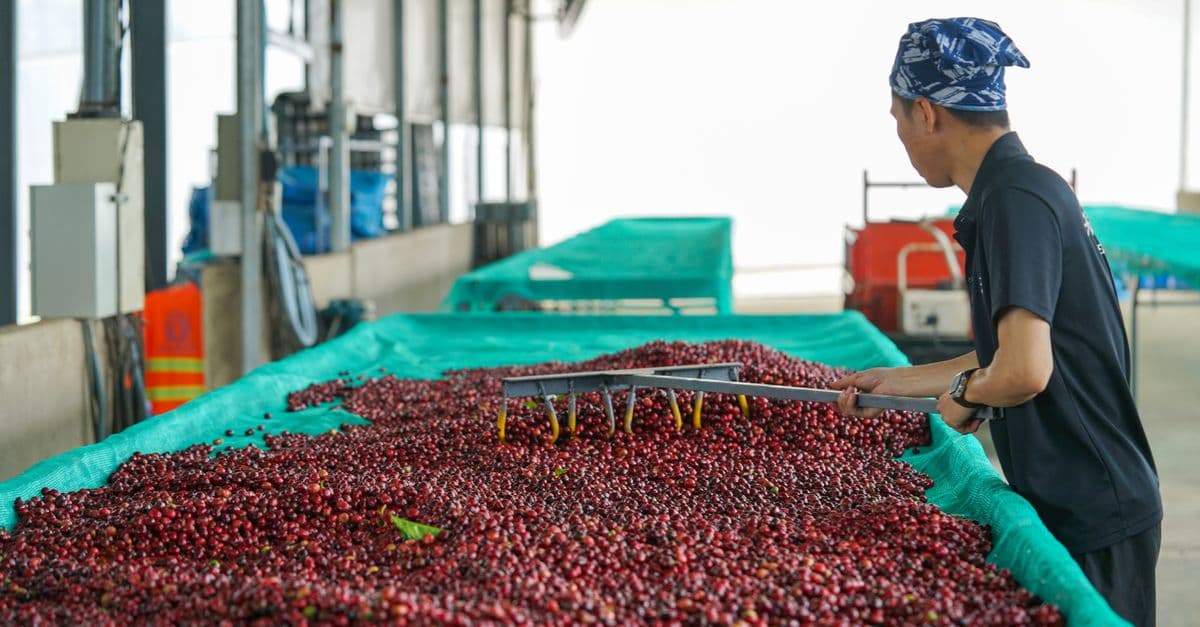
Photo: 1500m Coffee / Pexels
Brazil exported about $7.35 billion of coffee in 2023, according to International Trade Centre (ITC) figures, and shipped roughly 41.4 million 60-kg bags in the International Coffee Organization's (ICO) March 2023 to February 2024 year. No other country is close on volume. Yet the second, third, and fourth places by value go to Switzerland, Germany, and Vietnam, and two of those three grow no coffee at all. This ranking explains why, and what the numbers do and do not measure.
Educational only — not financial advice. Investing involves risk of loss; past performance does not guarantee future results. Consult a licensed financial advisor before making investment decisions.
Coffee is a useful test case for how trade statistics mislead. A country can top a table because it grows more, because it roasts more, or because it simply owns the port where beans change hands. Reading the ranking correctly means knowing which of the three is happening.
For raw agricultural output, see Countries with the Most Coffee Production. For who drinks it, see Coffee Consumption by Country.
Key takeaways
- Brazil leads on both measures: $7.35 billion in 2023 coffee exports (ITC) and 41.4 million bags in the ICO year ending February 2024.
- Vietnam is second by volume with 28.6 million bags, almost all of it robusta, but earns less per tonne than most rivals.
- Switzerland and Germany rank second and third by value because their exports are largely processed coffee made from imported beans.
- Colombia and Ethiopia earn more per tonne than Brazil or Vietnam, which points to quality, origin branding, and processing as the difference.
- Growers keep a minority of the export price: one 2023 study cited by Wikipedia's coffee production entry puts it at under 60 percent of the free-on-board (FOB) price.
Countries with the highest coffee exports
Two organizations publish the numbers most often used in rankings, and they do not agree. The ICO counts exports of green (unroasted) coffee, plus re-exports, in 60-kg bags. The ITC's Trade Map counts the gross dollar value of coffee exports in calendar-year terms. The table below shows both, side by side, for the leading exporters. Rows are ordered by ITC value.
| Rank by value | Country | ITC export value, 2023 ($ million) | ITC volume, 2023 (tonnes) | ICO exports, Mar 2023 to Feb 2024 (60-kg bags) |
|---|---|---|---|---|
| 1 | Brazil | 7,351 | 2,121,038 | 41,375,604 |
| 2 | Switzerland | 3,644 | 102,682 | 2,151,167 |
| 3 | Germany | 3,408 | 551,915 | 12,610,463 |
| 4 | Vietnam | 3,382 | 1,301,803 | 28,600,300 |
| 5 | Colombia | 2,915 | 591,665 | 10,897,760 |
| 6 | Italy | 2,586 | 304,821 | 6,072,027 |
| 7 | Honduras | 1,488 | 343,208 | 5,182,124 |
| 8 | Belgium | 1,320 | 256,520 | 4,641,582 |
| 9 | France | 1,271 | 61,086 | 1,817,463 |
| 10 | Ethiopia | 1,225 | 236,076 | 3,588,531 |
| 11 | Netherlands | 1,200 | 170,510 | 4,630,093 |
| 12 | United States | 1,193 | 145,590 | 3,177,808 |
| 13 | Uganda | 955 | 370,486 | 6,057,793 |
| 14 | Guatemala | 949 | 182,384 | 3,096,888 |
| 15 | Indonesia | 929 | 279,996 | 6,200,363 |
Sources: ITC Trade Map (calendar 2023, coffee product exports) and ICO export data (March 2023 to February 2024, including re-exports), as compiled in Wikipedia's "List of countries by agricultural exports," accessed October 2026. The ICO figure for Switzerland and the ITC figure for the same country differ because the two sources define exports and measure weight differently.
Two things stand out. First, the dollar ranking and the bag ranking tell different stories. Uganda ships more bags than Switzerland yet earns about a quarter of the money. Second, the list contains several countries that appear to have no coffee farms: Switzerland, Germany, Belgium, Italy, and the Netherlands are all in the top dozen.
Lower down the ITC list, several producers fall just outside this table: Peru ($829 million), India ($747 million), Nicaragua ($609 million), Mexico ($434 million), Costa Rica ($351 million), and Kenya ($261 million).
What the ranking actually measures
Trade data looks objective, and it is, but only inside its own definitions. Four of them matter here.
Green versus processed. The ICO tracks green coffee, the dried seed before roasting. The ITC tracks coffee products as customs agencies classify them, which includes roasted beans and other forms. A roasted, packaged product is worth far more per tonne than a sack of green beans, so countries that process coffee look richer in value terms than their raw volumes suggest.
Re-exports. If a Swiss company imports Brazilian beans, roasts them, and ships capsules to 80 countries, the capsules count as Swiss exports. The ICO explicitly includes re-exports in its figures. The beans were grown once, but they appear twice in global trade statistics: once as Brazilian exports and again as Swiss ones.
Value at the border. Export values are normally recorded free on board (FOB), meaning the price at the port of departure, before shipping and insurance. They capture the exporter's revenue, not what a consumer pays for a latte. The gap between those two numbers is where most of the money in coffee is made, and we return to it below.
Different calendars. Coffee marketing years do not match calendar years. The ICO's comparison here runs from March 2023 to February 2024, while the ITC figures are for calendar 2023. A harvest that ships late can land in different years in each dataset, so the two columns should be compared for pattern, not to the last digit.
The comparison to oil is useful. Crude oil is mostly traded in a similar form to how it leaves the ground, so a ranking of oil exports tracks production closely (Countries That Export the Most Oil shows how even that has wrinkles). Coffee is different because the product changes form between the farm and the customs desk, and the value changes with it.
Brazil: the volume giant
Brazil's lead is a story of scale. According to the FAO data summarized in Wikipedia's coffee entry, Brazil produced about 3.41 million tonnes of green coffee in 2023, around 31 percent of a world total near 11 million tonnes. Its 2023 exports of about 2.12 million tonnes (ITC) show how much of that crop leaves the country.
Brazil grows both main species. Arabica (Coffea arabica) accounts for roughly three-quarters of world coffee overall, and Brazil is the leading producer. Robusta (Coffea canephora), the hardier species used in many instant and espresso blends, is also grown in Brazil, although Vietnam is the leading robusta producer, according to Wikipedia's coffee production entry. Having both species means Brazilian exporters can sell to quality-focused roasters and to price-focused blenders from the same ports.
The ITC numbers imply an average export price of roughly $3,466 per tonne, which works out to about $208 per 60-kg bag. That is lower than Colombia and Ethiopia, and it reflects Brazil's mix: a large share of commodity-grade coffee, with specialty lots on top.
Exposure to price swings is the cost of being the volume leader. Because Brazil is so large, its harvest outcomes influence world prices, and world prices in turn decide Brazil's export revenue. A frost, a drought, or a bumper crop shows up in the national trade balance. Exchange rates add another layer. Coffee is priced in dollars, but farmers pay their costs in reais, so a weaker currency can raise local margins even when the dollar price is flat. The mechanics are covered in Why Currency Exchange Rates Change.
Vietnam: the robusta machine
Vietnam ranks second in the world for production, behind Brazil, with about 1.96 million tonnes of green coffee in 2023 (FAO figures cited by Wikipedia). In the ICO's year it exported 28.6 million bags, and in the ITC's 2023 data about 1.30 million tonnes worth $3,382 million.
The difference between Brazil and Vietnam shows up in price. Vietnam's ITC average works out to about $2,598 per tonne, around $156 per 60-kg bag. That is roughly three-quarters of Brazil's average and about half of Colombia's. The reason is the species. Robusta is more bitter, has less flavor complexity, and contains roughly 40 to 50 percent more caffeine than arabica, according to the coffee entry. It also tolerates warmer, lower-altitude land and resists disease better, which cuts the cost of growing it.
In practical terms, Vietnam supplies the cheaper end of the market: the instant coffee industry, mass-market blends, and the body-and-crema component of some espresso. A roaster who wants to lower a blend's cost without losing caffeine punch will often reach for robusta. That is why Vietnam can be second in volume and fourth in value, and why its coffee earns little per tonne compared with a washed arabica from the Andes.
Robusta's disease resistance has a history. The Wikipedia coffee entry notes that coffee leaf rust, caused by the fungus Hemileia vastatrix, is found in virtually all coffee-producing countries and has pushed growers in many places toward resistant robusta. In that sense, disease helped create the market Vietnam now serves.
Switzerland, Germany, Italy, and Belgium: the re-exporters
The most surprising row in the table is Switzerland. It has no coffee plantations, yet the ITC puts its 2023 coffee exports at $3,644 million, the second highest in the world. The tonnage tells you what is going on: about 102,682 tonnes, a small fraction of Brazil's. The money per tonne is enormous.
Dividing the ITC figures gives an average of about $35,500 per tonne for Switzerland, roughly ten times Brazil's. A tonne of green beans cannot be worth that much. A tonne of single-serve capsules and branded roasted coffee can. The Swiss figure measures the value of roasting, portioning, packaging, branding, and logistics, built on imported beans. Nestlé's Nespresso and Nescafé are the best-known Swiss coffee businesses, though the ITC data does not break results out by company.
Germany shows a similar pattern with lower margins. It exported about 551,915 tonnes worth $3,408 million, about $6,175 per tonne. That is about 1.8 times Brazil's average, consistent with a country that imports green coffee, roasts it, and sells it onward. Italy exported about 304,821 tonnes at $2,586 million, an average near $8,484 per tonne, a figure that fits the country's espresso brands. Belgium and the Netherlands, both major trading and port economies, ship coffee on a scale that reflects their role as European distribution hubs.
| Country | Average export price, 2023 ($ per tonne) | Rough price per 60-kg bag ($) |
|---|---|---|
| Switzerland | 35,488 | 2,129 |
| Italy | 8,484 | 509 |
| United States | 8,194 | 492 |
| Germany | 6,175 | 371 |
| Guatemala | 5,203 | 312 |
| Ethiopia | 5,189 | 311 |
| Kenya | 5,128 | 308 |
| Colombia | 4,927 | 296 |
| Honduras | 4,335 | 260 |
| Peru | 4,048 | 243 |
| Brazil | 3,466 | 208 |
| Indonesia | 3,318 | 199 |
| India | 3,201 | 192 |
| Vietnam | 2,598 | 156 |
| Uganda | 2,578 | 155 |
Calculated by SciHub101 from ITC 2023 export values and tonnages as compiled in Wikipedia's "List of countries by agricultural exports." Per-bag figures multiply the per-tonne price by 0.06 and are rounded. Because ITC values include processed products for some countries, these are averages of mixed products, not green-coffee prices.
This table is the most honest way to read the ranking. The countries at the top are not selling the same thing as the countries at the bottom. A producer-country price near $2,600 to $3,500 per tonne is mostly raw material. A re-exporter's price above $6,000 per tonne is raw material plus manufacturing and brand.
Two caveats apply. The average per tonne mixes green coffee with processed products in the same country, and the processed share varies by country. And the ITC and ICO tonnages for a single country do not match, which shows that "average price" can be sensitive to which dataset you divide by. Use the table to compare orders of magnitude, not to quote a precise price.
The United States appears in this list too, which surprises many readers. Wikipedia's summary of the ICO data describes it as the only major re-exporter that also produces a significant amount of coffee itself, on the mainland and in Puerto Rico. Its exports, about $1,193 million in 2023, are mostly imported coffee processed domestically.
Colombia: the premium model
Colombia exported about 591,665 tonnes worth $2,915 million in 2023 (ITC), an average near $4,927 per tonne. That is about 42 percent above Brazil's average and almost double Vietnam's. In the ICO year it shipped 10.9 million bags.
Colombia has one of the world's best-known national coffee brands, and it was built deliberately. The character Juan Valdez was created in 1958 by the advertising agency Doyle Dane Bernbach for the National Federation of Coffee Growers of Colombia (FNC), according to Wikipedia's article on the character. The aim was to promote coffee in the United States and to distinguish 100 percent Colombian coffee from blends containing beans from other countries. The FNC is described as owned and controlled by Colombia's coffee farmers, who number over 500,000.
The name was registered with the US Patent and Trademark Office in 1960, and the same article describes Juan Valdez as an "ingredient brand," a mark that tells consumers a product contains only Colombian beans. The company behind it later opened a chain of cafes: 238 shops in 2013, and reportedly about 500 by 2022.
Branding explains only part of the premium. Colombia produced about 0.68 million tonnes in 2023, and Colombian coffee is widely associated with washed arabica, a processing method that removes the fruit before drying and tends to yield clean, bright flavors. A trading house buying Colombian coffee is buying consistency as much as taste, and consistency is something buyers will pay for.
The Colombian case has a limit. The FNC model works because the federation represents a large share of national output and can set standards across thousands of smallholders. That kind of collective structure is rare in other producing countries, which is one reason the model has been hard to copy.
Ethiopia: coffee's birthplace and a pricing puzzle
Ethiopia is where arabica originated, and coffee remains central to its economy. The Wikipedia entry on Ethiopian coffee production says coffee export revenues make up about 10 percent of annual government revenue, that the European Union takes about half of exports and East Asia about a quarter, and that between four and six million farmers are engaged in production, depending on which figure in the article you use.
The ITC puts Ethiopia's 2023 coffee exports at $1,225 million on 236,076 tonnes, about $5,189 per tonne. That is higher than Brazil's average and in line with Guatemala and Kenya. The ICO year shows 3.59 million bags exported. Ethiopia's own later reporting, as summarized by Wikipedia, puts 2024/25 exports at about 7.43 million bags and around $2.89 billion, a much higher figure. The jump is too large to explain by a single year of growth alone, and it illustrates how different reporting systems and marketing years can give different answers for the same country. Treat the 2024/25 figure as a separate, later data point with its own source, not as a continuation of the ICO series.
The Starbucks trademark dispute
Ethiopia is also the origin of a well-known fight over who profits from coffee names. According to the Wikipedia entry, Oxfam accused Starbucks on October 26, 2006 of asking the US National Coffee Association to oppose an Ethiopian trademark application for Sidamo, Harar, and Yirgacheffe. On June 20, 2007, Ethiopia and Starbucks signed an agreement on distribution, marketing, and licensing that recognized Ethiopia's specialty coffee designations. Financial terms were not disclosed.
The episode matters beyond Ethiopia. It showed that a place name, like Champagne for sparkling wine, can be an asset, and that a country can try to own it. Whether that asset translates into higher farmgate prices is a separate and harder question.
Central America, East Africa, and the long tail
Behind the leaders sit mid-sized exporters with distinct profiles. Honduras exported about 343,208 tonnes worth $1,488 million in 2023 (ITC), an average near $4,335 per tonne, and sits seventh by value. Guatemala earned $949 million on 182,384 tonnes, an average above $5,200, which is among the highest of the producing countries in the table. Peru ($829 million) and Nicaragua ($609 million) follow.
In East Africa, Uganda sells a large volume of robusta: 6.06 million bags in the ICO year, 370,486 tonnes in ITC terms, for $955 million. That is a low average price, about $2,578 per tonne, and close to Vietnam's, which fits the shared species. Kenya sits at the other end. It exported 804,778 bags in the ICO year, a small volume, but earned about $5,128 per tonne on a total of $261 million. Kenya's pattern is the specialty producer's: little volume, relatively high price.
India and Indonesia, both large producers, export modestly because they consume or process a share at home and because their crops include robusta. They earned $747 million and $929 million respectively. These rankings reward the countries with the most coffee to sell abroad, not those with the most coffee grown.
Who keeps the money
Export statistics measure the first sale. What happens after is the bigger economic story.
Wikipedia's entry on coffee production cites Ruben (2023) for the finding that less than 60 percent of the FOB export price reaches the grower. The remainder covers in-country transport, warehousing, and wet and dry milling. That is only the share of the export price. The export price itself is a fraction of what a consumer pays in a cafe or supermarket in a consuming country.
A cup of coffee is a bundle of costs: the bean, the roasting, the packaging, the transport, the rent on the cafe, the barista's wages, and the brand. The bean is a small part of it. This is why Switzerland, with no farms, can out-earn Vietnam, which produced nearly two million tonnes in 2023. Capturing value in coffee has more to do with where processing and branding happen than with where the plants grow.
It also explains the push by producing countries to add value at home. A country that exports roasted, packaged coffee instead of green beans keeps a larger share of the margin. The obstacles are real: roasted coffee goes stale faster than green, import tariffs in rich countries are often higher on processed goods than on raw materials, and big roasters have established brands and distribution. The ITC data shows that some producers do manage it, but the largest processed-coffee exporters are still countries that import their beans.
For a broader look at how value is distributed in global food supply chains, Countries with the Most Food Waste shows how much of the same agricultural output never reaches a consumer at all.
Why prices swing, and what the benchmark is
Green coffee is traded as an agricultural commodity. Arabica is priced against a futures contract on ICE Futures US, commonly called the "C" price, with physical coffee sold at a premium or discount to it depending on quality and origin. Robusta has its own futures market in London. These benchmarks move with weather forecasts, stock levels, currency rates, and fund positioning.
A premium to the benchmark is how origin branding shows up in money. Colombian washed arabica and top Kenyan lots trade above the benchmark, while lower-grade coffee trades below it. The ITC per-tonne averages in the table above are consistent with this: origins known for quality sit higher, and robusta producers sit lower.
Price swings matter most to the countries most dependent on coffee. In Ethiopia, coffee provides about a tenth of government revenue by the Wikipedia estimate, so a bad price year is a fiscal issue as well as a farm one. In Brazil, the economy is diversified enough that coffee is a large agricultural line but not a macroeconomic risk. This difference between exposure and dependence is useful when reading any commodity ranking: the top exporter by value is not necessarily the country that depends on the product the most.
The specialty tier
A smaller part of the market competes on quality rather than price. The Specialty Coffee Association scores coffees out of 100 on a cupping form, and coffees scoring 80 points or above are commonly classed as specialty, though the exact definition varies by buyer. Specialty lots are sold with traceable origin, often to the farm level, and priced directly with roasters rather than at the benchmark.
This tier explains some of the higher per-tonne averages in smaller exporters such as Kenya and Guatemala, though the ITC data does not split specialty from commodity, so the connection is an inference, not a measurement. Specialty also remains a minority of volume. The countries at the top of the volume ranking still earn most of their money from standard grades.
For readers interested in the product itself, the same logic of scarcity and quality drives prices in other luxury crops, as in Why Vanilla Is So Expensive.
Climate and disease: the risk to the ranking
Coffee grows within a narrow range of temperature, rainfall, and altitude, which makes exporting countries exposed to climate change. The Wikipedia coffee entry notes that climate change may significantly affect yields this century and that Nicaragua and Ethiopia could lose more than half of their land suitable for arabica.
Leaf rust adds to the pressure. The fungus Hemileia vastatrix is found in virtually all coffee-producing countries. It pushed producers toward robusta in the past, and it remains a reason breeders work on resistant varieties.
A change in suitability would reorder the ranking over time. Higher-altitude land in some countries could become viable while lower land in others loses its suitability. Robusta, which tolerates heat better than arabica, could gain share. None of this is certain in timing or size, and anyone quoting a specific year when an origin becomes unviable is projecting beyond what the sources support. For the underlying science of warming, see Climate Change Explained.
How to read any coffee ranking
Four habits help.
- Ask what is counted. Green coffee, roasted coffee, and re-exports produce very different tables.
- Check the year and the calendar. Marketing years and calendar years diverge, and a single bad harvest can move a country several places.
- Divide value by volume. A high price per tonne with low volume usually signals processing, a specialty focus, or both.
- Separate growing from trading. The top of the value table includes countries that add value rather than grow crops.
Frequently Asked Questions
Q: Which country exports the most coffee? A: Brazil. ITC data puts its 2023 coffee exports at about $7.35 billion on 2.12 million tonnes, and the ICO recorded about 41.4 million 60-kg bags exported in the March 2023 to February 2024 year. It is first on both measures, well ahead of Vietnam in volume and of Switzerland in value.
Q: Why is Switzerland a top coffee exporter if it does not grow coffee? A: Switzerland imports green coffee, processes it, and re-exports the finished products. The ITC puts its 2023 coffee exports at $3,644 million on only about 102,682 tonnes, an average near $35,500 per tonne. That price reflects roasting, packaging, and branding, not raw beans.
Q: Why does Vietnam export so much coffee but earn less per tonne? A: Vietnam grows mostly robusta, which sells for less than arabica. Its 2023 ITC average works out to about $2,598 per tonne, compared with about $3,466 for Brazil and about $4,927 for Colombia. Robusta is more bitter and less complex in flavor, but it is cheaper to grow, tolerates warmer, lower land, and resists disease better.
Q: Why do the ICO and ITC numbers differ? A: They measure different things. The ICO counts green coffee exports and re-exports in 60-kg bags over a March to February year. The ITC counts the gross dollar value of coffee exports over the calendar year, including processed products. Differences in sources, periods, and product weights mean the two series should be read for pattern, not matched exactly.
Q: How much of the export price do coffee farmers receive? A: A 2023 study by Ruben, cited in Wikipedia's coffee production entry, found that less than 60 percent of the FOB export price reaches the grower. The rest covers in-country transport, warehousing, and milling. That is a share of the export price, not of what consumers pay at retail, which is considerably higher.
Q: What was the Ethiopia and Starbucks trademark dispute? A: In October 2006, Oxfam accused Starbucks of asking the US National Coffee Association to block an Ethiopian trademark application for Sidamo, Harar, and Yirgacheffe. In June 2007, Ethiopia and Starbucks signed an agreement on distribution, marketing, and licensing that recognized Ethiopia's specialty coffee names. Financial terms were not disclosed.
The takeaway
The coffee export ranking looks like a list of farming powers, and the top of it is. Brazil is first by volume and by value, and Vietnam is second by volume. But the rest of the table is a map of who captures value, and that is not always the country with the plantations. Switzerland and Germany sit near the top because they roast, package, and brand imported beans, and the per-tonne arithmetic shows how large that premium is.
For growers, the numbers carry a quieter message. Even at the export stage, the farmer's share is under 60 percent of the FOB price, and the export price is only a fraction of the retail one. The countries that have done better, Colombia with a national brand and Ethiopia with its attempt to own place names, show that organization and marketing can raise what the same plant earns. They also show how hard that is to scale.
Related Reading
- Countries with the Most Agricultural Land
- Countries with the Most Natural Resources
- How Much Caffeine Is Too Much?
Sources
- List of countries by agricultural exports (Wikipedia), compiling ICO export data for March 2023 to February 2024 and ITC Trade Map data for calendar 2023
- Coffee (Wikipedia), citing FAO 2023 production data, arabica share, and robusta caffeine content
- Coffee production (Wikipedia), citing Ruben (2023) on the share of FOB export price reaching growers, and Vietnam's lead in robusta
- Coffee production in Ethiopia (Wikipedia), on exports, government revenue share, and the Starbucks dispute
- Juan Valdez (Wikipedia), on the FNC campaign created in 1958
- International Coffee Organization, Coffee Market Report
Follow new articles
Add SciHub101 to your feed reader to see new science and technology stories.
About the Author
SciHub101 is an independent science and technology publication founded and edited by Buğra Sözeri, a software engineer and app developer based in Türkiye. AI tools assist with drafting and research. Source documentation in the existing archive is uneven, and articles are being reviewed and corrected. The Editorial Team byline identifies editorial responsibility; it does not certify specialist or independent human review. Where we compare products, anything built by our own team is labelled as such — see the editorial guidelines and About page for how corrections and disclosures work.
Related Articles

Countries With the Highest Household Debt: How to Read the Risk
High household debt is not a complete risk ranking. This guide explains debt-to-income, debt-to-GDP, debt-service ratios, mortgage structure, household balance sheets and why the distribution of borrowing matters.
Countries with the Most Economic Freedom (2026 Ranked)
Singapore tops the Heritage Foundation's 2026 Index of Economic Freedom at 84.4, ahead of Switzerland and Ireland. This ranking covers 176 countries, explains how two rival indexes are built, and shows what the scores do and do not predict.
Countries with the Most Coffee Production (2025 Ranked)
Brazil produces nearly 40% of the world's coffee — more than the next three countries combined. Vietnam is the world's top Robusta producer. Ethiopia is coffee's birthplace. Global coffee production is worth $50 billion at origin but $460 billion at retail — the biggest markup in agriculture. Here's the full coffee production ranking.

Why Gold Is Valuable
Gold is valuable because of scarcity, durability, beauty, monetary history, central-bank demand, and its role as a trust asset.
Complete Finance Guide 2026 — How Money Really Works
The complete guide to finance in 2026: how money, inflation, and central banks work, investing fundamentals, markets, cryptocurrency, and personal finance explained.

Why Housing Is So Expensive
Housing prices rise when land, zoning, interest rates, construction costs, income, speculation, and supply constraints collide.