Wealth Inequality: Causes, Data, and What the Numbers Mean
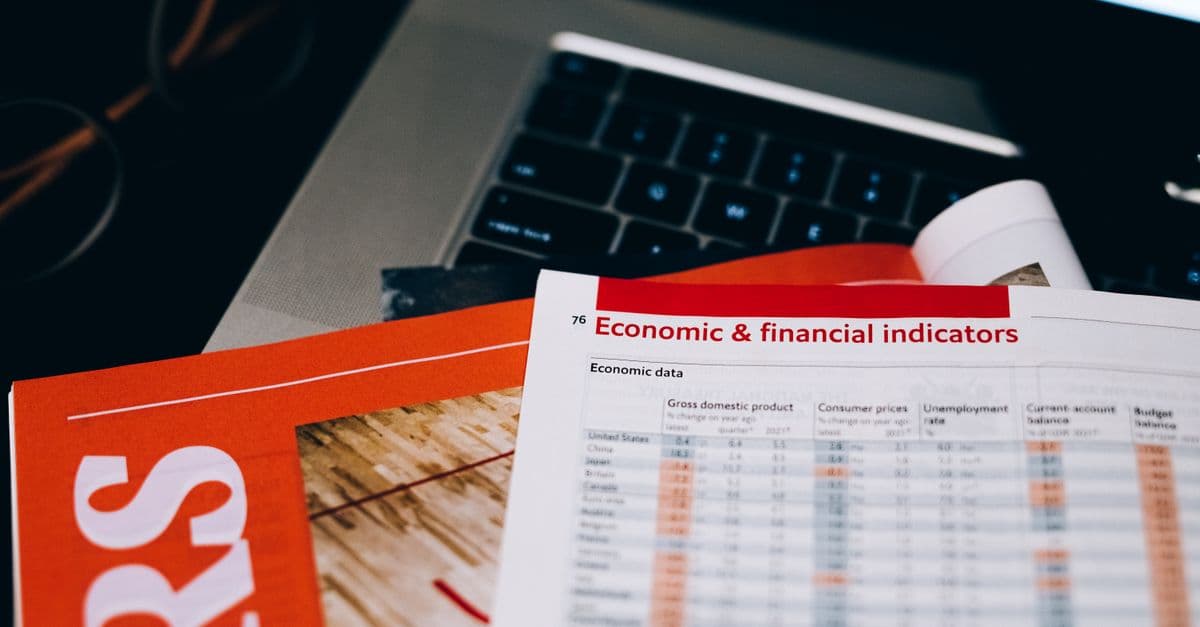
Photo: Leeloo The First / Pexels
If you stacked the wealth of the bottom 50% of Americans, you'd reach a number around $3 trillion. The wealth of Elon Musk alone, at its peak, has approached $400 billion. These numbers are true. They're also, in a precise sense, almost impossible to comprehend — human brains aren't built for scale at this magnitude.
Educational only — not financial advice. Investing involves risk of loss; past performance does not guarantee future results. Consult a licensed financial advisor before making investment decisions.
The more productive question is not "how unequal is wealth?" (the answer: very) but rather "what forces produce this distribution, what are its consequences, and what does economics say about it?" Those questions have answers that are less politically charged than the debate often suggests.
Key takeaways
- Wealth inequality is far more extreme than income inequality because wealth compounds over time, is partly inherited, and returns to capital have outpaced wage growth
- The Gini coefficient and wealth share data both show inequality rising significantly in most developed economies since the 1980s
- Thomas Piketty's r > g framework argues capital returns exceeding growth rates structurally concentrate wealth over time
- Policy debates centre on wealth taxes, inheritance taxes, capital gains treatment, and the generational accumulation of advantage
Measuring wealth inequality: the tools
Economists use several tools to measure and describe wealth distribution.
The Gini coefficient measures inequality on a scale from 0 (everyone has identical wealth) to 1 (one person has everything). Income Gini coefficients in developed economies typically range from 0.25 (Scandinavian countries) to 0.40 (U.S.). Wealth Gini coefficients are much higher — typically 0.65–0.85 — because wealth is more concentrated than income.
Wealth share data is more intuitive. In the U.S., the top 1% own approximately 32% of all household wealth. The top 10% own about 67%. The bottom 50% own roughly 3%. This distribution has become significantly more concentrated since 1980: in 1978, the bottom 90% owned 33% of wealth; by 2020, that share had fallen to about 26%.
Distributional National Accounts (DINA), a methodology developed by economists including Emmanuel Saez and Gabriel Zucman, tries to allocate all national income and wealth to individuals — including corporate retained earnings and government spending benefits — to get a more complete picture. By their measures, the top 1% captures about 20% of pre-tax income in the U.S., up from 11% in 1980.
The causes: why wealth concentrates
Capital vs. labour returns: Wealth grows when it generates returns — interest, dividends, capital gains, rental income. If those returns consistently exceed economic growth, wealth owners' share of the economy rises automatically, even without any additional saving. The French economist Thomas Piketty formalised this as the r > g inequality: when the return on capital (r) exceeds the growth rate of the economy (g), inequality tends to rise.
Historically, r has averaged around 5% and g around 2–3% in developed economies. The Great Depression and WWII disrupted this — they destroyed capital, compressed the capital share through taxation and inflation, and created the more equal post-war decades. As those disruptions faded and tax policy shifted in the 1980s, the structural tendency toward concentration resumed.
Compound growth on existing wealth: The same compound interest dynamics that make savings accounts grow also amplify wealth inequality. A person with $10 million invested in diversified assets earning 7% annually gains $700,000 per year without lifting a finger. A person earning $70,000 in wages must spend most of it living. The absolute gap between the two grows every year regardless of what either person does.
Inherited wealth: The intergenerational transmission of advantage is substantial. Studies find that about 50–60% of wealth differences across individuals in the U.S. can be explained by parental wealth. This includes direct inheritance but also the advantages that come with wealthy parents: better schools, larger social networks, seed capital for entrepreneurship, and ability to take risks that others can't afford.
The rise of superstar economics: Technology and globalisation have increased the scale at which exceptional talent can be monetised. A software engineer at a top firm earns multiples of what a comparable engineer earned in 1975, partly because their code now runs on billions of devices rather than serving one organisation. The same dynamic applies to finance, entertainment, and other high-value sectors. This "winner-take-most" pattern concentrates both income and the equity wealth that follows from high incomes.
The data since 1980
The post-1980 rise in inequality in Anglo-American economies is well-documented and closely tied to specific policy shifts. Several concurrent forces drove it:
Tax changes: Top marginal income tax rates in the U.S. fell from 70% in 1980 to 28% by 1988 (Reagan's tax cuts). Capital gains rates were also cut. Tax policy shifted the burden away from capital and high incomes. The inheritance tax ("estate tax") was reduced multiple times, now applying only to estates above $13 million (2024).
Union decline: U.S. private sector union membership fell from 24% in 1973 to about 6% in 2023. Unions had historically compressed wage distributions by negotiating higher wages for lower-paid workers. Their decline correlated with faster-growing executive compensation and slower growth in median wages.
Financial sector growth: The financial sector's share of U.S. corporate profits grew from around 10% in the 1950s to over 30% by 2007. Finance generates highly concentrated compensation. The growth of financial wealth (stocks, bonds, derivatives) disproportionately benefits those who already own financial assets.
Technology concentration: A handful of technology companies — Apple, Microsoft, Amazon, Alphabet, Meta — account for a disproportionate share of U.S. market capitalisation. Their founders and early employees became extraordinarily wealthy very quickly, in a way that didn't have historical precedent.
Consequences: what does inequality actually do to an economy?
This is where the economics becomes genuinely contested. High inequality has several documented effects:
Reduced social mobility: Countries with higher wealth inequality tend to have lower intergenerational social mobility — the correlation between parent and child income is stronger. The U.S., which prides itself on meritocracy, has lower social mobility than Denmark, Germany, or Canada by standard measures.
Political capture: Large wealth concentrations translate into political influence through campaign finance, lobbying, and media ownership. This can result in policy feedback loops where wealthy interests shape rules that further advantage wealth — tax policy being the clearest example.
Demand effects: If income concentrates among those who save a high fraction (the wealthy), aggregate consumption can be constrained. Middle- and lower-income households spend nearly all their income; the wealthy save most of theirs. High inequality may partly explain why the U.S. has struggled with weak demand and required persistently low interest rates since 2008.
Asset Appreciation and the Wealth Snowball: How Capital Multiplies Unequally
One crucial dynamic often underemphasized in inequality discussions: different asset classes appreciate at different rates, and ownership of these assets is concentrated.
Real estate appreciates at 3–4% annually in developed economies. Stock markets historically return 7–10% annually. But crucially, the returns are compounded on a large base. Someone with $1 million in stocks earning 8% gains $80,000 per year. Someone with $50,000 in savings earning 0.5% (current US savings account rates) gains $250 per year. The gap grows every year.
In the 2010s, this dynamic accelerated. Asset prices (especially stocks and real estate in major cities) surged due to low interest rates and quantitative easing. Someone who owned assets made extraordinary returns; someone who worked for wages fell further behind. From 2008–2020, the top 1% gained $2.5 trillion in wealth while the median American's real wealth stagnated.
This is a key mechanism Piketty identified: when asset returns exceed economic growth, wealth concentrates. In the last 15 years, this has been the dominant force, more than tax policy or wage trends.
Source: Federal Reserve, "Survey of Consumer Finances 2022" — wealth by asset class and income level.
Global Inequality: How Different Countries Compare
The US has high inequality, but global patterns vary.
Nordic countries (Denmark, Sweden, Norway): Gini wealth coefficient ~0.60, though rising. Strong inheritance taxes (or recent repeals thereof), high marginal income taxes (50–60%), and universal pension systems compress wealth distribution. However, even these countries have seen rising inequality in recent years.
Germany: Similar to Nordics but with different mechanisms — strong co-determination rules requiring worker representation on corporate boards, apprenticeship systems that raise median wages, and multigenerational wealth taxes.
China: Official statistics suggest Gini of ~0.46 (lower than the US), but economists (notably Piketty's research group) estimate true wealth Gini closer to 0.65 once you account for rural-urban migration, state asset distribution, and hidden wealth. China's rapid growth reduced extreme poverty while creating a new billionaire class — inequality increased in absolute terms even as some traditional measures improved.
Brazil, India, South Africa: Wealth Gini coefficients >0.75. Extreme inequality driven by colonial-legacy land distribution, caste/race systems that compound wealth disadvantage, and limited social mobility. These countries show what extremely high inequality looks like.
Global inequality: Between countries is enormous. The richest 1% of global population controls roughly 35% of global wealth (vs. 32–34% in the US alone). A American worker in the bottom 50% is wealthier than 85% of the global population. This complicates normative discussions — inequality "bad" means something different if you're comparing within the US vs. globally.
Source: World Inequality Database (piketty.pse.ens.fr/WID), curated by Piketty, Zucman, and colleagues.
Policy Responses: Tax Systems and Their Limits
Different countries have tried different approaches to redistribute wealth or prevent concentration.
Progressive income taxes: Most effective at the point of earning. High marginal rates (50–70%) reduce the accumulation of wealth from earnings. However, the wealthy earn more from capital (8% returns on $10M) than wages, so income taxes alone have limited effect on wealth inequality.
Capital gains taxes: Essential for inequality control but economically complex. High capital gains taxes discourage investment and can reduce capital formation. However, low capital gains taxes (often lower than income tax rates — a feature of US tax code) incentivize the wealthy to convert income into capital gains. Some countries use "carried interest" loopholes that allow investment managers to classify their salary-equivalent as capital gains, taxed at favorable rates.
Inheritance/estate taxes: Directly target wealth concentration across generations. Effective in limiting dynastic wealth but prone to avoidance (trusts, charitable giving, gifting strategies). US estate tax has a $13M exemption (2024); anything below is untaxed. Wealthy families can use sophisticated estate planning to avoid it entirely.
Wealth taxes: Theoretically appealing (tax the stock of wealth, not just the flow of income) but administratively hard. Require valuing illiquid assets (private businesses, real estate), which creates dispute. Capital flight: if you tax wealth at 1% annually but your neighbor country has 0%, rational actors move. Several European countries repealed wealth taxes due to administrative failure and capital flight. However, Nordic countries maintain versions with success — key: international coordination and robust enforcement.
Universal basic income or capital redistribution: Some economists (like Piketty) argue direct redistribution (UBI, capital grants to young people, stakeholder grants) is more effective than taxing. However, funding requires the political consensus to exist first — and the wealthy have strong incentives (and political influence) to prevent it.
Source: Stainsbury, M., "Globalisation and Inequality" (Cambridge University Press, 2009).
Demographic Disparities: How Inequality Intersects with Race and Gender
Aggregate wealth statistics hide disparities within demographic groups.
Racial wealth gap (US): White households have median wealth of ~$188,000; Black households ~$24,000; Hispanic households ~$36,000. This gap is primarily driven by differences in homeownership (redlining history), access to credit, and inheritance. The wealth gap increased from 2007–2023 despite increases in income equality, because asset price appreciation (homes, stocks) disproportionately benefited those who owned them (whiter, older Americans).
Gender wealth gap: Globally, women own ~32% of wealth despite comprising ~50% of population. Causes include: wage gaps in earning years (women earn 10–20% less than men on average), interrupted careers (childcare), lower inheritance (some cultures), and lower investment in financial assets. Surprisingly, the gender wealth gap may be wider than the gender income gap in some countries because compound differences accumulate.
Age and wealth: The young (under 35) have seen stagnant wealth accumulation. In 1989, median wealth of a 25-year-old was ~$10,000 (2023 dollars). In 2023, it was ~$2,000. Causes: student debt (averaging $37,000 per graduate), housing prices (unaffordable in major job markets), and lack of inheritance (Millennials/Gen-Z are receiving smaller inheritances than Boomers did, adjusted for wealth).
These disparities are not just statistical artifacts — they reflect and reinforce social hierarchies. Understanding inequality requires looking at how it intersects with other forms of disadvantage.
Source: Federal Reserve Survey of Consumer Finances, 2022; gender wealth gap analysis in Woolley, F. (various papers on gender economics).
The Stability Question: Does Extreme Inequality Destabilize Economies?
Some economists argue high inequality is self-limiting (it creates political pressure for redistribution) or economically inefficient (reduces consumer demand, slows growth). Others argue it's stable indefinitely (the wealthy can buy political influence to prevent redistribution).
The demand-side argument: If income concentrates among the wealthy (who save most of their income), aggregate consumption falls relative to income. Lower consumption → lower demand for goods → lower business investment → slower growth. Some argue the 2008 financial crisis was partly driven by this: debt-fueled consumption by the middle class trying to maintain living standards while wages stagnated.
The political economy argument: High wealth concentration creates political power concentration. Wealthy interests shape tax policy, regulation, and spending to further advantage themselves — a self-reinforcing loop. This continues until either (a) political instability forces redistribution, or (b) institutional stagnation reduces growth and everyone becomes worse off together.
The empirical question: Is there an "optimal" level of inequality? Some economists (Pickett and Wilkinson) argue societies above a certain inequality level show worse health outcomes, more crime, and lower social trust. Others argue the mechanism is weak and other factors matter more.
Research from 2000–2020 suggests high inequality does correlate with slower growth, lower social mobility, and worse health outcomes. However, causality is unclear — does inequality cause these problems, or do the conditions that allow inequality also cause them?
Source: Piketty, T., Saez, E., & Zucman, G., "The Distributional National Accounts" (Quarterly Journal of Economics, 2018).
Frequently asked questions
Q: Is inequality the same as poverty?
A: No. Poverty is an absolute condition — not having enough resources for basic needs. Inequality is a relative measure — the distribution of resources across a population. A society could theoretically reduce poverty while increasing inequality (if everyone gets richer but the top gets much richer). Most economists argue both matter, but for different reasons and with different policy tools.
Q: What is the Gini coefficient exactly?
A: Geometrically, it's the ratio of the area between the "perfect equality" line and the actual Lorenz curve (which maps cumulative income share against cumulative population share) to the total area under the equality line. Intuitively: 0 means everyone has exactly the same; 1 means one person has everything. Real-world Gini coefficients for income run from about 0.25 (very equal) to 0.65 (very unequal).
Q: Did Piketty's r > g theory hold up to scrutiny?
A: Mostly yes as a long-run structural tendency, with important qualifications. Some economists (notably Charles Jones) argue that the wealth accumulation Piketty predicts raises capital supply, which can drive down returns — limiting the concentrating dynamic. The theory predicts tendencies over centuries, not year-to-year movements. Piketty's data on historical inequality has been mostly replicated, though some specific estimates are debated.
Q: Do wealth taxes work?
A: Mixed evidence. Several European countries (Sweden, France, Germany, Denmark) implemented then repealed wealth taxes, finding them administratively difficult and prone to avoidance through asset migration and valuation manipulation. Norway maintains one and generates significant revenue. Academic debate continues about design: a well-designed wealth tax with robust enforcement and international information sharing would face fewer problems than historical examples.
Q: Is inequality higher now than at the Gilded Age?
A: By most measures, yes — U.S. wealth concentration at the top is comparable to or exceeds the Gilded Age of the late 19th century. The post-WWII decades (1945–1980) were unusually equal by historical standards, partly due to the destruction of European capital, progressive taxation, strong unions, and rapid broad-based growth. The current level represents a return toward historical norms rather than a unique aberration.
Q: What can individuals do about wealth inequality?
A: Individual actions (charitable giving, ethical investing) can express values but don't systematically reduce inequality — they're drops in an ocean. Meaningful change requires policy: tax reform, education investment, wage growth, inheritance taxes. Individuals can advocate for policy, vote, and build institutions that promote more equal opportunity — but inequality is fundamentally a systemic problem requiring systemic solutions.
Technological Disruption and the Wealth Gap of the Future
The rise of artificial intelligence, automation, and software-driven businesses raises a critical question: will wealth inequality continue to concentrate, or could technology enable a more diffuse distribution?
The automation argument for more inequality: Robots and AI systems displace workers in routine jobs — manufacturing, data entry, customer service, trucking, coding — while complementing high-skill workers and capital owners. Someone who owns an AI company sees exponential returns as the software scales. Someone whose job was replaced by automation sees zero returns. This "skill-biased technical change" has been a major driver of inequality since the 1980s. The current AI wave (2023–2026) may accelerate this: unlike previous automation, which mainly affected blue-collar work, AI is automating white-collar jobs — accounting, legal research, design, software engineering. If wages for displaced knowledge workers fall (as happened with manufacturing), inequality could spike.
The counterargument: Automation sometimes raises everyone's living standards. Electricity, antibiotics, smartphones, and the internet all displaced workers while creating new opportunities and reducing the price of essential goods. Real incomes rose broadly. The mechanism: the productivity gains from the new technology eventually translate into cheaper goods and new job categories. If AI follows this pattern, inequality might stabilize even if the disruption is severe in the transition.
The concentration risk: The difference between technology that concentrates wealth and technology that distributes it is often not the technology itself but who owns it and captures the returns. AI developed by a handful of corporations and licensed expensively concentrates wealth. AI available as open-source code with competitive tooling distributes wealth. The same is true of renewable energy: owned by dispersed solar installers and small utilities, it distributes wealth; owned by centralized corporations, it concentrates it.
Piketty and others have argued that the ultimate wealth driver in an AI future won't be labor at all — it will be who owns the AI systems and the compute infrastructure. In this scenario, inequality could become structurally extreme: capital owners (those who own the AI/compute assets) earn 8% returns on enormous capital bases, while everyone else earns near-zero "returns" on their negligible financial wealth. This recreates a feudal dynamic where capital ownership, not labor, determines economic position.
Source: Acemoglu, D. & Restrepo, P. (2022). "Automation and New Tasks: How Technology Displaces and Reinstates Labor." Journal of Economic Perspectives.
Intergenerational Wealth Transmission: How Dynasties Self-Perpetuate
Beyond taxation and current earnings, wealth inequality persists because advantages transmit across generations through channels that don't show up in traditional economic statistics.
Direct inheritance: Boomers (born 1946–1964) accumulated substantial wealth through favorable tax treatment, strong unions, and affordable housing. Gen X and Millennials are set to inherit roughly $80 trillion over 2020–2045. However, this inheritance is extremely skewed: the median Millennial will receive $0 from inheritance (for those who do inherit, the median is $69,000; for the top 10%, it's $1.2 million). Boomers with wealth pass it down; Boomers without wealth can't. This amplifies intergenerational inequality.
Social capital and networks: Children of wealthy families have access to elite schools, professional networks, and mentors that lower-income children don't. A Stanford graduate working at Google through a parent's referral has different outcomes than an equally smart person from a poor background using open-source tutorials. Economists struggle to quantify this, but ethnographic and longitudinal studies consistently show it matters as much as raw skill.
Credentialing cascades: Top universities admit disproportionately from wealthy families (Harvard's class of 2025 was 13.5% legacy admissions — applicants related to alumni — a 3–5x boost to admission probability). These universities lead to high-income careers. This creates a credential advantage that's transmitted intergenerationally and reinforces wealth concentration.
Risk-taking ability: A wealthy parent can fund a child's failed startup without the child starving. A poor child who tries the same thing risks destitution. This reduces the expected payoff of entrepreneurship for the poor and reduces innovative risk-taking among them. It's not just money — it's the option value of failure.
Home equity and location: Wealthy families buy homes in good school districts, which appreciate over time. Poor families either rent or buy in areas with lower appreciation. Over 30 years, the wealthy family's wealth grows from housing; the poor family's doesn't. This compounds intergenerational inequality even without any additional earnings differences.
The result: intergenerational mobility is falling. In the US, the correlation between father's earnings and son's earnings was 0.41 in 1950; by 2000, it had risen to 0.50. This means parental economic position is a stronger predictor of adult outcomes today than it was 70 years ago — the opposite of what a meritocratic society would predict.
Source: Chetty, R., Hendren, N., Kline, P., & Saez, E. (2014). "Where is the Land of Opportunity? The Geography of Intergenerational Mobility in the United States." Quarterly Journal of Economics.
The takeaway
Wealth inequality in developed economies is at historically high levels, driven primarily by capital returns exceeding wage growth (Piketty's r > g) and policy shifts in the 1980s that reduced taxation on capital and high incomes. The mechanisms are clear and well-understood: inheritance, compound growth, and asset appreciation create a self-reinforcing cycle that concentrates wealth. Emerging pressures — technological disruption, changing demographics, and intergenerational wealth transmission — suggest the cycle may intensify rather than stabilize. What remains contested is normative — is this level of inequality acceptable, and what policy trade-offs are worth accepting to change it? Economists disagree on whether high inequality is self-limiting or stable, whether it harms growth or is neutral, and whether wealth taxes or other policies can effectively redistribute. The data itself is political: how you measure and frame inequality shapes what solutions seem plausible.
Read next:
Follow new articles
Add SciHub101 to your feed reader to see new science and technology stories.
About the Author
SciHub101 is an independent science and technology publication founded and edited by Buğra Sözeri, a software engineer and app developer based in Türkiye. AI tools assist with drafting and research. Source documentation in the existing archive is uneven, and articles are being reviewed and corrected. The Editorial Team byline identifies editorial responsibility; it does not certify specialist or independent human review. Where we compare products, anything built by our own team is labelled as such — see the editorial guidelines and About page for how corrections and disclosures work.
Related Articles

AI Loan Approval and Lending Discrimination Explained
Algorithms now help decide who gets credit and at what price. The research on whether they reduce or reproduce lending discrimination is mixed, and U.S. rules are shifting.

How Options and Derivatives Work
Derivatives get blamed for financial crises and praised for managing risk. The truth is they do both — often simultaneously.

Complete Finance Guide 2026 — How Money Really Works
The complete guide to finance in 2026: how money, inflation, and central banks work, investing fundamentals, markets, cryptocurrency, and personal finance explained.

Why Housing Is So Expensive
Housing prices rise when land, zoning, interest rates, construction costs, income, speculation, and supply constraints collide.

Why Interest Rates Affect Everything
Interest rates influence mortgages, stocks, currencies, hiring, inflation, government debt, and startup funding. This guide explains the transmission mechanism.

How Inflation Works — and Why It's So Hard to Stop
Inflation is hard to stop because it feeds itself: rising prices push workers to demand higher wages, which push prices higher still. Here's the full mechanism — the wage-price spiral, self-fulfilling expectations, and why central bank tools work with long and variable lags.