How Colorimeters Measure Concentration

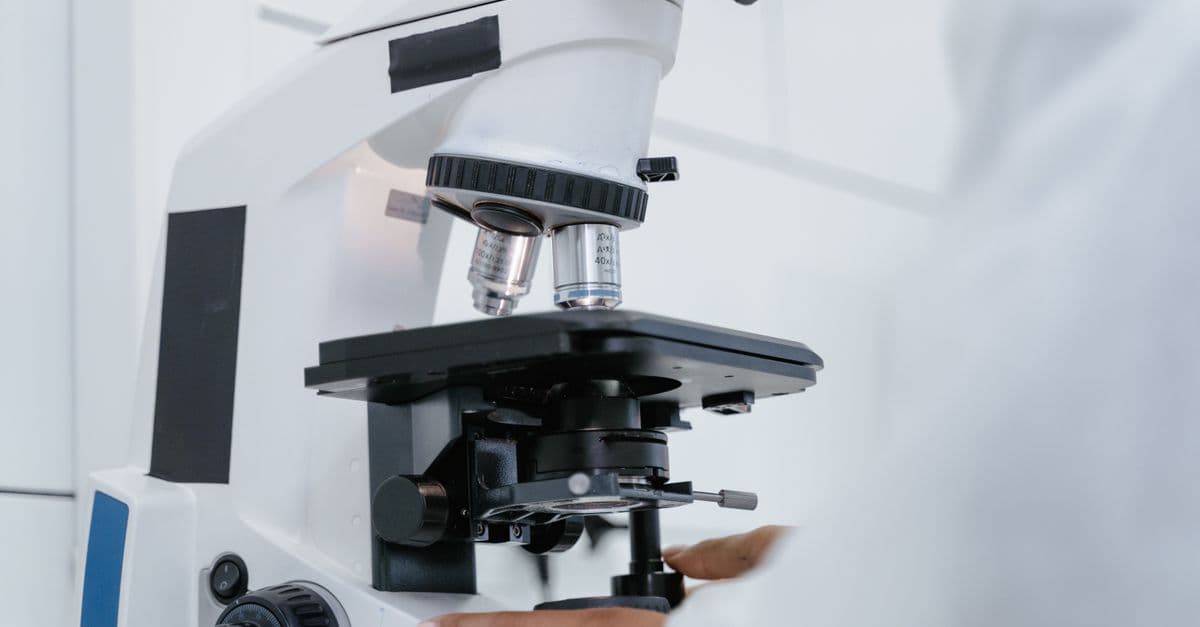
Photo: Daria / Pexels
A colorimeter tells you how concentrated a colored solution is by measuring how much light it blocks, not by "reading" the color the way an eye would. The physics behind it, the Beer-Lambert law, is precise enough that clinical laboratories use the same underlying principle to report blood glucose, bilirubin, and hemoglobin values down to fractions of a milligram per deciliter, and that watershed monitoring programs use it to flag phosphate pollution in streams before algae blooms take hold. This article walks through the equation, the hardware that applies it, where colorimeters differ from their more expensive cousin the spectrophotometer, and where the method breaks down.
What a colorimeter actually measures
A colorimeter does not detect color in the way a human eye or a camera sensor does. It shines a single, narrow band of light through a liquid sample and measures how much of that light comes out the other side. The instrument then reports the loss as a number, either percent transmittance or absorbance — a logarithmic measure of how much light a sample absorbs at a given wavelength, defined so that doubling the absorbance means the sample is letting through only a tenth as much light.
This distinction matters because the human eye is a poor quantitative instrument. Two people looking at the same blue copper sulfate solution will disagree about how "dark" it looks, and even one trained observer's perception shifts with ambient lighting, fatigue, and the color of whatever they looked at five minutes earlier. A photodetector paired with a fixed light source has none of those problems: it returns the same numerical reading for the same sample every time, which is the entire reason quantitative colorimetry replaced visual color-matching in laboratories over the course of the twentieth century.
The practical output of a colorimeter is a concentration value, typically in units like milligrams per liter, moles per liter, or percent by weight, not a raw light reading. Getting from a light measurement to a concentration number requires an equation that links how much light a solution absorbs to how much of the analyte (the substance being measured) is dissolved in it. That equation is the Beer-Lambert law, and it is the mathematical backbone of every colorimeter, spectrophotometer, and pulse oximeter in use today.
The Beer-Lambert law
The relationship colorimeters rely on was worked out in stages by three different scientists, more than a century apart. Pierre Bouguer first described how a beam of light loses intensity as it passes through an absorbing medium in 1729. Johann Heinrich Lambert formalized and popularized that relationship between absorption and path length (the distance light travels through the sample) in his 1760 treatise Photometria, which is why the length-dependent part of the law sometimes carries his name alone. August Beer extended the relationship in 1852 by showing that absorbance also scales linearly with the concentration of the dissolved absorbing substance, completing what is now usually called the Beer-Lambert law, though some texts credit Bouguer alongside Beer and Lambert as the Bouguer-Beer-Lambert law.
The combined law is written as A = ε × c × l. Here A is absorbance, a unitless number; ε (epsilon) is the molar absorptivity, a constant specific to the substance and the wavelength of light being used, describing how strongly that particular molecule absorbs that particular color of light; c is the molar concentration of the analyte; and l is the path length of light through the sample, conventionally 1 centimeter in a standard laboratory cuvette (a small, precisely dimensioned sample container, usually plastic, glass, or quartz).
Absorbance itself is defined logarithmically, as A = log₁₀(I₀ / I), where I₀ is the intensity of light entering the sample and I is the intensity that makes it through. That logarithmic definition explains a detail that trips up many students the first time they use a colorimeter: doubling the concentration of a dissolved substance does not halve the fraction of light that passes through. It doubles the absorbance value, because absorbance is proportional to concentration by definition, while transmittance falls off exponentially. A colorimeter reporting raw transmittance would give a curved, awkward relationship to graph; reporting absorbance turns that relationship into a straight line, which is why every colorimeter used for quantitative work displays absorbance, transmittance, or both, and why lab protocols almost universally ask students and technicians to record absorbance rather than percent transmittance.
Why the law breaks down at high concentration
At high concentrations, dissolved molecules sit closer together and start interacting with each other electronically, which shifts how efficiently they absorb light at the calibrated wavelength. At the same time, so little light survives the trip through a densely colored sample that stray light scattered inside the instrument, and the detector's own electronic noise floor, become a larger fraction of the signal being measured. Both effects push the observed absorbance away from the straight line the Beer-Lambert law predicts, which is why standard laboratory practice is to dilute an over-range sample and re-measure rather than extrapolate.
Inside the instrument
A colorimeter's optical path is short and deliberately simple. Light originates from an LED or a filtered tungsten bulb, chosen or filtered to emit mostly at a wavelength the target substance absorbs strongly. That light passes through the cuvette holding the sample, and whatever survives lands on a photodetector on the far side, which converts the transmitted light intensity into an electrical signal the instrument's circuitry translates into a transmittance or absorbance reading.
Wavelength selection is not arbitrary. Copper sulfate solutions, a staple of introductory chemistry labs, absorb strongly in the orange-red part of the visible spectrum, roughly 600 to 800 nanometers, because the hydrated copper(II) ion absorbs those wavelengths and transmits the blue light that gives the solution its characteristic color. A colorimeter measuring copper sulfate concentration is therefore fitted with a red or orange filter, often centered near 620 to 650 nanometers, chosen specifically because it sits at or near the substance's absorption maximum. Measuring at the wavelength of peak absorbance maximizes the change in absorbance per unit change in concentration, which is what makes the instrument sensitive enough to distinguish a 0.1 molar solution from a 0.15 molar one.
Before any unknown sample is measured, the instrument is zeroed using a blank: a cuvette holding pure solvent with no dissolved analyte, set to register 100 percent transmittance, or zero absorbance. This step matters because the cuvette itself, the solvent, and any residual color in the reagent all absorb a small amount of light independent of the substance being measured, and failing to subtract that background would systematically bias every subsequent reading upward.
Building and reading a calibration curve
Once the instrument is blanked, technicians prepare a series of standards, solutions of known concentration spanning the expected range of the unknown samples, and measure the absorbance of each. Plotting absorbance against known concentration produces the calibration curve. Because the Beer-Lambert relationship is linear within the reliable absorbance range, that curve is typically a straight line passing near the origin, and its slope is effectively the product of the molar absorptivity and the path length. An unknown sample's concentration is then read off by measuring its absorbance and finding the matching concentration on that line, either graphically or by solving the line's equation directly.
| Component | Role | Typical Detail |
|---|---|---|
| Light source | Provides a wavelength the analyte absorbs strongly | LED or filtered tungsten lamp |
| Optical filter | Narrows the light to the analyte's absorption peak | Colored glass or interference filter |
| Cuvette | Holds the sample at a fixed path length | 1 cm plastic, glass, or quartz |
| Photodetector | Measures transmitted light intensity | Photodiode or phototransistor |
| Calibration curve | Converts a raw absorbance reading into a concentration | Built from known standards, plotted linearly |
A colorimeter's five core components work together to turn an optical signal into a chemical quantity, with the calibration curve doing the final translation.
Colorimeters versus spectrophotometers
A colorimeter and a spectrophotometer apply the identical Beer-Lambert relationship, but they differ in how finely they can select wavelength, and that difference drives most of the cost gap between the two.
A colorimeter uses a fixed set of colored filters or a handful of LEDs, each tuned to a specific wavelength band, so it can only measure at those few preset points. A spectrophotometer instead uses a diffraction grating or a prism to disperse light into its component wavelengths and select any wavelength continuously, often scanning the full range from about 200 to 800 nanometers, which covers both ultraviolet and visible light. That continuous tunability lets a spectrophotometer trace a substance's full absorption spectrum, find an absorption peak nobody had characterized before, or resolve two overlapping peaks that a colorimeter's broad filter would blur into one reading.
The cost difference reflects that added capability. A basic educational colorimeter, adequate for measuring copper sulfate or food dye concentration in a classroom, can be purchased for well under 100 US dollars, which is one reason the instrument is a staple of high school and undergraduate chemistry and biology labs. A research-grade UV-Vis spectrophotometer, by contrast, can run into the tens of thousands of dollars, reflecting the precision optics, the grating or prism monochromator, and the more sensitive detector electronics needed to resolve fine spectral detail across a wide wavelength range.
| Feature | Colorimeter | Spectrophotometer |
|---|---|---|
| Wavelength selection | Fixed filters or LEDs, a handful of discrete bands | Continuous, via diffraction grating or prism |
| Typical range | Visible light only, roughly 400–700 nm | Often 200–800 nm, UV through visible |
| Typical cost | Under $100 (educational grade) | Thousands to tens of thousands of dollars |
| Best for | Routine, known-wavelength measurements | Discovering or resolving absorption peaks |
| Common setting | Classrooms, field kits, basic QC labs | Research labs, pharmaceutical QC, forensics |
Both instruments obey the same Beer-Lambert law; the spectrophotometer simply trades cost for finer wavelength control.
When a colorimeter is the better tool, not just the cheaper one
Choosing a spectrophotometer is not automatically "better" science. If an analyst already knows the exact wavelength a reagent-colored compound absorbs, a colorimeter delivers a faster, more portable, and often more rugged measurement, which is precisely why field water-testing kits and point-of-care blood analyzers are built around colorimeters and simple photometers rather than full-spectrum instruments. The extra wavelength range of a spectrophotometer only pays off when the identity or the absorption profile of the target substance is not already pinned down.
Real-world applications of the Beer-Lambert principle
Colorimetry's reach goes well beyond the classroom copper sulfate experiment, and tracing a few of its applications shows why the underlying physics has stayed relevant for nearly two centuries.
Clinical chemistry leans on colorimetric and related photometric methods for a large share of routine diagnostic blood tests run in hospital laboratories, because many biologically important molecules, such as glucose, creatinine, and bilirubin, are colorless or only faintly colored in their native form. Standard clinical protocols react these molecules with a reagent that produces a colored complex whose absorbance can then be measured and converted to a concentration through a calibration curve, applying the same A = ε × c × l relationship used in a high school lab, just automated and scaled up. Pulse oximeters, the clip-on finger sensors used to estimate blood oxygen saturation, apply a closely related principle: they shine two wavelengths of light through a fingertip and use the different absorption spectra of oxygenated and deoxygenated hemoglobin to estimate the ratio between the two.
Water quality testing is one of the most widely deployed field applications of colorimetry. The US Environmental Protection Agency's standard methods for nitrate (Method 353.2) and total phosphorus (Method 365.2) both rely on colorimetric reactions, most commonly the molybdenum blue method for phosphate, in which a reagent converts phosphate ions into a blue-colored complex whose absorbance is then measured to determine concentration. Citizen-science river monitoring programs and municipal wastewater labs alike use portable, battery-powered colorimeters built around this same chemistry to track nutrient pollution that can trigger algal blooms downstream.
Photographic and print densitometry applies the identical logarithmic absorbance concept to a different problem: measuring how dark a spot on developed film or a printed color patch is. A densitometer, the instrument used in photographic labs and commercial printing quality control, measures optical density on a logarithmic scale running roughly from 0 to 4, where a 0.3 increase in density corresponds to a halving of transmitted light, the photographic equivalent of one exposure "stop." Densitometers have historically been essential for calibrating film development and, later, for verifying that a printing press is laying down ink at the correct density across a print run, work that predates digital sensors and still runs on the same absorbance mathematics a chemistry student uses with a beaker of copper sulfate.
Why colorless molecules still need a colorimeter
Many analytes of clinical or environmental interest do not absorb visible light on their own, so a colorimetric assay first reacts the target molecule with a reagent that produces a new, strongly colored compound in an amount directly proportional to how much of the original analyte was present. Measuring the absorbance of that colored product, rather than the original molecule, is what lets a colorimeter quantify substances like glucose or phosphate that would otherwise be invisible to the instrument.
Common misconceptions about colorimetry
A few points of confusion come up often enough, in classrooms and in the field, that they are worth addressing directly.
The first is assuming a colorimeter "sees color" the way a person does. It does not perform any color recognition; it measures the intensity of light at one narrow wavelength band before and after it passes through the sample, and everything else, the concentration value included, is calculated from that single number using a predetermined equation. A colorimeter cannot distinguish a green solution from a blue one unless it is fitted with the correct filter for each, and it has no concept of hue, saturation, or brightness in the way a camera sensor or the human eye does.
The second is treating absorbance and transmittance as interchangeable numbers that just need converting. They describe the same physical measurement, but only absorbance is linearly proportional to concentration; transmittance falls off exponentially as concentration rises. A student who plots percent transmittance against concentration and expects a straight line will get a curve instead, and the resulting "calibration" will only be accurate near the specific concentration where the curve happens to look locally linear.
The third misconception is assuming any dissolved substance can be measured directly with a colorimeter. As covered above, many important molecules are effectively colorless at the concentrations found in a blood or water sample, and skipping the reagent reaction step, or using the wrong reagent, produces a reading that reflects background noise rather than the actual analyte concentration. Colorimetric assay development is, in large part, the search for a reagent that reacts specifically and proportionally with the target molecule and nothing else in the sample.
The fourth is trusting a reading that falls well outside the calibration curve's tested range. Extrapolating a straight line beyond the concentrations actually used to build it assumes the linear relationship continues indefinitely, which the Beer-Lambert law does not guarantee, particularly at the high-concentration end where molecular interactions and stray light both distort the signal. Reliable lab protocol calls for diluting an out-of-range sample and re-measuring within the calibrated window rather than trusting an extrapolated number.
The takeaway
Colorimeters work because absorbance scales linearly with concentration under the Beer-Lambert law, a relationship first sketched by Pierre Bouguer in 1729 and completed by August Beer in 1852, letting a simple light-source-and-detector setup turn an optical measurement into an exact chemical quantity. The same principle, tuned to whatever wavelength a given substance absorbs most strongly, underlies a copper sulfate lab in a high school classroom, a hospital's glucose panel, a river monitoring program's phosphate test, and a century-old darkroom densitometer. What changes across those applications is the reagent chemistry and the wavelength selected, not the underlying mathematics, which is a large part of why an equation from the 1850s is still built into instruments manufactured today.
Read next:
FAQ
Q: What is the Beer-Lambert law?
It is the equation A = ε × c × l, stating that a solution's absorbance (A) is directly proportional to its concentration (c), the path length of light through it (l), and a substance-specific constant (ε), the molar absorptivity, at a given wavelength.
Q: Why do colorimeters use colored filters?
A filter or LED wavelength is chosen to match the color the sample absorbs most strongly, which is the complementary color to what the solution visually appears. Measuring at that absorption peak maximizes the change in absorbance per unit of concentration, making the reading more sensitive to small concentration differences.
Q: What is the difference between a colorimeter and a spectrophotometer?
A colorimeter measures at a small number of fixed wavelengths using filters or LEDs, while a spectrophotometer scans continuously across a range of wavelengths, often 200 to 800 nanometers, using a diffraction grating or prism, offering far more detail at a significantly higher cost.
Q: Why does the Beer-Lambert law break down at high concentrations?
At high concentrations, molecules can interact with each other, changing how they absorb light, and very little light reaches the detector, so stray light and instrument electronic noise start to dominate the signal. This is why analysts dilute over-range samples and re-measure within the instrument's reliable range.
Q: What does a calibration curve do in colorimetry?
It converts a raw absorbance reading into a concentration value by plotting absorbance against known standard concentrations, then using that line, or its equation, to interpolate the concentration of an unknown sample.
Q: Can a colorimeter measure a colorless substance like blood glucose?
Not directly. Clinical assays first react the colorless analyte with a reagent that produces a colored compound in an amount proportional to the original substance's concentration, and the colorimeter then measures the absorbance of that colored product rather than the analyte itself.
Q: What wavelength range do colorimeters typically use?
Colorimeters generally operate within the visible light spectrum, roughly 400 to 700 nanometers, since they are built around filters or LEDs tuned to the color a sample absorbs. Spectrophotometers extend further, into the ultraviolet range down to about 200 nanometers, for substances that absorb outside visible light.
Follow new articles
Add SciHub101 to your feed reader to see new science and technology stories.
About the Author
SciHub101 is an independent science and technology publication founded and edited by Buğra Sözeri, a software engineer and app developer based in Türkiye. AI tools assist with drafting and research. Source documentation in the existing archive is uneven, and articles are being reviewed and corrected. The Editorial Team byline identifies editorial responsibility; it does not certify specialist or independent human review. Where we compare products, anything built by our own team is labelled as such — see the editorial guidelines and About page for how corrections and disclosures work.
Related Articles


Quantum Error Correction Explained: Physical Qubits, Logical Qubits and Thresholds
Quantum error correction protects one logical qubit across many noisy physical qubits. Learn how syndromes, surface codes, and thresholds work in practice.

Sodium-Ion Batteries Explained: Chemistry, Advantages, Trade-Offs and Uses
Sodium-ion batteries move sodium instead of lithium ions. See how the cathode, hard-carbon anode and electrolyte work, the numbers, and where they fit.

Structural Battery Composites Explained: When Materials Carry Loads and Store Energy
Structural battery composites let carbon fiber carry loads and store energy. See how they work, what the lab numbers mean, and why products are still rare.