Countries with the Highest Voter Turnout (Elections Ranked)
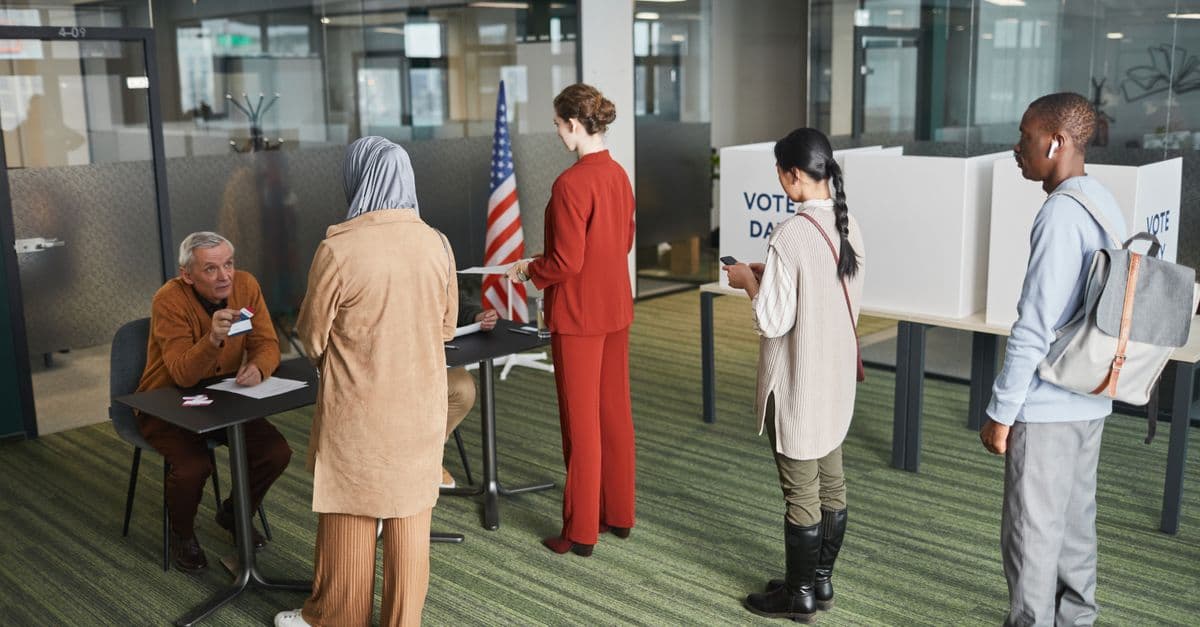
Photo: Edmond Dantès / Pexels
Voter turnout — the share of eligible citizens who cast a ballot in elections — is one of democracy's most direct health indicators. A government chosen by 40% of eligible voters has a different legitimacy claim than one chosen by 85%. The gap between the world's most and least participatory democracies is enormous: some countries routinely see 90%+ of eligible voters casting ballots; others struggle to reach 40% for national elections. The difference is shaped far more by legal requirements, electoral system design, registration procedures, and voting logistics than by the cultural enthusiasm of citizens. This article ranks countries by turnout, explains the mechanisms that drive the gap, and examines the most instructive cases.
Where this data comes from
The voter turnout statistics and country rankings in this article come from the International IDEA (Institute for Democracy and Electoral Assistance) Voter Turnout Database, which maintains the most comprehensive global collection of election turnout statistics dating to 1945. The database covers parliamentary, presidential, and local elections for approximately 200 countries and territories. All data in this article reflects voting-age population (VAP) turnout — votes cast as a share of all eligible adults — rather than registered-voter turnout, as this is the more internationally comparable metric. Figures represent averages of recent national elections (most commonly 2020–2024) rather than single elections, smoothing anomalies from unusual election cycles. IDEA's data comes from official electoral management bodies and is updated after each election.
What the data measures and how it is collected
The authoritative source for international voter turnout data is the International IDEA (Institute for Democracy and Electoral Assistance) Voter Turnout Database, which holds the most comprehensive global collection of election statistics since 1945. The database covers parliamentary and presidential elections and provides both registered-voter turnout (votes cast as a share of registered voters) and voting-age population turnout (votes cast as a share of the eligible adult population).
These two measures can diverge significantly. A country with automatic universal voter registration will show similar figures on both measures. A country where many eligible citizens are unregistered (like the United States) will show a higher registered-voter turnout than VAP turnout — because the denominator only includes people who registered, not all eligible citizens.
Turnout figures cited here are VAP (voting-age population) turnout for the most recent national parliamentary or presidential elections, averaged where multiple recent elections are available. Election-specific figures can vary substantially based on competitiveness, political context, and candidate appeal.
Countries with the highest voter turnout (recent national elections)
| Rank | Country | VAP Turnout (avg. recent) | Compulsory? | Electoral system |
|---|---|---|---|---|
| 1 | Singapore | 93–95% | Yes (de facto) | Single-member + GRC |
| 2 | Belgium | 88–92% | Yes (since 1893) | Proportional + ranked |
| 3 | Australia | 89–92% | Yes (since 1924) | Preferential/IRV |
| 4 | Luxembourg | 88–91% | Yes | Proportional |
| 5 | Malta | 89–93% | No | STV proportional |
| 6 | Sweden | 85–88% | No | Proportional |
| 7 | Denmark | 83–86% | No | Proportional |
| 8 | Iceland | 81–86% | No | Proportional |
| 9 | South Korea | 75–80% | No | Mixed: FPTP + PR |
| 10 | New Zealand | 78–82% | No | MMP proportional |
| 11 | Germany | 76–80% | No | MMP proportional |
| 12 | Canada | 63–68% | No | FPTP |
| 13 | United Kingdom | 62–67% | No | FPTP |
| 14 | France | 50–76%* | No | Two-round system |
| 15 | Japan | 52–59% | No | Mixed FPTP + PR |
| 20 | United States | 50–66% | No | FPTP, decentralised |
| 25 | Switzerland | 43–48% | No | Proportional + direct democracy |
France's turnout varies dramatically by election type and round; 2022 first-round legislative elections reached a record-low 47.5%
Source: International IDEA — Voter Turnout Trends around the World
Why these countries lead in voter turnout
The world's highest turnout countries cluster around two distinct mechanisms: compulsory voting (Belgium 88–92%, Australia 89–92%, Luxembourg 88–91%) and institutional design in voluntary democracies (Malta 89–93%, Sweden 85–88%, Denmark 83–86%). Compulsory voting produces a mechanical 15–20 percentage point advantage over voluntary systems because voting carries legal obligation. Among voluntary systems, proportional representation eliminates the "wasted vote" dynamic that suppresses turnout in first-past-the-post systems — every vote contributes to seat allocation rather than only votes for the seat winner. Automatic registration removes the friction barrier of sign-up. Holding elections on weekends or designated holidays removes the Tuesday-workday penalty. The United States at 50–66% reflects the opposite architecture: barriers at every stage (registration requirement, Tuesday election day, limited early voting, long lines, voter ID requirements), a first-past-the-post system where most votes are "wasted" in safe districts, and decentralised administration creating inequality. This demonstrates turnout is not a cultural or attitudinal variable — it is responsive to system design. Australia before (57%) and after (91%) compulsory voting in 1924 shows the same electorate dramatically changing its behaviour based on institutional incentives.
Historical context — suffrage, access, and exclusion
Measuring voter turnout requires first understanding who is counted as "eligible." For most of electoral history, the eligible electorate was a small fraction of the adult population. Ancient Athenian democracy excluded women, slaves, and foreign residents — the actual voting population was perhaps 10–20% of adults. The English Great Reform Act of 1832 extended suffrage but still restricted it to male property owners. Universal male suffrage arrived in most Western countries between roughly 1850 (France, 1848) and 1919 (Germany's Weimar Republic). Women's suffrage followed: New Zealand was first in 1893; most Western countries followed between 1918 and 1945; Switzerland — remarkably — did not grant women federal voting rights until 1971.
These exclusions matter for reading historical turnout data. A 19th-century election showing 80% "turnout" among a registered electorate of property-owning men is not comparable to 80% turnout among all adult citizens. The expansion of suffrage consistently lowers turnout percentages mechanically — adding previously excluded groups (who tend to vote at lower initial rates) to the denominator — before those groups' participation rates converge with the historical electorate over subsequent generations.
The 20th century's most consequential shift was the systematic exclusion and then re-enfranchisement of Black Americans. Despite the 15th Amendment (1870) formally granting Black men voting rights, Jim Crow laws — literacy tests, poll taxes, violence, and administrative obstruction — suppressed Black voting across the South until the Voting Rights Act of 1965. The implementation of the VRA produced immediate and dramatic increases in Black voter registration and turnout in Southern states, demonstrating that structural barriers, not voter disinterest, had been the operative constraint.
Methodology — how turnout is calculated
International IDEA classifies elections by type (presidential, parliamentary, local, referendum), reports both registered voter and voting-age population turnout, and flags whether voting is compulsory. The database covers elections since 1945 and is updated after each election by national electoral management bodies.
The 26 countries with some form of compulsory voting law are identified in the IDEA database, with notes on whether laws are actively enforced, enforced with fines, or nominally on the books but unenforced. Among these 26 countries, 12 (46%) appear in the top tier of global turnout (above 81%), providing robust cross-national evidence that compulsion raises turnout.
For multi-round electoral systems (France, some presidential elections), IDEA reports first-round figures as the primary comparison point, since second-round turnout is structurally different — the electorate has already filtered once.
Why compulsory voting works — and its effects beyond turnout
Countries with enforced compulsory voting average approximately 15–20 percentage points higher turnout than comparable voluntary democracies. The mechanism is simple: non-voting carries a penalty, transforming the decision calculus from "should I bother?" to "what is the cost of not complying?" But the effects extend beyond the turnout number itself.
Australia is the gold standard case. Australia introduced compulsory voting for federal elections in 1924, after a 1922 election in which turnout dropped to approximately 57%. Turnout jumped immediately to over 91% and has remained there. The fine for non-compliance is modest — starting at A$20 (~$13 USD), rising to A$170 for ignoring reminder notices — but the compliance rate is approximately 95%. Voters who have a valid reason for not voting (illness, travel, religious observance) can apply for exemption.
The political effects are instructive. Under voluntary voting, parties optimise strategy toward mobilising their most committed base — the ideological extremes who turn out regardless. Under compulsory voting, the median voter (who would otherwise stay home) becomes decisive. Australian political scientists have documented that compulsory voting appears to moderate political outcomes — parties that need to appeal to the median voter, not just the motivated base, tend toward the centre. This is empirically contested but is the most commonly cited secondary effect.
Belgium since 1893. Belgium has had compulsory voting since 1893, making it among the world's oldest such systems. Theoretical penalties for repeat non-voters include deprivation of certain civic rights, though enforcement is rare in practice. The social norm of voting is so embedded in Belgian culture that the legal compulsion is now largely redundant — Belgians vote because Belgians vote, not primarily because of the fine.
Source: International IDEA — Voter Turnout 2024 Global Elections Super-Cycle Year
The 2024 global elections year. 2024 was described by IDEA as a "super-cycle" year — more than 70 countries held national elections, meaning roughly half the world's population had voting opportunities. IDEA's assessment found that turnout declined in many of those elections compared to previous cycles, including in major democracies. Declining engagement is not universal, but the trend is negative in more countries than positive.
Why is US voter turnout chronically low?
The United States ranks approximately 20th among wealthy democracies for voter turnout — a persistent underperformance that reflects deliberate systemic choices more than voter apathy.
Registration barriers. The US is one of the few wealthy democracies that requires voters to proactively register before they can vote — a step that creates meaningful friction. An estimated 50 million eligible Americans are unregistered. Most peer democracies use automatic or universal registration systems where citizens are enrolled automatically when they turn 18 or register for government services. The US's decentralised registration system — administered at state and county level with highly variable procedures — adds complexity that suppresses participation.
Election day logistics. Federal elections are held on Tuesdays — a 19th-century convention designed for when farmers needed travel time to reach county seats on market day (Monday) and still return home by the Sabbath (Wednesday market return schedule). Most peer democracies hold elections on weekends or designate election day a public holiday, removing the work-day attendance barrier. Long queues in some US jurisdictions — documented at 3–5 hours in some heavily minority precincts — create an additional time cost disproportionately affecting lower-income voters who cannot afford to leave work.
Voter ID and access restrictions. State-level voting laws vary enormously. Strict photo ID requirements, reduced polling locations, shortened early voting windows, felon disenfranchisement (5.2 million Americans were disenfranchised due to felony convictions as of 2020), and purging of voter rolls all reduce participation, with effects falling disproportionately on lower-income, minority, and young voters.
Safe seats and incentive suppression. In a first-past-the-post system with heavily gerrymandered congressional districts, most seats are predictably partisan. Rational voters in safely blue or safely red districts face a genuine calculation that their vote is unlikely to affect the outcome. Proportional representation systems, where every vote contributes to seat allocation, do not produce this effect.
Decentralised administration. Unlike most democracies where elections are administered by a single national electoral management body, US elections are run by approximately 10,000 independent jurisdictions with highly variable systems, technology, accessibility, and quality. This produces structural inequality in voting access that a centralised system could not legally sustain.
Source: Our World in Data — Voter Turnout of Registered Voters 2025
2020 was an exceptional year at 66% — the highest US presidential election turnout in over 100 years — driven by intense political polarisation, expanded mail-in voting, and record mobilisation on both sides. Whether this represents a structural shift or a one-cycle outlier is not yet clear.
Sweden and the Nordic model — high turnout without compulsion
Sweden (85–88%), Denmark (83–86%), and Iceland (81–86%) achieve near-compulsory-voting levels without any legal requirement. These countries have solved the participation problem through institutional design rather than legal compulsion, and their experience provides a template that most voluntary democracies have not replicated.
Proportional representation. Every vote in a proportional system contributes directly to seat allocation. There are no wasted votes in safe seats. A voter for a party that receives 10% of the vote elects approximately 10% of parliament — unlike FPTP where the same 10% party likely wins zero seats. The instrumental value of voting is higher in proportional systems.
Automatic registration. Swedes and Danes are automatically registered to vote upon reaching 18. No action is required. Registration rolls are updated automatically from national population registers. The friction of registration is zero.
Easy access. Nordic elections are held with extensive early voting periods, multiple voting locations, and in many cases the ability to vote at any location in the country rather than only a specific assigned polling station. Mobile voting for hospitalised or housebound citizens is standard.
High political trust. The Reuters Institute Digital News Report finds Finnish and Norwegian citizens trust news at rates above 55% — compared to under 30% in the US and UK. High-trust societies have citizens who believe their votes affect outcomes and their government institutions operate as intended. Low political trust rationally suppresses turnout, since voting is only worth the effort if you believe the system responds to votes.
Cultural civic norms. Non-voting carries informal social stigma in Nordic countries that is comparable to the legal sanction in compulsory-voting countries. The social expectation that citizens vote is internalized to a degree not found in most voluntary democracies.
Switzerland's paradox — too much democracy
Switzerland is unusual among wealthy democracies for achieving very low turnout (~43–48%) despite being a model of direct democracy. Swiss citizens vote not just on candidates but on 4 or more national referendums per year, plus cantonal and local referendums, on topics ranging from motorway speed limits to bilateral agreements with the EU.
The consequence is referendum fatigue. Swiss citizens selectively engage with issues they care about and routinely skip others. Turnout varies dramatically by issue — contentious immigration referendums or EU-relationship votes can reach 60–70%; minor administrative questions may draw 35%. The aggregate average across all votes is well below comparable peer democracies.
Switzerland's experience directly challenges the intuition that more democratic participation mechanisms necessarily produce higher civic engagement. When citizens are asked to vote eight or ten times per year on complex policy questions, the opportunity cost of informed engagement is very high, and selective abstention becomes a rational response.
This is fundamentally different from low turnout produced by access barriers — Swiss citizens have every facility to vote, including postal voting available to all. It is low-turnout by choice among an electorate with maximum democratic opportunity.
Surprises in the data
Malta at 89–93% without compulsion. Malta consistently achieves near-compulsory-voting turnout with no legal requirement. Malta uses the Single Transferable Vote (STV) system, which is proportional and allows voters to rank candidates across party lines. Malta is also a small country (population ~530,000) where social pressure to vote is intense and elections are local enough to feel personal and consequential. Malta demonstrates that a specific combination of proportional system and small-country community effects can produce very high voluntary turnout.
France's dramatic variation. French turnout varies from 47% (2022 first-round legislative elections, record low) to 76% (2022 presidential election). The same population, the same electoral calendar, the same year — a 29-percentage-point gap depending on which office is being filled. Presidential elections attract near-universal attention; legislative elections are perceived as secondary. This illustrates that turnout is not a fixed cultural property but a response to perceived stakes.
South Korea at 75–80%. South Korea, without compulsory voting, achieves higher turnout than most Western first-past-the-post democracies. The combination of a mixed electoral system, historically high political engagement, and election days designated as national public holidays produces strong voluntary participation. The April 2024 National Assembly election reached approximately 67% turnout — modest by Korean historical standards.
Frequently asked questions
Q: Does higher turnout change election outcomes? A: Generally, higher turnout favours centre-left parties, since lower-income and younger voters who are disproportionately non-voters tend to lean left on economic issues. Research on Australian compulsory voting suggests modest shifts toward Labor. However, the effect is not deterministic — political context, candidate quality, and issue salience interact with turnout in complex ways. Compulsory voting changes the composition of the electorate but not a simple formula for outcomes.
Q: What about countries claiming 99%+ turnout? A: Some authoritarian states report near-100% turnout figures — North Korea claims 99.98%, Turkmenistan reports comparable figures. These are not meaningful democratic participation statistics. They reflect enforced or manufactured compliance: citizens who do not appear at polling stations in one-party states face serious consequences; reported results do not reflect genuine choices. IDEA excludes non-free elections from its substantive analysis of turnout as a democratic indicator.
Q: What is the effect of ranked-choice voting on turnout? A: The evidence is mixed. Proportional systems consistently produce higher turnout than FPTP across large cross-national comparisons. Ranked-choice voting (preferential voting) alone, without proportionality, shows modest and inconsistent turnout effects in US jurisdictions that have adopted it. The mechanism that drives Nordic high turnout is primarily proportionality, not the ranking of candidates specifically.
Q: Is online voting the future of turnout improvement? A: Estonia has offered internet voting since 2005; in recent elections, over 50% of votes are cast online, rising above 60% in 2023 national elections. Estonian overall turnout has not dramatically increased, suggesting online voting shifts the method of participation rather than creating new participants. Security concerns remain — the risk of large-scale or targeted cyberattack on online voting infrastructure — and most democracies have concluded these risks outweigh accessibility benefits. Estonia's success is sometimes attributed to its unusually advanced digital identity infrastructure, which may not transfer easily to other contexts.
Q: Does voter turnout matter for policy outcomes? A: Research in political science consistently finds that low-turnout democracies produce policy more closely aligned with the preferences of higher-income, older, and more educated citizens — the groups who vote at highest rates. When non-voters are added to samples surveying policy preferences, the distributions of preferences shift on issues including healthcare, housing, education spending, and minimum wage. This implies that low turnout produces systematic under-representation of lower-income and younger populations in policy outcomes, not merely in election results.
Q: Why did 2020 see record US turnout? A: The 2020 presidential election produced approximately 66% VAP turnout — the highest since 1900. Contributing factors: unprecedented polarisation creating high perceived stakes on both sides; massive expansion of mail-in voting due to COVID-19, removing logistical barriers; record early voting availability in many states; and mobilisation campaigns (particularly by Democratic-aligned organisations targeting young and minority voters) that reduced registration gaps. Whether these structural changes (expanded mail voting in particular) will persist and sustain higher turnout in subsequent cycles is a key open question.
The takeaway
Voter turnout is shaped by systems, not souls. Compulsory voting is the single most powerful intervention — Australia and Belgium demonstrate it produces 90%+ participation sustainably. Among voluntary democracies, proportional representation eliminates the wasted-vote dynamic that suppresses participation in FPTP systems; automatic registration removes the friction barrier; and accessible logistics (weekend voting, public holiday election days, extensive early voting) remove the time cost. The United States' chronically low turnout reflects deliberate friction built into its voting architecture — barriers that most wealthy peer democracies have eliminated and that fall disproportionately on the populations least represented in current outcomes. Switzerland's paradox — the world's most direct democracy with some of the lowest turnout among wealthy nations — demonstrates that volume of voting opportunities does not equal civic engagement. Quality, stakes, and structural design are what drive participation.
Read next:
Follow new articles
Add SciHub101 to your feed reader to see new science and technology stories.
About the Author
SciHub101 is an independent science and technology publication founded and edited by Buğra Sözeri, a software engineer and app developer based in Türkiye. AI tools assist with drafting and research. Source documentation in the existing archive is uneven, and articles are being reviewed and corrected. The Editorial Team byline identifies editorial responsibility; it does not certify specialist or independent human review. Where we compare products, anything built by our own team is labelled as such — see the editorial guidelines and About page for how corrections and disclosures work.
Related Articles

Alcohol Consumption by Country: Comparing the Measures
Country alcohol comparisons depend on pure-alcohol units, the age range, and estimates of unrecorded drinking. Learn what a per-capita figure can tell you and what it cannot.

Countries That Host the Most Refugees in the World (2025)
Iran hosts nearly 3.5 million refugees — the most of any country. Turkey hosts 2.9 million. Germany leads Europe with 2.6 million. Contrary to popular perception, the majority of the world's refugees are hosted not by wealthy Western nations but by low- and middle-income countries neighbouring conflict zones.

How Democracy Works — and Why It's Under Threat
Four major democracy indices, V-Dem, Freedom House, the EIU and International IDEA, have reported global decline for years, though the EIU's 2025 edition found scores stabilising. V-Dem counts 92 autocracies and 87 democracies at the end of 2025. What democracy requires, how the indices measure it, where they disagree, and how democracies erode.

Most and Least Democratic Countries in the World (2025)
Norway scores 9.81 out of 10 on the Economist Intelligence Unit's Democracy Index, making it the world's most democratic nation. North Korea sits at 1.08, the world's most authoritarian state. This ranking covers the top 20 democracies, the bottom authoritarian regimes, and the disturbing global trend of democratic backsliding.

What If AI Ran Every Government?
Governments are slow, corrupt, and self-interested. An AI with perfect information and no incentive to lie sounds tempting. But who programs the AI — and what do they tell it to want?
Countries with the Highest Gender Equality (2025 Ranked)
Iceland has been the world's most gender-equal country for 15 consecutive years, closing 93.5% of its gender gap according to the World Economic Forum's 2024 Global Gender Gap Index. Finland, Norway, and New Zealand follow. The WEF estimates the global gender gap will take 134 years to close at current rates — and political empowerment remains the dimension furthest from parity.