How Inflation Erodes Purchasing Power Over Time
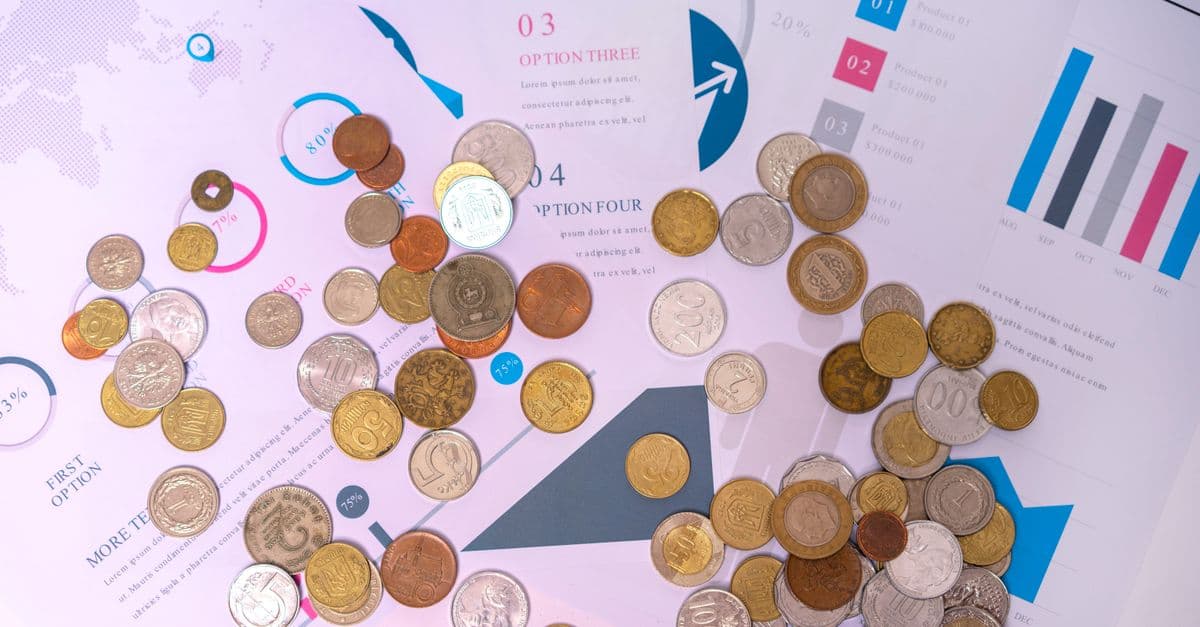
Photo: Atlantic Ambience / Pexels
Money doesn't disappear when prices rise, but what it can buy does. Inflation is the sustained increase in the general price level of goods and services in an economy, tracked in the United States chiefly through the Consumer Price Index (CPI) published monthly by the Bureau of Labor Statistics. A dollar that buys a loaf of bread today buys less bread next year if prices rose 3 percent in between, and that single, unremarkable fact, repeated year after year, is responsible for some of the largest wealth transfers in economic history. This is educational content, not financial, investment, or tax advice; it does not recommend any specific asset, account, or strategy for any individual.
What inflation actually is, and what it isn't
Inflation is a change in the purchasing power of a currency, not a change in the total amount of money that exists, though the two are often related. When economists say prices "rose 4 percent," they mean the average cost of a representative basket of goods and services, weighted by how much of each item a typical household buys, increased by that amount over some period, usually a year. The basket includes categories like food, energy, housing (specifically shelter costs, which the BLS estimates in part through a measure called owners' equivalent rent), medical care, transportation, and apparel.
It helps to separate two related but distinct phenomena that get casually lumped together as "inflation." The first is a one-time price-level shift, say, a supply shock that makes a specific good permanently more expensive. The second is a sustained inflationary process, where prices across many categories keep rising year over year, often reinforced by expectations: if workers and businesses expect prices to keep rising, they build that expectation into wage demands and pricing decisions, which can itself help sustain the inflation. Economists call this the expectations channel, and central banks pay close attention to it because inflation that becomes "unanchored," meaning the public no longer trusts it will return to a stable, low level, is much harder to bring back down than inflation caused by a single temporary shock.
It's also worth being precise about what inflation is not. It is not the same thing as a rising cost of living in an absolute sense (your personal cost of living can rise even with zero inflation if you buy a bigger house or a nicer car), and it is not the same as a currency's total money supply, though rapid, sustained increases in money supply relative to the real output of goods and services in an economy is one of the mechanisms that can produce inflation over the medium and long run. The relationship between money supply growth and inflation is one of the most debated relationships in macroeconomics; it holds reasonably well over long historical horizons across many countries but is far less reliable for predicting inflation over a given year or two, where other forces, energy prices, supply chains, fiscal policy, wage bargaining, dominate.
How the Consumer Price Index actually measures the erosion
The CPI works by pricing a fixed, representative "basket" of goods and services every month across a large sample of retail outlets, service providers, and rental units in urban areas, then comparing that basket's total cost to its cost in a base period. The BLS updates the basket's composition periodically to reflect how consumer spending patterns actually shift, since people buy relatively fewer VCRs and relatively more streaming subscriptions than they did thirty years ago, and a fixed 1990s-style basket would misrepresent modern household spending (U.S. Bureau of Labor Statistics, CPI Handbook of Methods).
There is a subtlety worth understanding here, because it explains why people sometimes feel the "official" inflation number doesn't match their own experience. The CPI is a weighted average across an entire population's typical spending, but no household spends exactly like the average household. A retiree spending a large share of their budget on medical care and housing experiences a different effective inflation rate than a young renter spending more on transportation and food away from home, even when both face the identical published CPI figure. The BLS itself publishes supplementary indices, like the Chained CPI and CPI for the elderly (CPI-E), partly to address this gap between the headline number and lived experience for specific populations.
One further wrinkle: the CPI attempts to account for quality improvements through a process called hedonic adjustment, so that if a new laptop costs 5 percent more but also has meaningfully better specifications, the CPI tries to isolate how much of that price increase reflects pure inflation versus how much reflects "more product for the money." This methodology is genuinely useful for comparing apples to apples over time, but it is also a recurring point of criticism from economists who argue it can understate the inflation actually felt by consumers, particularly in categories like housing and healthcare where quality adjustments are harder to measure cleanly.
Why a dollar sitting still is a dollar losing ground
Here is the mechanism in its simplest form. If a representative basket of goods costs $100 today and inflation runs at 3 percent annually, that same basket costs $103 in a year, $106.09 the year after (compounding, not simply adding another $3), and so on. A person holding $100 in cash, untouched, can buy the full basket today but falls further behind every year that passes, because their $100 stays fixed while the basket's price keeps compounding upward.
This is why economists insist on the distinction between nominal value and real value. Nominal value is the face amount of money, unadjusted for anything. Real value is that same amount adjusted for what it can actually purchase, after accounting for inflation. A savings account that pays 1 percent nominal interest while inflation runs at 3 percent is not "safely growing your money" in any meaningful economic sense; it is losing roughly 2 percentage points of real purchasing power every year, even as the account statement shows a larger number with each passing month.
The gap between nominal and real returns matters more the longer money sits still, because the erosion compounds exactly like interest does, just in the opposite direction. A short 12-month stretch of 3 percent inflation is barely noticeable in daily life. Twenty or thirty years of the same 3 percent, compounding relentlessly and invisibly, can cut the purchasing power of an unchanged sum by half or more. This is the arithmetic that makes inflation dangerous less because of any single year and more because of what it does to money left untouched across a working lifetime, a retirement, or a multi-decade pension obligation.
The purchasing-power math, laid out year by year
Numbers make this concrete in a way that percentages alone don't. The table below shows what happens to $10,000 held in cash, earning no interest, across four different constant annual inflation rates, calculated using the standard compounding formula (remaining value = original value ÷ (1 + inflation rate)^years). These are illustrative calculations based on constant hypothetical rates, not forecasts of any actual future inflation rate.
| Years elapsed | Real value at 2% inflation | Real value at 4% inflation | Real value at 6% inflation | Real value at 8% inflation |
|---|---|---|---|---|
| 5 years | $9,057 | $8,219 | $7,473 | $6,806 |
| 10 years | $8,203 | $6,756 | $5,584 | $4,632 |
| 20 years | $6,730 | $4,564 | $3,118 | $2,145 |
| 30 years | $5,521 | $3,083 | $1,741 | $993 |
A fixed $10,000 held as idle cash, with no interest earned, loses purchasing power at an accelerating pace as either the inflation rate or the time horizon increases; at 8 percent inflation sustained for 30 years, the original sum's real purchasing power falls below 10 percent of its starting value.
Two things jump out from this table. First, the effect is nonlinear: doubling the inflation rate from 4 percent to 8 percent does not simply double the erosion over 30 years, it roughly triples it, because compounding amplifies small rate differences over long horizons. Second, even the "mild" 2 percent column, which happens to be the Federal Reserve's long-run target rate, still cuts the real value of untouched cash by nearly 45 percent over 30 years. Low, stable inflation is still inflation; it simply erodes purchasing power on a longer, gentler curve rather than a sharp one.
Why does a fixed pension or bond coupon lose value even though the payment never changes?
A fixed payment, whether a pension check, an annuity distribution, or a bond's coupon, delivers the identical nominal dollar figure every period. If prices keep rising while that payment stays flat, the payment buys progressively less each year. This is precisely why some pensions and Social Security benefits build in cost-of-living adjustments (COLAs), specifically to offset this erosion; a bond or annuity without such an adjustment carries what analysts call "inflation risk" baked directly into its structure. Fixed-rate long-term bonds are particularly exposed to this dynamic, which connects to the broader mechanics of how bond prices move with interest rates, since inflation expectations are one of the primary forces that push bond yields around in the first place.
Historical extremes: what happens when inflation runs out of control
Most discussions of inflation in developed economies concern relatively modest annual rates, low single digits to occasionally high single digits. History also offers sharper, more extreme cases that illustrate the same mechanism taken to its limit, and studying them clarifies why central banks treat inflation control as a core mandate rather than a minor policy dial.
The United States lived through a sustained period of elevated inflation combined with high unemployment and weak economic growth during the 1970s, a combination economists label stagflation, a term that itself signals how unusual it was: standard economic models of that era generally assumed high inflation and high unemployment did not coexist for long. Oil price shocks, expansionary monetary policy, and inflation expectations that had become unanchored all contributed to a period where U.S. consumer prices rose sharply across multiple years running, eroding real wages and real savings simultaneously even as the nominal economy kept humming along. The Federal Reserve, under chair Paul Volcker beginning in 1979, responded by raising interest rates aggressively, a policy that succeeded in bringing inflation back down over the following years but also triggered a significant recession, illustrating a recurring tension in monetary policy: the tools that control inflation reliably tend to slow the broader economy in the process.
At the far extreme sits hyperinflation, generally defined by economists as monthly inflation exceeding 50 percent, a threshold at which the ordinary mechanics of a currency effectively break down. The most frequently cited historical case is the Weimar Republic in Germany during the early 1920s, where a combination of war reparations obligations, a currency no longer backed by gold, and government reliance on printing money to cover deficits produced price increases so extreme that prices for everyday goods could rise meaningfully within a single day, and workers reportedly needed to spend wages almost immediately upon receiving them before their value evaporated further. Savings, pensions, and fixed-income holdings denominated in the collapsing currency were effectively wiped out; this episode remains a standard reference point in economics precisely because it shows, in an extreme and well-documented form, the same mechanism described earlier in this article: what a fixed sum of money can buy depends entirely on what happens to prices around it, not on the number printed on the currency itself.
These historical cases are outliers, not typical outcomes, and citing them is not a prediction that any particular economy is headed toward similar territory. They matter here because they demonstrate the mechanism at its most visible: the exact same erosion process that quietly shaves a percentage point or two off a savings account's real value each year is, mathematically, the same process that can unravel an entire currency's usefulness when it runs unchecked.
How central banks try to manage the pace of inflation
In the United States, the Federal Reserve operates under what's often called a dual mandate, set by Congress: promote both maximum sustainable employment and stable prices. The Fed has publicly stated a long-run inflation target of around 2 percent annually, a figure it considers consistent with price stability while leaving enough room to avoid the opposite problem, deflation, a sustained fall in the general price level that carries its own set of economic risks, including delayed consumer spending and rising real debt burdens.
The Fed's primary lever is the federal funds rate, the interest rate at which banks lend reserves to each other overnight. Raising this rate tends to ripple outward through the economy, raising the cost of mortgages, car loans, and business credit, which tends to cool consumer spending and business investment, which in turn tends to slow the pace of price increases. Lowering the rate works in the opposite direction, making borrowing cheaper and generally stimulating spending and investment, which can help counter a slowing economy but also risks pushing inflation higher if pursued too aggressively or held too low for too long.
Other major economies run comparable institutions with similar underlying logic: the European Central Bank, the Bank of England, and the Bank of Japan each set policy rates aimed, at least in part, at price stability, though their specific mandates and target rates differ somewhat by jurisdiction. The International Monetary Fund (IMF) tracks inflation trends across member countries and has repeatedly emphasized that credible, independent central banks with clear inflation targets tend to produce more stable long-run outcomes than those without such frameworks, largely because credible targets help anchor the expectations discussed earlier in this article.
It's worth being explicit about a limitation here: monetary policy works with long and variable lags, meaning a rate change made today may not fully show up in inflation data for a year or more, which makes real-time policy calibration genuinely difficult even for well-resourced, well-staffed central banks. No serious economist claims central banks can fine-tune inflation to an exact number on a predictable schedule.
What people commonly get wrong about inflation
A frequent misunderstanding is treating inflation and "prices going up" as identical in every context, when in fact relative price changes and general inflation are different phenomena. If the price of gasoline rises 20 percent because of a supply disruption while most other prices stay flat, that is a relative price shift within the economy, not necessarily a broad inflationary trend, though sustained energy price increases can feed into broader inflation over time through transportation and production costs.
Another common error is assuming that rising wages automatically cancel out inflation's effects. Wages can, and in a well-functioning labor market often do, adjust to reflect rising living costs, but the adjustment is neither automatic nor guaranteed to be complete or timely. Real wage growth, wages adjusted for inflation, can be flat or even negative during inflationary periods if pay increases lag behind price increases, which is precisely what happened for many workers during stretches of the 1970s described above.
A third misconception treats all assets as equally protected from inflation, or conversely, assumes no asset offers any protection. Neither extreme holds up historically. Different asset classes have behaved differently across historical inflationary periods for reasons tied to their underlying economics, cash and fixed-rate bonds have generally lost real value during sustained inflation because their nominal payouts don't adjust upward with prices, while assets whose income or replacement cost tends to move with the general price level, certain real assets and equities in aggregate over long horizons, have shown more variable but sometimes more resilient real returns across history. This is a description of historical patterns across long periods and broad asset categories, not a recommendation, prediction, or guarantee about how any specific asset will perform during any future inflationary period; every asset class carries its own risks, and past behavior during previous inflationary episodes doesn't guarantee similar behavior in the future.
Finally, people sometimes assume a low, stable inflation rate like 2 percent is functionally the same as no inflation at all, because the year-to-year change feels negligible. The purchasing-power table earlier in this article shows why that assumption breaks down over time horizons that matter for retirement planning, pension design, or multi-decade savings goals: even 2 percent, compounded across three decades, meaningfully changes what a fixed sum of money can buy.
What is the difference between nominal and real returns?
Nominal return is the stated percentage gain on an account or investment, unadjusted for anything. Real return subtracts the inflation rate from the nominal return, showing the actual change in purchasing power. A savings account paying 1 percent nominal interest during 3 percent inflation delivers a real return of roughly negative 2 percent, meaning the account is losing purchasing power even as its stated balance grows.
Why this matters for long-term financial planning
Understanding inflation's mechanics changes how people evaluate financial decisions across long time horizons, from building an emergency fund to comparing fixed-rate savings against other options. Money held in cash or in accounts paying interest below the inflation rate faces a predictable, mathematically certain erosion in real value over time, which is one reason financial planning discussions weigh the tradeoff between the stability of cash-equivalent holdings and the historical tendency of other asset classes to outpace inflation over long periods, understanding that such historical patterns are not guarantees and every option carries its own risk profile, including the possibility of loss.
This is also why concepts like diversification, index investing, and understanding how compound growth works in reverse (as erosion) tend to appear together in personal finance education: they are different facets of the same underlying question, how does a fixed amount of money change in real, purchasing-power terms across time, whether that change comes from earning a return, from inflation eating into value, or from some combination of both happening simultaneously. None of this article should be read as a recommendation to hold, avoid, or select any specific account, fund, or asset; the goal here is understanding the mechanism, not prescribing a response to it, and any decisions about savings, investments, or retirement planning are highly personal and depend on factors, timelines, risk tolerance, and obligations, that a general educational article cannot account for.
The takeaway
Inflation doesn't announce itself with a single dramatic event in most economies; it works through small, repeated, compounding price increases that are individually forgettable but collectively powerful over a decade, twenty years, or a working lifetime. The core distinction that makes this understandable, nominal value versus real, purchasing-power-adjusted value, applies identically whether you're evaluating a savings account, a pension, a bond, or cash sitting in a drawer. Extreme historical episodes like 1970s stagflation and Weimar-era hyperinflation aren't cautionary tales about the future; they're clarifying examples of a mechanism that operates, at much gentler intensity, in every modern economy every year. This article is educational and does not constitute financial, investment, or tax advice; individual circumstances vary substantially, and readers making decisions about savings, retirement, or investments should consult a licensed financial professional.
Read next:
- How Bond Prices Move With Interest Rates
- How Index Funds Track Markets
- How Credit Scores Estimate Risk
FAQ
Q: What does the Consumer Price Index actually measure?
The CPI, published monthly by the U.S. Bureau of Labor Statistics, tracks changes in the average cost of a fixed, representative basket of goods and services that consumers typically purchase, including food, housing, medical care, and transportation. It is the standard reference measure used to report inflation in the United States, though the BLS also publishes supplementary indices for specific populations.
Q: What is the difference between nominal and real returns?
Nominal return is the stated percentage gain on an account or investment, unadjusted for anything. Real return subtracts the inflation rate from the nominal return, showing the actual change in purchasing power, which can be negative even when the nominal return is positive.
Q: Why does inflation hurt fixed-income payments like pensions or bonds more over time?
A fixed payment delivers the same nominal dollar amount each period regardless of what happens to prices. If prices keep rising while the payment stays flat, that fixed amount buys less every year. Some pensions and Social Security benefits include cost-of-living adjustments specifically to offset this effect.
Q: What inflation rate does the Federal Reserve aim for?
The Federal Reserve has publicly stated a long-run target of around 2 percent annual inflation, which it considers consistent with its dual mandate of promoting price stability and maximum sustainable employment.
Q: Is 2 percent inflation basically the same as no inflation?
No. While a single year of 2 percent inflation is barely noticeable, compounding that rate over 20 to 30 years meaningfully reduces the purchasing power of any fixed sum of money, cutting it by roughly a third to nearly half depending on the exact time horizon.
Q: What was hyperinflation in the Weimar Republic, and why is it still cited today?
The Weimar Republic experienced extreme hyperinflation in the early 1920s, driven by war reparations obligations, an unbacked currency, and government reliance on printing money to cover deficits. Prices rose so fast that savings and fixed incomes lost nearly all real value. Economists still cite it as the clearest historical illustration of what unchecked currency devaluation does to purchasing power.
Follow new articles
Add SciHub101 to your feed reader to see new science and technology stories.
About the Author
SciHub101 is an independent science and technology publication founded and edited by Buğra Sözeri, a software engineer and app developer based in Türkiye. AI tools assist with drafting and research. Source documentation in the existing archive is uneven, and articles are being reviewed and corrected. The Editorial Team byline identifies editorial responsibility; it does not certify specialist or independent human review. Where we compare products, anything built by our own team is labelled as such — see the editorial guidelines and About page for how corrections and disclosures work.
Related Articles


Why Currencies Lose Value
Currencies lose value through inflation, money supply growth, weak productivity, debt stress, trade imbalances, and loss of trust in the issuer.
Countries With the Highest Inflation Rates: How to Compare the Data
Inflation rankings change quickly and depend on the measure. This guide explains CPI, headline versus core inflation, food and energy shocks, currency depreciation, central-bank policy and why a lower rate does not mean prices fell.

Why Interest Rates Affect Everything
Interest rates influence mortgages, stocks, currencies, hiring, inflation, government debt, and startup funding. This guide explains the transmission mechanism.

How Inflation Works — and Why It's So Hard to Stop
Inflation is hard to stop because it feeds itself: rising prices push workers to demand higher wages, which push prices higher still. Here's the full mechanism — the wage-price spiral, self-fulfilling expectations, and why central bank tools work with long and variable lags.