How the Stock Market Works: A Complete Guide
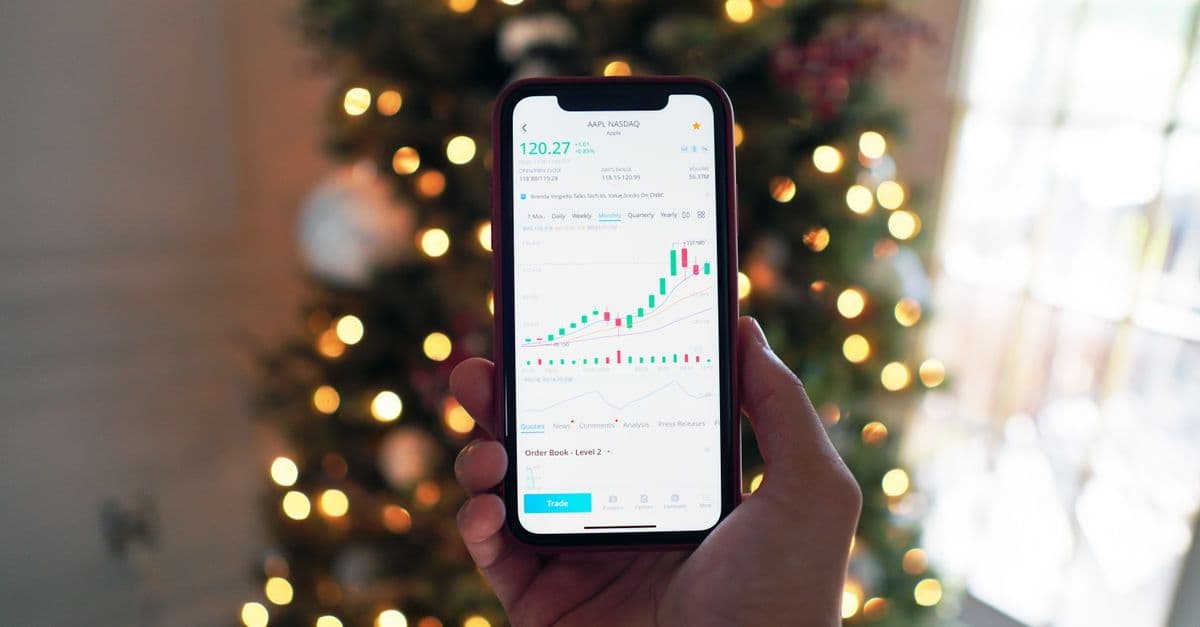
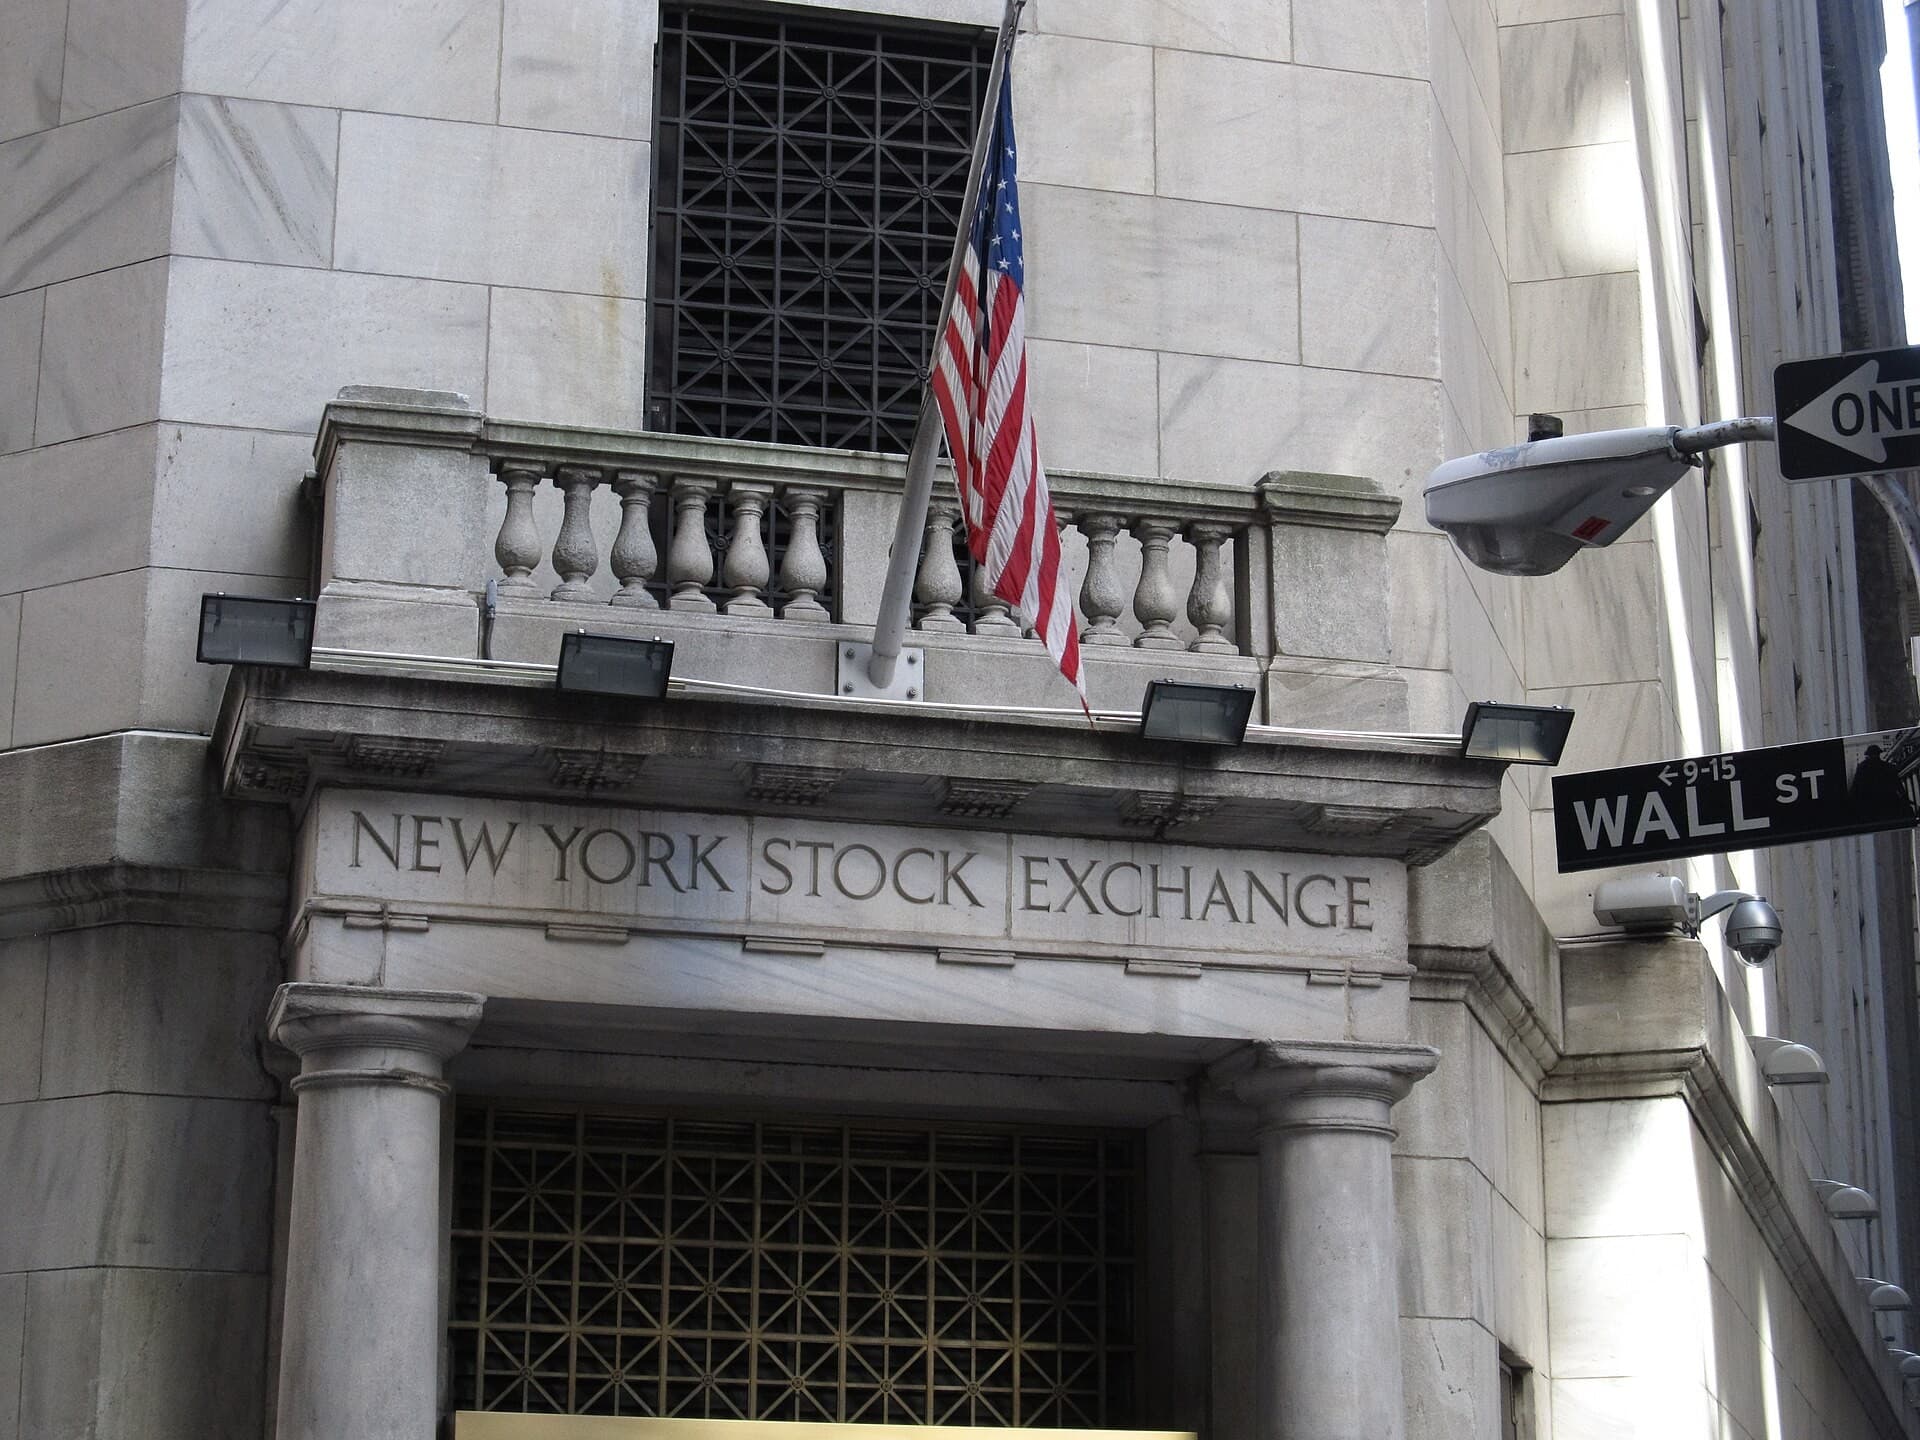
Photo: Joshua Mayo / Pexels
The stock market moves trillions of dollars every day, shapes retirements, and sits at the center of modern capitalism. Yet most people who have money in it — through a 401(k), an IRA, or a brokerage account — have only the haziest idea of how any of it actually works. This guide cuts through the jargon to explain the mechanics, the economics, and the hard evidence behind what the stock market is, how trades happen in milliseconds, why prices move, and how ordinary investors should think about all of it. For the broader picture of how money works, see the Complete Finance Guide 2026.
Educational only — not financial advice. Investing involves risk of loss; past performance does not guarantee future results. Consult a licensed financial advisor before making investment decisions.
What a Stock Actually Is
A share of stock is not a lottery ticket, a number on a screen, or an abstract bet on sentiment. It is a fractional ownership stake in a real business. When Apple has roughly 15 billion shares outstanding and you own 100 of them, you own approximately one 150-millionth of Apple — its factories, intellectual property, cash on hand, and future earnings.
That ownership stake carries three concrete rights:
- Voting rights. Common shareholders vote on board directors and major corporate decisions. One share typically equals one vote (though some companies issue dual-class shares that give founders super-voting power).
- Dividends. If the company distributes profits, you receive your proportional share. Dividend payments are discretionary — the board can cut or suspend them — which distinguishes stocks from bonds, where interest payments are contractual obligations.
- Residual claim on assets. If the company is liquidated, shareholders receive whatever remains after all debts and preferred claims are paid. In bankruptcy this often means common shareholders get nothing, which is why credit risk matters.
This is the foundational idea that everything else flows from: a stock's fair price is whatever the future cash flows it entitles you to are worth in today's dollars. Everything else — charts, sentiment, news — either reflects that reality or departs from it temporarily.
How Exchanges Work: The Market Microstructure
The New York Stock Exchange (NYSE) opened in 1792 under a buttonwood tree on Wall Street. NASDAQ, founded in 1971, was the first fully electronic exchange. Today both are overwhelmingly electronic, though the NYSE retains human specialists called Designated Market Makers (DMMs) for certain functions.
The Order Book and the Bid-Ask Spread
Every listed stock has a continuously updated order book — a ranked list of every outstanding buy order (bids) and sell order (asks). The highest bid and the lowest ask define the bid-ask spread.
If Apple is quoted at $195.00 bid / $195.02 ask, a market order to buy executes immediately at $195.02. A market order to sell executes at $195.00. The $0.02 difference is the spread — effectively a transaction cost that goes to market makers, the firms that stand ready to buy and sell continuously to provide liquidity.
How a Trade Executes in Milliseconds
When you click "buy" in your brokerage app, a chain of events happens in roughly 50–500 microseconds:
- Your broker routes the order to an exchange or an alternative trading system.
- The exchange matching engine compares your order against the order book.
- If a matching sell order exists at your price or better, the trade executes.
- Clearing (legal transfer of ownership) is handled by the DTCC and settles T+1 (one business day later).
High-frequency trading firms (HFTs) co-locate servers inside exchange data centers to shave microseconds off this process. Academic research is divided on whether HFTs harm or benefit ordinary investors — they tighten spreads but also engage in strategies like latency arbitrage that extract small rents from slower participants (Budish, Cramton & Shim, 2015).
IPOs: How Companies Go Public
A privately held company raises money from IPO (Initial Public Offering) when it sells shares to the public for the first time. The process typically works like this:
- Underwriters (investment banks such as Goldman Sachs or Morgan Stanley) are hired to manage the offering. They conduct due diligence, prepare the S-1 registration statement filed with the SEC, and market the shares.
- Book building. Underwriters canvass institutional investors to gauge demand at various price points. This price discovery process sets the IPO price.
- Lock-up period. Insiders — founders, early investors, employees — are barred from selling their shares for typically 90–180 days post-IPO. This prevents an immediate flood of insider supply from collapsing the price.
- First-day trading. Once shares hit the exchange, supply and demand among public investors determines the price. Average first-day IPO pops of 15–20% suggest underpricing is common — a form of underwriter insurance to ensure deals succeed (Ritter & Welch, 2002).
SPAC alternative. Special Purpose Acquisition Companies (SPACs) are shell companies that raise money through an IPO and then merge with a private company, taking it public without the traditional roadshow. SPACs were heavily used in 2020–2021; evidence suggests they deliver inferior long-run returns to traditional IPOs on average (Klausner, Ohlrogge & Ruan, 2022).
Stock Valuation: What Is a Share Worth?
Price-to-Earnings Ratio
The P/E ratio divides a stock's price by its annual earnings per share. A stock at $100 with $5 in earnings per share has a P/E of 20, meaning investors pay $20 for every $1 of current earnings. The inverse — $1/$20 = 5% — is the earnings yield, directly comparable to a bond's yield. Historically the S&P 500 has traded at a P/E of roughly 15–17 in "normal" environments.
Robert Shiller's CAPE ratio (Cyclically Adjusted P/E) smooths earnings over 10 years to remove cyclical noise. Shiller showed that high CAPE predicts lower subsequent 10-year returns — a finding that has held up out-of-sample (Shiller, 2000). As of early 2026, the US CAPE is elevated by historical standards, which implies muted long-run expected returns — though CAPE is a terrible short-term timing tool.
Discounted Cash Flow (DCF)
The theoretically correct value of any asset is the sum of its future cash flows, discounted back to present value at an appropriate rate. A company expected to generate $100 million in free cash flow per year indefinitely, with a 10% discount rate, is worth $1 billion. DCF makes explicit that stocks are claims on future cash flows, not past ones — which is why growth companies with no current earnings can still have rational positive prices.
The discount rate incorporates the risk-free rate (US Treasury yield) plus an equity risk premium, typically estimated at 4–6% for US equities historically (Damodaran, 2024).
Market Indices: The Scoreboards
S&P 500
The S&P 500 tracks 500 of the largest publicly traded US companies by market capitalization (price × shares outstanding). It is market-cap weighted — Apple, Microsoft, and Nvidia together constitute a large fraction of the index. When people say "the market is up 1%," they usually mean the S&P 500 is up 1%. It is the benchmark against which nearly all active fund managers are measured.
Dow Jones Industrial Average
The Dow tracks just 30 large US companies and is price-weighted — a $500 stock has five times the index impact of a $100 stock regardless of the companies' actual sizes. This is a historical artifact from the pre-computer era when price weighting was easier to calculate by hand. The Dow is less representative than the S&P 500 and should be treated as a cultural artifact more than a precise economic signal.
NASDAQ Composite
The NASDAQ Composite includes all ~3,300 stocks listed on the NASDAQ exchange, which skews heavily toward technology. It is more volatile than the S&P 500 and a useful proxy for tech-sector sentiment.
The Efficient Market Hypothesis
In 1970, Eugene Fama published his landmark paper formalizing the Efficient Market Hypothesis (EMH), earning him a Nobel Prize in 2013. EMH states that asset prices fully reflect all available information. Fama identified three forms:
- Weak form: Prices reflect all past price data. Technical analysis (chart reading) cannot consistently beat the market.
- Semi-strong form: Prices reflect all publicly available information. Fundamental analysis using public data cannot consistently beat the market.
- Strong form: Prices reflect all information including insider knowledge. (This form is generally rejected — insider trading laws exist for good reason.)
The practical implication of semi-strong efficiency is stark: if markets rapidly incorporate all public information into prices, stock picking based on publicly available analysis should not work. The evidence broadly supports this. SPIVA data consistently shows that over 10-year horizons, 80–90% of active US large-cap mutual fund managers underperform the S&P 500 index after fees. Over 20 years, the underperformance rate exceeds 90%.
Behavioral Finance: The Complications
Fama's EMH was challenged by Robert Shiller and others in the 1980s and 1990s. Markets show patterns that are hard to reconcile with pure efficiency:
- The CAPE / return predictability anomaly. Shiller (1981) showed that stock prices fluctuate far more than the underlying dividends that justify them — excess volatility inconsistent with a purely rational market.
- Momentum. Stocks that have outperformed recently tend to continue outperforming over the next 6–12 months (Jegadeesh & Titman, 1993). Pure efficiency predicts no such pattern.
- The value premium. Cheap stocks (high book-to-market ratio) have historically outperformed expensive stocks. Fama and French (1992) documented this anomaly. Fama reframed it as compensation for risk; Shiller argued it reflects mispricing. The debate continues.
- Overreaction and herding. Investors systematically overreact to recent news, creating bubbles (dot-com 2000, housing 2007) and crashes that overshoot fundamental value.
The honest answer is that markets are largely — but not perfectly — efficient. Persistent, risk-adjusted outperformance after fees is rare and difficult to sustain.
Why Markets Go Up Long-Term
Equity markets have returned roughly 7% per year in real (inflation-adjusted) terms over the past century in the US (Dimson, Marsh & Staunton, 2002). The long-run drivers are:
- Productivity growth. Technological progress increases output per worker, expanding corporate earnings.
- Earnings growth. As economies grow, corporate profits grow with them.
- Inflation. Nominal stock prices rise with inflation because companies earn nominal revenues.
- Retained earnings compounding. Reinvested profits generate future profits, creating a compounding effect.
This is not a law of nature — it reflects the specific economic conditions of a growing, innovative economy. Investors in Japan's Nikkei 225 waited 34 years to recover their 1989 peak. Diversification across countries and asset classes matters.
Crashes: 2008 and 2020
2008: The Anatomy of a Financial Crisis
The 2008 crisis was not simply a stock market crash — it was a systemic liquidity crisis rooted in the mortgage market. The chain:
- US banks issued subprime mortgages to borrowers who couldn't afford them.
- These mortgages were pooled into Mortgage-Backed Securities (MBS) and then into Collateralized Debt Obligations (CDOs), with risk tranches rated by agencies that used flawed models.
- CDO-squared instruments pooled CDO tranches, spreading toxic risk throughout the global financial system.
- Credit Default Swaps (CDS) — insurance contracts on bond defaults — were sold in vast quantities by firms like AIG without adequate capital reserves.
- When housing prices fell, defaults cascaded. Trust between banks evaporated. Lehman Brothers collapsed in September 2008. Credit markets froze.
The S&P 500 fell 57% from peak to trough. Recovery to prior highs took until 2013.
2020: COVID Crash and Record Recovery
The fastest bear market in history: the S&P 500 fell 34% in 33 days (February–March 2020). The recovery was equally dramatic — the market hit new all-time highs by August 2020. Drivers of recovery: unprecedented Federal Reserve intervention, massive fiscal stimulus, and investor bets on a vaccine-enabled economic reopening that proved correct.
The COVID crash illustrates mean reversion — markets tend to recover from crashes over time as long as the underlying economy remains intact. Investors who panic-sold at the bottom locked in permanent losses.
Investment Vehicles: Comparison Table
| Vehicle | Diversification | Cost (typical expense ratio) | Liquidity | Best For |
|---|---|---|---|---|
| Individual stocks | Low (single company) | $0 commission + bid-ask spread | High (real-time) | Experienced investors, concentrated bets |
| Index ETFs (e.g., VOO, SPY) | High (500+ companies) | 0.03–0.20% | High (real-time) | Most investors — low-cost, diversified |
| Active mutual funds | High | 0.50–1.20% | Once daily (NAV) | Investors who believe in manager skill |
| Bonds | Low correlation to equities | 0.03–0.50% (bond ETFs) | High | Income, capital preservation, rebalancing anchor |
| REITs | Real estate exposure | 0.10–0.50% (ETFs) | High | Real estate without direct ownership |
| Target-date funds | Very high (stocks + bonds + rebalancing) | 0.10–0.15% | Once daily | Hands-off retirement savers |
For most investors, a low-cost index fund in the S&P 500 or a total world index is difficult to improve upon after accounting for fees, taxes, and behavioral errors.
Compound Interest: The Math of Long-Term Investing
The Rule of 72 states that dividing 72 by an annual return gives the approximate years to double your money. At 7% real return: 72 ÷ 7 ≈ 10.3 years to double.
At 7% real return:
- $10,000 invested at age 25 becomes ~$20,000 by 35, ~$40,000 by 45, ~$80,000 by 55, ~$160,000 by 65.
- The same $10,000 invested at age 45 grows to only ~$40,000 by 65.
Time in the market — not timing the market — is the most powerful variable available to an ordinary investor.
The Index Fund Revolution
In 1975, John Bogle founded Vanguard and launched the first index fund available to retail investors — the Vanguard 500 Index Fund. Wall Street mocked it as "Bogle's Folly." It is now one of the largest funds in the world.
Bogle's core argument was simple and devastating: every dollar of outperformance by one investor must come from underperformance by another. After fees, active management is mathematically a losing proposition in aggregate. The S&P 500 returns whatever the economy produces; active managers fight over the remainder after taking fees.
Passive indexing now represents over 50% of US mutual fund and ETF assets. The shift has saved ordinary investors hundreds of billions of dollars in fees over 50 years.
Common Investor Mistakes
- Timing the market. Missing the 10 best days in any 20-year period typically cuts returns by more than half. The best days often occur near the worst days — panic sellers miss both.
- Panic selling. Selling after a crash converts a paper loss into a permanent one and requires being right twice: when to sell and when to buy back.
- Overtrading. Each trade incurs costs. Dalbar's annual studies consistently show individual investors underperform the funds they invest in because they buy and sell at the wrong times.
- Ignoring fees. A 1% annual fee difference compounds to a 26% difference in wealth over 30 years.
- Home country bias. US investors tend to over-concentrate in US stocks. International diversification reduces idiosyncratic country risk.
- Confusing volatility with risk. Stocks are volatile short-term but have outperformed every other major asset class over long horizons. For long-horizon investors, the real risk is insufficient growth, not short-term drawdowns.
FAQs
Q: Is the stock market the same as the economy? A: No. The stock market reflects expectations about future corporate earnings, while GDP measures current economic output. The market often diverges from the economy — it fell sharply in early 2020 before the worst economic data arrived and recovered while unemployment was still high.
Q: What is a market cap and why does it matter? A: Market capitalization is share price multiplied by total shares outstanding. It measures a company's total market value. S&P 500 index weights are proportional to market cap, so larger companies have more index influence.
Q: Can you consistently beat the market? A: The evidence says very few can do so after fees over long periods. SPIVA data shows 80–90% of active US large-cap managers underperform their benchmark over 10+ years. The minority who outperform show limited persistence — past outperformance predicts future outperformance weakly at best.
Q: What causes a stock market crash? A: Crashes result from a combination of overvaluation, leverage, and a triggering event that forces rapid deleveraging. The 2008 crash was driven by mortgage-backed securities and CDO implosions; the 2000 crash by dot-com overvaluation; the 2020 crash by pandemic uncertainty. All three eventually recovered.
Q: How much of my portfolio should be in stocks? A: The classic rule is "110 minus your age" in stocks (e.g., 80% stocks at age 30). A better framework is your time horizon and loss tolerance — if you can't sleep when the market drops 40%, you likely have too much in equities regardless of age.
Q: What is short selling? A: Short selling involves borrowing shares, selling them, and hoping to buy them back at a lower price later to profit from a decline. Short sellers can lose theoretically unlimited amounts if the stock rises instead of falls. They perform a useful function by betting against overvalued companies.
Q: What is the difference between a stock and a bond? A: Stocks are ownership stakes with variable returns tied to company performance. Bonds are loans to a company or government that pay fixed interest and return principal at maturity. Bonds rank senior to equity in bankruptcy, making them safer but with lower expected returns. See understanding bonds and fixed income for a deeper comparison.
Q: What is dollar-cost averaging? A: Dollar-cost averaging (DCA) means investing a fixed amount at regular intervals regardless of market price. It removes the temptation to time the market and automatically buys more shares when prices are low. Evidence shows lump-sum investing outperforms DCA on average when you have a sum to invest, but DCA reduces regret and behavioral error for most people. See dollar-cost averaging vs lump sum investing for a full comparison.
Key Takeaways
- A stock is fractional ownership of a business — not a piece of paper or a bet.
- Exchanges match buyers and sellers in microseconds via electronic order books; the bid-ask spread is the market maker's fee.
- IPOs take companies public through underwriting, book building, and a lock-up period.
- Stock valuation Eventually, rests on discounted future cash flows; P/E and CAPE are shorthand metrics.
- The S&P 500 is market-cap weighted and the standard benchmark; the Dow Jones is a historical artifact.
- Eugene Fama's efficient market hypothesis explains why most active managers underperform after fees; behavioral finance explains why markets still over- and under-shoot.
- Compound interest at 7% real return doubles purchasing power every ~10 years.
- John Bogle's index fund revolution has saved ordinary investors trillions in fees.
- The most common and costly mistakes are panic selling, overtrading, and ignoring fees.
Sources
- Fama, E. F. (1970). Efficient capital markets: A review of theory and empirical work. Journal of Finance, 25(2), 383–417.
- Shiller, R. J. (1981). Do stock prices move too much to be justified by subsequent changes in dividends? American Economic Review, 71(3), 421–436.
- Shiller, R. J. (2000). Irrational Exuberance. Princeton University Press.
- Fama, E. F., & French, K. R. (1992). The cross-section of expected stock returns. Journal of Finance, 47(2), 427–465.
- Malkiel, B. G. (1973). A Random Walk Down Wall Street. W. W. Norton.
- Jegadeesh, N., & Titman, S. (1993). Returns to buying winners and selling losers. Journal of Finance, 48(1), 65–91.
- Ritter, J. R., & Welch, I. (2002). A review of IPO activity, pricing, and allocations. Journal of Finance, 57(4), 1795–1828.
- Budish, E., Cramton, P., & Shim, J. (2015). The high-frequency trading arms race. Quarterly Journal of Economics, 130(4), 1547–1621.
- Klausner, M., Ohlrogge, M., & Ruan, E. (2022). A sober look at SPACs. Yale Journal on Regulation, 39(1).
- Dimson, E., Marsh, P., & Staunton, M. (2002). Triumph of the Optimists: 101 Years of Global Investment Returns. Princeton University Press.
- Damodaran, A. (2024). Equity risk premiums: Determinants, estimation, and implications. NYU Stern School of Business working paper.
- SPIVA U.S. Scorecard (2024). S&P Dow Jones Indices.
Read next:
Follow new articles
Add SciHub101 to your feed reader to see new science and technology stories.
About the Author
SciHub101 is an independent science and technology publication founded and edited by Buğra Sözeri, a software engineer and app developer based in Türkiye. AI tools assist with drafting and research. Source documentation in the existing archive is uneven, and articles are being reviewed and corrected. The Editorial Team byline identifies editorial responsibility; it does not certify specialist or independent human review. Where we compare products, anything built by our own team is labelled as such — see the editorial guidelines and About page for how corrections and disclosures work.
Related Articles

Compound Interest Explained — The 8th Wonder
How compound interest works, the Rule of 72, simple vs compound math, and why starting early beats investing more later.
How Cryptocurrency Works — Beyond Bitcoin
A balanced guide to how cryptocurrency actually works: Bitcoin, Ethereum, stablecoins, wallets, exchanges, and real use cases vs hype.
How Stock Market Crashes Happen
Stock market crashes are not random events. They follow a mechanical sequence: valuations stretch on borrowed money, a trigger breaks confidence, and forced selling feeds on itself until buyers disappear.
Value vs Growth Investing — Which Style Wins?
Value vs growth investing compared: definitions, the Fama-French value premium, why value lagged before 2021, 2022's reversal, value traps, and style tilts.

What Is the Stock Market — and How Does It Actually Work?
What a share really is, how exchanges match buyers and sellers, how prices are set, what indices measure, why crashes happen, and how regulators keep the system running. Here's how stock markets actually work.
Complete Finance Guide 2026 — How Money Really Works
The complete guide to finance in 2026: how money, inflation, and central banks work, investing fundamentals, markets, cryptocurrency, and personal finance explained.