Web App Monitoring Tools 2026 — Sentry & Datadog Picks
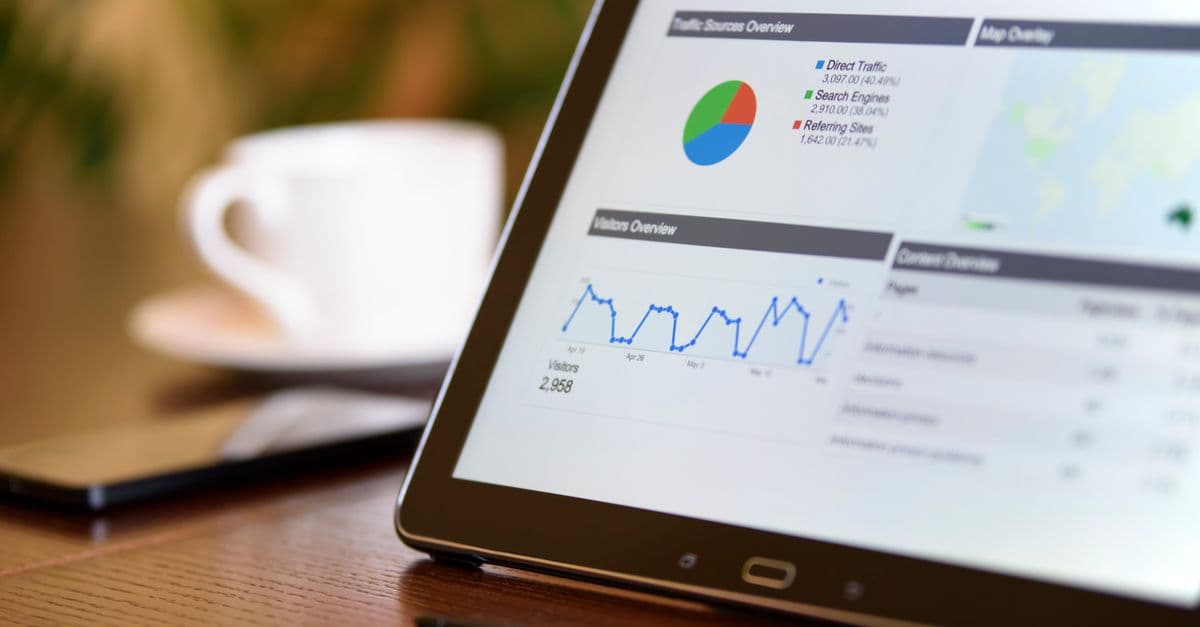
Photo: AS Photography / Pexels
Your app is probably broken for some user right now, and without monitoring you will not find out until they complain or leave. Web app monitoring tools split into four jobs: error tracking, performance measurement, uptime checks, and logs. Some products do several of these, and others do one well. This article explains what each job does, which tools cover it, what they cost at list price as of October 2026, and how to set up alerts that wake you only when it matters.
What a production app needs to watch
Monitoring answers four different questions, and one tool rarely answers all of them equally well.
| Pillar | Question it answers | Typical signal |
|---|---|---|
| Errors | What broke, and for whom? | Stack traces, grouped by cause |
| Performance | How slow is it for real users? | Page-load metrics, request latency percentiles |
| Uptime | Can the outside world reach it? | Pass/fail checks from external locations |
| Logs | What happened, in order? | Timestamped event records |
A fifth signal, traces, follows one request as it moves through several services, and it is what lets you see which hop was slow. OpenTelemetry, the open standard for collecting this data, currently defines four signals: traces, metrics, logs, and baggage (context passed along with the others). Events and profiles are listed as still in development.
Think of it like a car dashboard. The check-engine light is error tracking, the speedometer is performance, the "can I even start it" test is uptime, and the trip computer's history is the logs. Each is useless as a replacement for the others.
The 30-second answer
If you are choosing today, this table is the shortest honest guide. It is not a ranking; it matches a situation to a starting point.
| Your situation | Start with | Add later |
|---|---|---|
| Solo developer or small startup | Sentry free plan plus a free uptime monitor | Logs, once you have a bug that needs them |
| Small SaaS team with on-call duty | Sentry Team, uptime checks, an on-call tool | Core Web Vitals tracking, a status page |
| Many services and hosts | Datadog or New Relic for infrastructure and APM | SLO tracking, custom metrics |
| Strict data-residency or privacy rules | Self-hosted Sentry, or Grafana-based stack | OpenTelemetry for portability |
| Cost-sensitive, high log volume | Loki-style label-indexed logging | Sampling and retention rules |
The rest of this article explains why those pairings make sense.
Error tracking: the first thing to install
An error tracker captures exceptions from your code, bundles repeats together, and shows the stack trace and context. Sentry groups similar events into one "issue" using a fingerprint, so you see one bug and how many users hit it, not 4,000 identical emails. That grouping is the feature that makes error tracking usable.
Sentry
Sentry's free Developer plan, as listed in October 2026, includes 5,000 errors, 5 million tracing spans, 50 session replays, and 5 GB of logs per month for one user, with 30 days of data lookback. The Team plan is $29 monthly ($26 on annual billing) and the Business plan is $89 monthly ($80 annual). Both paid tiers list 50,000 errors a month. Check the live pricing page, since quotas and prices change.
Setup for a Next.js app takes one command. Sentry's docs recommend running its wizard, which configures the client, server, and edge runtimes:
npx @sentry/wizard@latest -i nextjs
The client configuration is short. The documented example samples 10% of traces in production and 100% in development:
// instrumentation-client.ts
import * as Sentry from "@sentry/nextjs";

Sentry.init({
  dsn: "https://<key>@o<orgId>.ingest.sentry.io/<projectId>",
  tracesSampleRate: process.env.NODE_ENV === "development" ? 1.0 : 0.1,
});
Sampling matters because tracing every request is both expensive and unnecessary. A 10% sample still gives you a statistically useful picture of latency, provided your traffic is high enough.
For a Python backend, the FastAPI integration turns on automatically when the fastapi package is installed, so the basic setup is only the init call:
import sentry_sdk

sentry_sdk.init(
    dsn="https://<key>@o<orgId>.ingest.sentry.io/<projectId>",
    traces_sample_rate=0.1,
)
One setting deserves attention. In the Python SDK, personal data such as user IDs, cookies, authorization headers, and IP addresses is excluded unless send_default_pii is set to True. The Next.js SDK documents the opposite default for some data: by its own description, it sends user identity data and HTTP bodies and query parameters unless you configure otherwise, filtering keys such as password and auth. Read the privacy section of the docs before launching anything that handles health, payment, or children's data.
Custom spans
To time a specific business action, such as a payment, wrap it in a span. The current Next.js API is Sentry.startSpan, which ends the span automatically when the callback finishes and marks it failed if the callback throws:
import * as Sentry from "@sentry/nextjs";

const result = await Sentry.startSpan(
  { name: "Charge payment", op: "payment.charge" },
  async (span) => {
    span.setAttribute("payment.provider", "stripe");
    return await chargeCustomer(order);
  },
);
Older tutorials show a startTransaction call instead. Treat any example you find online with suspicion if it predates the span-based API, and check the SDK version it was written for.
Other error trackers
Bugsnag and Rollbar cover the same core job as Sentry, with different interfaces and pricing. LogRocket combines error reporting with session replay, which lets you watch what a user did before the failure. Replay is valuable for front-end bugs that are hard to reproduce, though it raises privacy questions, since you are recording user sessions. Compare current prices on each vendor's own page, because per-seat and per-session models differ and change often.
Performance monitoring: what users actually feel
Performance monitoring has two halves. Real user monitoring (RUM) measures page loads in actual browsers. Application performance monitoring (APM) measures what your servers do: request latency, database queries, calls to other services.
Core Web Vitals
Google's Core Web Vitals are the standard front-end yardstick. The "good" thresholds, per Google's web.dev documentation, are:
| Metric | Measures | Good |
|---|---|---|
| Largest Contentful Paint (LCP) | Loading speed | 2.5 seconds or less |
| Interaction to Next Paint (INP) | Responsiveness | 200 milliseconds or less |
| Cumulative Layout Shift (CLS) | Visual stability | 0.1 or less |
A page passes if it meets all three at the 75th percentile of page loads, measured separately for mobile and desktop. INP became a stable Core Web Vital in 2024 and replaced First Input Delay (FID). Many older guides still list FID, and some give 100 ms as the interaction target, which is not the current threshold.
The 75th-percentile rule is worth understanding. It means that one in four visits can be worse than the target and you still pass. A site that feels fine on your fast laptop can fail at the 75th percentile on mid-range phones over a weak connection, which is why field data from real users beats lab tests alone. Our guide to web performance optimization covers fixes, and why web performance affects SEO covers the ranking angle.
RUM tools include Sentry's performance features, Datadog RUM, New Relic's browser agent, and, for sites hosted there, Vercel Analytics. Whichever you pick, send the data segmented by device and country, since averages hide the users who suffer most.
Percentiles, not averages
Google's Site Reliability Engineering book makes a point that applies to every latency chart you will ever read: averages hide slow outliers. A service can look healthy by its mean response time while a long tail of requests is far slower. High percentiles such as the 99th show a plausible worst case, while the median reflects the typical request.
An analogy: average commute time tells you nothing about the morning the bridge closed. The 99th percentile is the morning the bridge closed.
Backend APM
Datadog APM, New Relic, Honeycomb, and Grafana's stack all trace requests through servers and databases. The practical value is finding where time goes. A slow endpoint is often a slow query, and our explainer on why database indexes speed up queries shows one of the most common fixes.
Honeycomb is built around high-cardinality data, meaning fields with very many distinct values, such as user IDs. That design suits debugging a problem that affects one customer in ten thousand. Datadog is broader, bundling infrastructure, logs, and APM in one product, which is convenient and can get expensive.
Uptime monitoring: checking from the outside
An uptime monitor requests your URL on a schedule from outside your network and alerts you when the response is wrong or missing. It catches the failures your own error tracker cannot see, such as a DNS mistake, an expired certificate, or a crashed server that never got the chance to report its own death.
Current free and paid options, from the vendors' pricing pages in October 2026:
| Tool | Free tier | Paid entry point |
|---|---|---|
| UptimeRobot | 50 monitors, 5-minute checks | Solo plan at $10 monthly ($9 annual), 60-second checks |
| Better Stack | 10 monitors and heartbeats, 1 status page | Additional 50 monitors for $25 monthly |
| Sentry | 1 uptime monitor on the Developer plan | Extra uptime alerts at $1.00 each |
UptimeRobot's own page describes its free plan as good for hobby and non-profit projects, so read its terms before using it for a business. Better Stack's page says check frequency goes as low as 30 seconds.
What to check
A homepage check tells you the server is up, and little else. Better coverage looks like this:
- The homepage and one deep page that touches the database
- A health-check endpoint that actually queries your database and cache
- Your login flow and your checkout or core action
- TLS certificate expiry, so you learn about it weeks before it matters
- Third-party dependencies you rely on, such as a payment webhook
Alert only after two or more consecutive failures, and check from several regions, so one network blip does not wake anyone. Our piece on why webhooks fail silently covers the hardest case, where nothing crashes and messages simply stop arriving.
A public status page is the other half of uptime tooling. It tells customers you know about the problem, which cuts support tickets during an incident. Better Stack includes one status page on its free plan.
Logs: the record of what happened
Logs answer "what happened, in order" once another signal tells you something is wrong. They are also the signal most likely to blow up your bill, because volume grows with traffic and with every developer who adds a debug line.
What logs cost
| Service | Listed price (October 2026) |
|---|---|
| Better Stack | 3 GB per month included with 3-day retention; ingestion $0.10 per GB (Europe) or $0.15 (US) |
| Datadog | $0.10 per ingested GB; indexing $1.70 per million events with 15-day retention (annual billing) |
| Sentry | 5 GB per month on the free plan; extra logs $0.50 per GB |
Datadog's model illustrates a common pattern: you pay once to ingest and again to index logs for search. That split lets you ingest everything and index only what you will actually query, which keeps costs down if you set the rules up.
Self-hosted logging
Grafana Loki describes itself as a log aggregation system inspired by Prometheus. It indexes only the labels attached to each log stream, not the full text of every line, and stores compressed chunks in object storage. That design is why Loki is described as cheaper to operate than systems that index everything. The trade-off is that searching for an arbitrary phrase across a large time range is slower, because it scans chunks instead of consulting a full-text index.
The older Elasticsearch, Logstash, and Kibana (ELK) stack indexes full text and offers powerful search at the cost of more infrastructure to run. Most small teams choose a managed service instead.
Log hygiene
Three habits prevent most logging pain. Log in a structured format such as JSON so fields can be filtered. Never log passwords, tokens, or personal data. Attach a request ID to every line so you can follow one request across services.
Tracing and OpenTelemetry
A trace records the path of one request through your system, split into spans. When a checkout takes six seconds, a trace shows whether the time went to your code, the database, or an outside API.
OpenTelemetry (OTel) is the vendor-neutral standard for producing traces, metrics, and logs. Instrument once with OTel and you can send the data to Sentry, Datadog, Honeycomb, Grafana, or a self-hosted backend, and switch later without rewriting your code. For teams worried about lock-in, that portability is the main argument for using it.
Our explainer on AI observability shows how the same ideas extend to monitoring language-model features in production.
Alerting without alert fatigue
Alert fatigue happens when so many alerts fire that people stop trusting them. Our article on why notification automation creates alert fatigue describes the same failure in business automation. In monitoring, the usual causes are alerting on every error, using thresholds that fire constantly, and paging for things that can wait until morning.
Alert on burn rate
Google's SRE Workbook recommends a better approach: alert on how fast you are consuming your error budget, the amount of failure your reliability target allows. For a 99.9% target, the chapter's example thresholds are:
| Severity | Long window | Short window | Burn rate | Budget consumed |
|---|---|---|---|---|
| Page someone | 1 hour | 5 minutes | 14.4 | 2% |
| Page someone | 6 hours | 30 minutes | 6 | 5% |
| Open a ticket | 3 days | 6 hours | 1 | 10% |
Each alert requires both a long window and a short window to exceed the threshold. The short window confirms the problem is still happening, which stops alerts from lingering after a fix, and the long window prevents a brief blip from paging anyone.
The workbook evaluates alerting on four criteria: precision (the share of alerts that matter), recall (the share of real incidents that alert), detection time, and reset time. Alerting on every error scores well on detection time and badly on precision.
Practical rules
- Route by severity: page, ticket, or information only.
- Alert on a rate or on the number of affected users, not on a single event.
- Compare to a baseline. An error rate of 0.1% may be normal for one app and a crisis for another.
- For low-traffic services, one failure can produce a huge burn rate. The workbook suggests options such as synthetic traffic or a lower target.
- Test your alerts during onboarding. An alert that routes to a former employee is worse than none.
On-call and incident response
When an alert fires, a person has to respond. On-call tools handle schedules, escalation, and notification channels.
PagerDuty's pricing page lists a free plan for up to five users, with one on-call schedule and one escalation policy, and a Professional plan at $25 per user monthly ($21 billed annually). Better Stack includes on-call scheduling, with responder seats at $34 monthly ($29 annual) and telemetry-only team members at no charge. Atlassian's Opsgenie is another long-standing option, so check its current status and pricing before committing.
What good on-call looks like is mostly organizational, not technical:
- A clear rotation, often weekly
- A runbook for each alert type, saying what to check first
- An escalation policy for when the primary responder does not acknowledge
- A blameless postmortem after incidents, focused on systems rather than people
- A follow-up habit, so alerts and runbooks improve after each incident
SLOs and what downtime really means
A service level indicator (SLI) is a measured quantity, such as the share of requests that succeed. A service level objective (SLO) is the target for it. A service level agreement (SLA) is a contract that attaches consequences to missing an SLO. Google's SRE book defines them in those terms, and it recommends tracking a handful of representative indicators rather than many.
The arithmetic of availability targets is worth memorizing, because "nines" sound close but are far apart:
| Availability target | Downtime per year | Downtime per 30-day month |
|---|---|---|
| 99% | About 3.65 days | About 7.2 hours |
| 99.9% | About 8.76 hours | About 43 minutes |
| 99.99% | About 52.6 minutes | About 4.3 minutes |
These figures are straightforward arithmetic on a 365-day year. Each extra nine cuts the allowed downtime by a factor of ten and usually raises the engineering cost by more than that, which is why most startups should pick a target they can actually meet.
What a monitoring stack costs
Prices below are list prices from vendor pages checked in October 2026, and they change. Treat them as order-of-magnitude guides.
| Tool | Free tier | Paid entry |
|---|---|---|
| Sentry | 5,000 errors per month, 1 user | Team $29 monthly ($26 annual) |
| Datadog | Infrastructure Free: up to 5 hosts, 1-day metric retention | Infrastructure Pro $15 per host monthly (annual); APM $31 per host (annual, with infrastructure) |
| New Relic | 100 GB ingest per month, 1 free full-platform user | $0.40 per GB beyond 100 GB; full-platform users priced separately |
| Honeycomb | 20 million events per month | Pro from $150 monthly for 50 million events |
| UptimeRobot | 50 monitors, 5-minute checks | Solo $10 monthly |
| PagerDuty | 5 users, 1 schedule | Professional $25 per user monthly ($21 annual) |
Two illustrative budgets
These are arithmetic on the list prices above, not quotes.
A small SaaS team. Sentry Team at $29, uptime checks on a free tier, and two Better Stack responder seats at $34 each add up to about $97 per month.
A mid-sized platform with 20 hosts. Datadog Infrastructure Pro at $15 and APM at $31 per host, both on annual billing, come to $46 per host, or $920 per month, before logs, browser monitoring, and any add-ons. That is why Datadog bills grow quickly at scale, and why many teams negotiate or mix tools.
Common mistakes
Waiting for the first outage. Set up monitoring before launch. Retrofitting it during an incident means debugging blind.
Watching only the server. Front-end errors often affect users that your backend logs never see. Install error tracking on both sides.
Alerts nobody reads. An alert with no owner is noise. Tune thresholds, merge duplicates, and delete alerts that never lead to action.
Skipping postmortems. Write down what happened and why, and fix the system, not the person.
Ignoring third parties. If your payment provider or email service fails, you want to hear about it from a monitor, not a customer. Synthetic checks and webhook heartbeats cover this.
Logging secrets. A log line is stored, indexed, and often shared widely. Keep tokens and personal data out of it.
Trusting averages. Use percentiles for latency and the 75th percentile for Core Web Vitals, as the guidance above describes.
Managed or self-hosted?
For most teams, managed services are the sensible default. You pay by usage, and someone else handles upgrades, storage, and uptime of the monitoring system itself, which matters because a monitoring tool that fails with your app is no help.
Self-hosting makes sense in two cases: strict privacy or residency rules, and very large scale where per-GB pricing dominates. Sentry can be self-hosted, and a Grafana, Prometheus, and Loki stack is a common open-source route. Both demand real operational effort, including storage planning and upgrades. Using OpenTelemetry for instrumentation keeps the choice reversible.
If your hosting platform already bundles analytics and logs, check them first. Our comparison of Vercel, Netlify, and Cloudflare Pages covers what each includes, and our guide to deploying a website for beginners covers the basics of going live. Caching layers also affect what you measure; see how CDN caching speeds up websites.
A first-week plan
- Install an error tracker on the front end and back end, and confirm a test error appears.
- Add an uptime monitor for the homepage, one database-backed endpoint, and your login.
- Wire alerts to one channel with a named owner, and fire a test alert.
- Turn on Core Web Vitals reporting from real users.
- Add structured logs with a request ID, and keep secrets out.
- Write a one-page runbook for your two most likely failures.
- Pick one SLO you can meet, and review it monthly.
Our roundup of best web development tools lists related tooling, and our explainer on HTTP status codes helps when deciding which responses count as failures. If your API faces abusive traffic, rate limiting shows up in your monitoring as a rise in 429 responses.
FAQ
Q: Where should I start if I have no monitoring at all? A: Add an error tracker first, since it surfaces real bugs fastest, then an uptime monitor for your key URLs. Sentry's free plan covers 5,000 errors a month, and UptimeRobot's free plan monitors 50 URLs. Add performance and log tools when a specific problem calls for them.
Q: What is the difference between Sentry and Datadog? A: Sentry started as an error tracker and has added tracing, replay, and logs. Datadog started with infrastructure monitoring and bundles APM, logs, and browser monitoring across many hosts. Many teams run both, with Sentry for application errors and Datadog for infrastructure.
Q: What are the Core Web Vitals thresholds in 2026? A: According to Google's web.dev, good scores are an LCP of 2.5 seconds or less, an INP of 200 milliseconds or less, and a CLS of 0.1 or less, measured at the 75th percentile. INP replaced FID as a stable Core Web Vital in 2024.
Q: How many nines of uptime do I need? A: Pick a target you can meet. At 99.9%, you can have about 8.76 hours of downtime per year. At 99.99%, about 52.6 minutes. Each extra nine usually costs much more engineering effort than the last.
Q: Should I self-host my monitoring? A: Usually not. Managed services remove operational work and stay up when your own infrastructure fails. Self-hosting suits strict privacy rules or very large scale. Sentry offers a self-hosted option, and Grafana with Loki is a common open-source stack.
Q: How do I avoid alert fatigue? A: Alert on symptoms and rates, not single events. Google's SRE Workbook recommends multiwindow burn-rate alerts that page only when the error budget is being consumed fast and the problem is ongoing. Route low-urgency issues to tickets instead of pages.
Q: Are monitoring tools safe for sensitive data?
A: They can be, if you configure them. SDK defaults differ: Sentry's Python SDK excludes personal data unless send_default_pii is enabled, while its Next.js SDK sends user identity data by default and filters some keys. Review each SDK's privacy settings and never log secrets.
The takeaway
Monitoring is less about buying a famous tool and more about answering four questions reliably: what broke, how slow is it, is it reachable, and what happened. Sentry plus an uptime monitor answers the first and third for under $100 a month, and the rest can wait until a real problem demands it.
The harder part is discipline. Alerts should map to user harm, thresholds should come from your own baseline or an error budget, and every page should have an owner and a runbook. Teams that get that right sleep better on a modest stack than teams with an expensive one that cries wolf every night.
Sources
- Google, Web Vitals
- Google, Service Level Objectives (SRE book)
- Google, Alerting on SLOs (SRE Workbook)
- OpenTelemetry, Signals
- Sentry, pricing, Next.js setup, custom instrumentation, FastAPI integration, error monitoring
- Datadog, pricing
- Better Stack, pricing
- UptimeRobot, pricing
- PagerDuty, incident management pricing
- New Relic, pricing; Honeycomb, pricing
- Grafana Labs, Loki overview
Prices last checked October 2026.
Follow new articles
Add SciHub101 to your feed reader to see new science and technology stories.
About the Author
SciHub101 is an independent science and technology publication founded and edited by Buğra Sözeri, a software engineer and app developer based in Türkiye. AI tools assist with drafting and research. Source documentation in the existing archive is uneven, and articles are being reviewed and corrected. The Editorial Team byline identifies editorial responsibility; it does not certify specialist or independent human review. Where we compare products, anything built by our own team is labelled as such — see the editorial guidelines and About page for how corrections and disclosures work.
Related Articles

htmx vs React 2026 — When to Skip the JavaScript Framework
htmx vs React in 2026: how server-sent HTML fragments compare with client-rendered JavaScript, where each fits, and what a documented React-to-htmx port saved.
CSS-in-JS vs Tailwind 2026 — Why Tailwind Took Over
CSS-in-JS vs Tailwind in 2026: runtime cost, Server Components, dark mode, migration, and where each still wins, with sourced benchmarks and docs.
What Is HTMX? Hypermedia for Modern Web
HTMX explained: how this 14KB library lets you build dynamic web apps with HTML attributes instead of a JavaScript framework, plus how it actually works.

Docker Explained — Containers for Beginners
Learn Docker from scratch: containers vs VMs, Dockerfiles, docker-compose, and how to ship a Node.js app reliably across any environment.
Build Tools Compared 2026 — Vite, Webpack, Turbopack, Bun
Vite, webpack, Turbopack, Bun, Rspack and Rolldown compared for 2026: how each works, where each wins, and what the benchmarks do and do not show.

Web Security Essentials 2026: XSS, CSRF, OWASP Top 10
Web security essentials for developers: XSS, CSRF, SQL injection, access control, and the OWASP Top 10:2025, with code and how to prevent each attack.