Cycling by Country: How to Interpret Trips and Modal Share
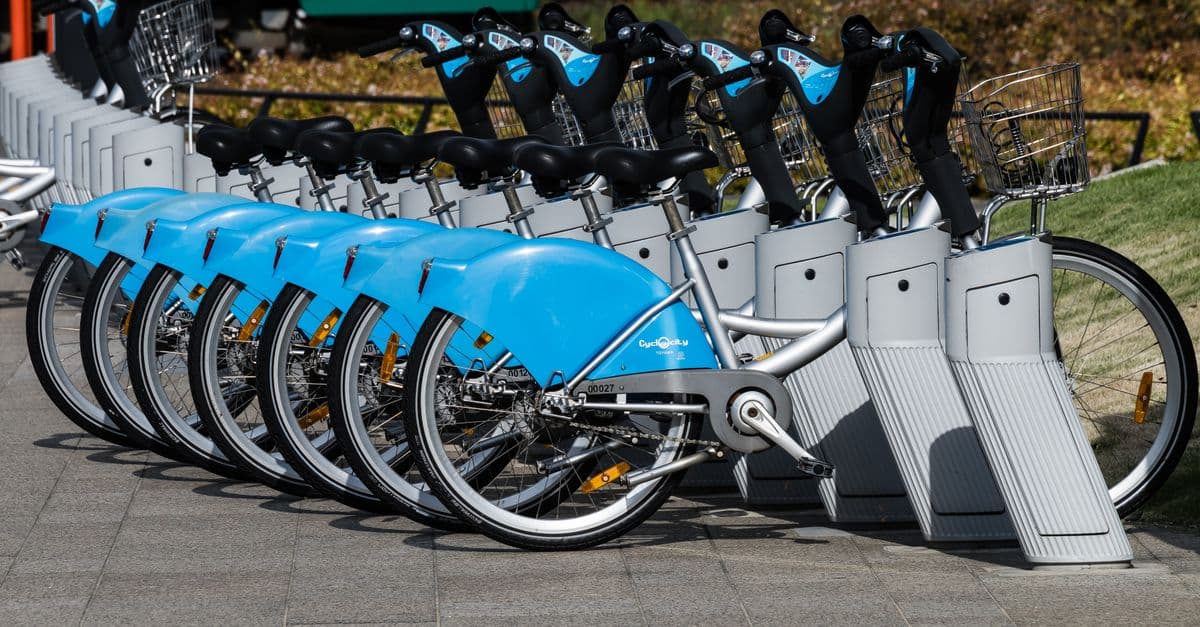
Photo: Daven Hsu / Pexels
“Most cycling” can mean the largest number of riders, the greatest cycling distance, or the largest share of trips made by bicycle. A country ranking must choose one measure. Bicycle ownership alone does not establish how often a bicycle is used.
Correction — 15 October 2026: The previous worldwide table was withdrawn because it mixed national and urban estimates, lacked reproducible observation years, and did not consistently sort its own values. We also removed unsupported claims about global rider counts, country infrastructure totals, and a universal causal explanation of cycling participation.
A verified national example
Statistics Netherlands (CBS) reports that bicycles accounted for 27% of trips in 2023 in its Dutch mobility statistics. The same summary reports 9% of passenger-kilometres and 22% of travel time. These percentages describe different units; they should not be substituted for one another. CBS cycling summary, 2023 data.
The survey table covers residents aged six or older in private households, excluding people living in institutions. This is a population definition, not “all adults” or every person in the country. The CBS table also warns that changes to the 2024 questionnaire mean the data are not fully comparable with 2023. CBS table 84710.
Trips, distance, and people answer different questions
Trip modal share divides bicycle trips by trips across the included modes. Distance share divides bicycle kilometres by all included travel kilometres. A participation rate counts people who cycle according to a specified frequency. None can be calculated from another without additional information.
Consider a hypothetical traveler who makes two short bicycle trips and one long train trip. Cycling represents two of three trips, yet the train might account for most of the distance. Counting trips and counting kilometres would give different impressions of the same day.
A survey asking whether someone cycled last month is different again: an occasional recreational rider and a daily commuter can both answer yes. That survey would not establish their commute mode or total cycling distance.
A city statistic is not a national statistic
A city commute measure might cover employed residents traveling to workplaces inside the city. Another might count anyone entering the city, including suburban commuters. An all-trip measure could include shopping and recreation. Before comparing percentages, check the geographic boundary, trip purpose, population, and year.
The earlier claim that 62% of all Copenhagen residents commute daily by bicycle was not supported by a precisely identified account and denominator in the source material. It has been withdrawn rather than treated as a national Danish modal share.
How to compare two surveys
Begin with the same trip purpose and observation period. Record age coverage, whether weekends are included, and how multimodal trips are classified. Check whether a bicycle leg to a railway station is counted as a separate stage or whether the entire journey is assigned to the main mode.
Season matters to the interpretation, too. A one-week summer survey cannot automatically represent a whole year. An apparent change may reflect sampling or questionnaire changes, so the source's comparability notes belong beside the table rather than hidden behind an organization link.
Health evidence is a separate question
A 2017 prospective UK cohort study found associations between cycle commuting and lower risks of several adverse health outcomes. Participants were not randomly assigned to commute by bicycle. The findings therefore do not establish that switching mode causes a fixed percentage reduction in risk for every person. Celis-Morales and colleagues, BMJ.
Similarly, national participation figures alone cannot isolate the effects of infrastructure, climate, density, income, or travel distance. Establishing why participation changes needs evidence beyond a country league table.
Worked example: trips, stages, and distance
Suppose a fictional survey records 100 complete journeys. Twenty-five are classified as bicycle journeys, giving a trip share of 25%. That statement says nothing about the share of distance until the lengths of those journeys are known. If the bicycle journeys total 100 kilometres and all journeys total 1,000 kilometres, the illustrative distance share is 10%.
Now suppose some railway journeys include a short bicycle ride to the station. A survey classifying the whole journey by its main mode may label them railway journeys. A stage-based survey may separately record the bicycle and railway segments. Neither count is inherently wrong, but a table mixing the two definitions would not compare the same unit.
Participation adds another denominator. If 40 people made those bicycle trips, a participation statistic needs the number of people surveyed and the stated observation window. The trip share alone cannot establish that 25% of residents cycle, nor that 25% cycle every day. A person can make several journeys, and different people can have different frequencies.
Before applying a published percentage, write out a sentence describing its numerator and denominator. “Bicycle journeys divided by all included journeys” is different from “people who cycled divided by surveyed residents.” Include the place and period in that sentence as well. This small exercise exposes a surprisingly large class of misleading comparisons.
All numbers in this example are hypothetical. They illustrate a measurement problem rather than estimate a missing country's modal share. The actual Dutch example above remains tied to its dated CBS source and population definition.
What a credible ranking should show
The table needs a defined metric, a direct source for every row, compatible years and survey populations, and consistent sorting. An absolute rider count should not compete in the same column as trip modal share. A city case should be labeled as a city case.
The Dutch example here is a documented national measure, not proof of an exact global rank. For a different question—what makes a cycling network usable—see our infrastructure comparison guide.
Related guides
Follow new articles
Add SciHub101 to your feed reader to see new science and technology stories.
About the Author
SciHub101 is an independent science and technology publication founded and edited by Buğra Sözeri, a software engineer and app developer based in Türkiye. AI tools assist with drafting and research. Source documentation in the existing archive is uneven, and articles are being reviewed and corrected. The Editorial Team byline identifies editorial responsibility; it does not certify specialist or independent human review. Where we compare products, anything built by our own team is labelled as such — see the editorial guidelines and About page for how corrections and disclosures work.
Related Articles

Countries with the Most Patents (2025 Ranked)
China surpassed the United States in annual patent filings in 2011 and now files more patents than all other countries combined. The US still leads in international (PCT) patents — the most commercially valuable category. Japan's Sony and Toyota are among the world's most prolific patent filers.

Countries Hosting the Most Refugees (2025 Ranked)
Turkey hosts more refugees than any country — 3.6 million registered Syrian refugees. Germany hosts the most in Europe with 2.2 million refugees. Iran and Pakistan each host over 3 million Afghan refugees. The global refugee population exceeded 35 million in 2024 — the highest ever recorded.

Cycling Infrastructure: How to Compare Network Quality
Why kilometres of bike lanes cannot establish a global winner, and how connectivity, junctions, and design standards affect a network assessment.

Countries with the Most Electric Vehicles (Ranked)
China dominates global EV adoption: of the nearly 58 million electric cars on the world's roads at the end of 2024, China accounts for more than half. Chinese buyers purchased over 11 million new EVs in 2024 alone — more than were sold globally just two years earlier. Norway leads in EV penetration, with 29% of all cars on its roads now electric. This ranking covers the top countries by total EV stock, new sales, and market share, sourced from the IEA Global EV Outlook 2025.
The Bicycle: From Running Machine to 1.6 Billion Wheels
Karl Drais built a steerable two-wheeler in 1817. It took 68 more years and four distinct designs to reach the bicycle you recognize today.

Countries with the Most Wind Power Capacity (2025 Ranked)
China has about 641 GW of installed wind capacity, nearly half of the world's roughly 1,291 GW. The United States, Germany, India, and Brazil follow. Denmark ranks 17th by capacity but gets about 59% of its electricity from wind. Here is the 2025 ranking, what it measures, and what it leaves out.