Countries with the Most Skiing: What the Data Shows
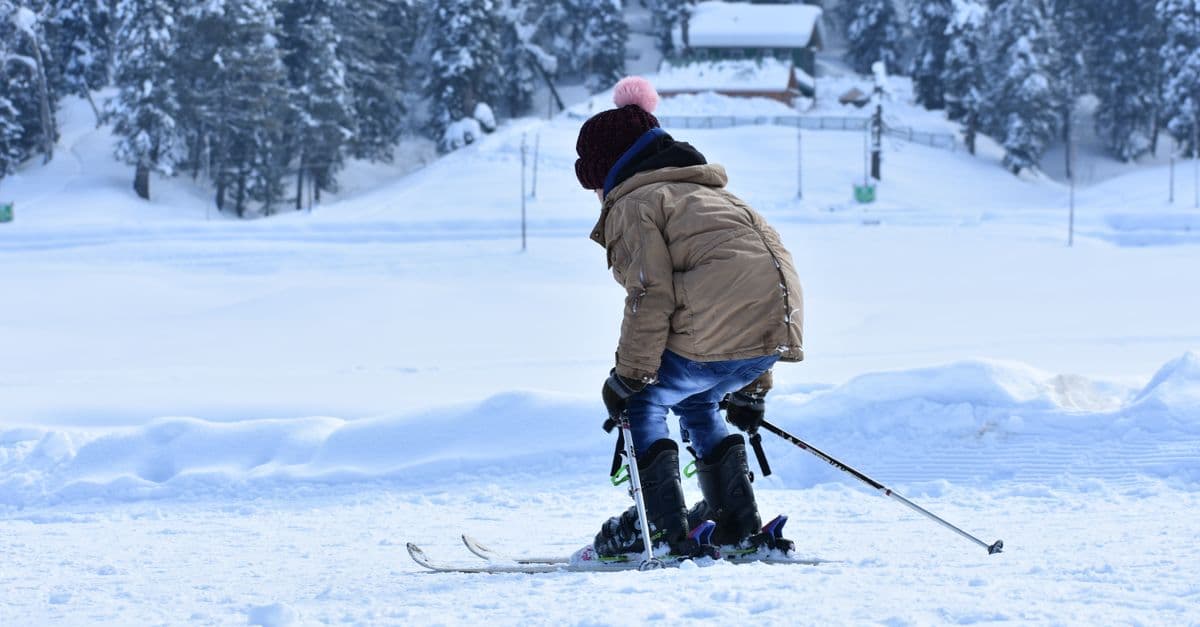
Photo: Hurrah suhail / Pexels
Skiing is one of the few sports whose popularity is counted at the turnstile. Every time someone scans a lift pass for a day on the mountain, the industry records a "skier visit," and adding those up produced about 399 million visits worldwide in the 2024/25 season, a record according to the International Report on Snow & Mountain Tourism. Which countries account for the most of those visits? The full country ranking sits behind a paywall, so this article uses the verified national figures that are public, and explains what drives them.
Key takeaways
- The world recorded about 399 million skier visits in 2024/25, beating the previous record of about 392 million in 2018/19 (Laurent Vanat's International Report on Snow & Mountain Tourism).
- Austria's cable car sector reports about 51.9 million skier days a year, 2,526 lifts and cable cars, and 17,100 direct jobs.
- Switzerland recorded 25.4 million visits in 2021/22, after a pandemic dip to 20.1 million in 2020/21.
- Japan's Niseko averages about 15.1 meters of snow a year in one widely cited ranking, driven by moisture blowing in from the Sea of Japan.
- Snowmaking takes roughly 400 liters of water per cubic meter of snow, and Northern Hemisphere snow seasons have reportedly shortened by about five days per decade since the 1970s.
Why counting skiers is harder than it sounds
Imagine ranking restaurants. You could count tables, diners per night, or revenue, and the three lists would not match. Skiing has the same problem, plus a few of its own.
A skier visit (also called a skier day) is one person using a lift-served area for some part of one day. A week-long trip counts as seven visits, and a person who skis 40 days a year counts as 40. So a visit count tells you how much skiing happens, not how many people ski. A country can have a huge number of visits from a small, devoted group of skiers, or a modest number from a large, casual one.
Three more complications make cross-country comparison messy:
- Definitions of "ski area." A resort with 200 kilometers of groomed runs and a single rope tow on a village hill both count as "ski areas" in some national tallies and not in others.
- Seasons, not years. Skiing seasons straddle two calendar years, and a bad snow year in one country can shift visits to another.
- Domestic versus foreign. Visits by foreign tourists count in the host country, so a country with famous resorts can top a visit table while few of its own residents ski.
The only systematic global source is the International Report on Snow & Mountain Tourism, compiled by Laurent Vanat. Its 18th edition covers the 2024/25 season. The detailed country tables are sold, not published, which is why open web rankings usually repeat the same few figures with no named source.
The global picture: a record season with uneven winners
Vanat's 2024/25 summary puts global skier visits at about 399 million, up from the previous record of about 392 million in 2018/19, a rise of roughly 1.8%. The report identifies about 2,000 ski resorts across 68 countries with equipped ski areas.
The summary does not list country totals, but it does describe who did well. China led the countries performing above their pre-pandemic five-year average, for the second year running. The United States, Italy, and Russia also showed positive trends. Switzerland had its best result in more than 15 years, while Japan and Germany were the markets where a return to pre-pandemic levels was most uncertain.
That pattern is more informative than a ranking. It says that new markets, especially China, are growing faster than established ones, and that the mature Alpine and North American markets are broadly stable. For a country-by-country picture, the national figures below fill in what the public record allows.
| Place | Verified headline figure | Source |
|---|---|---|
| World | About 399 million skier visits, 2024/25 | Vanat International Report, 18th edition |
| Austria | About 51.9 million skier days a year; 2,526 lifts and cable cars | WKO cable car sector page |
| Switzerland | 25.4 million visits in 2021/22; 24.9 million in 2018/19 | Vanat, Swiss season summaries |
| France | Three Valleys: 183 lifts, claimed 600 km of runs | Wikipedia, Les Trois Vallées |
| Japan | Niseko: 15.1 m of snow a year (2007 ranking) | Wikipedia, Niseko |
| United States | Epic Pass: 42 resorts in four countries, from $783 to $1,051 over five years | Wikipedia, Epic Pass |
Notice what the table cannot do: it cannot rank the countries against each other. The Austrian figure is a rounded annual total with no stated season, the Swiss one is a specific season, and the others describe single resorts or products. Anyone who ranks them without a common definition is inventing the comparison.
Austria: skiing as an industrial sector
Austria's cable car sector describes itself in industrial terms: more than 50 million skier days a year (the precise figure on the sector's page is 51.9 million), 2,526 lifts and cable cars, 17,100 direct jobs, and EUR 6.7 billion in value added. Value added is an economic measure of what the sector contributes beyond its input costs, so it is not the same as revenue, and the sector page does not state which season the figures cover.
Even with those caveats, the scale is clear. A country of about nine million people supports a skiing industry that records more than five skier days for every resident per year. That ratio can only be reached with a mix of foreign tourists and residents who ski many days a season.
The country's role in skiing history is as important as its numbers. Hannes Schneider (1890 to 1955) worked at St. Anton in the Arlberg region and developed what became known as the Arlberg technique, a method of teaching alpine skiing that remains a foundation for instruction. In 1928 he helped organize the Arlberg-Kandahar, an international alpine race held at St. Anton. After Germany took control of Austria in 1938, Schneider, an outspoken critic of the Nazis, lost his ski school and was imprisoned. In 1939 the American banker Harvey Dow Gibson helped secure his release and brought him to New Hampshire, where he ran a ski school at Cranmore Mountain until his death in 1955. Austrian teaching methods literally crossed the Atlantic with him.
Switzerland: a small country with a volatile series
Switzerland publishes a longer public series than most countries, and it shows how sensitive visit counts are to events. According to Vanat's season summaries, Swiss skier visits were 23.4 million in 2017/18, 24.9 million in 2018/19, 20.2 million in 2019/20, 20.1 million in 2020/21, and 25.4 million in 2021/22.
| Season | Swiss skier visits |
|---|---|
| 2017/18 | 23.4 million |
| 2018/19 | 24.9 million |
| 2019/20 | 20.2 million |
| 2020/21 | 20.1 million |
| 2021/22 | 25.4 million |
The 2019/20 season fell about 19% from the year before, because the pandemic closed lifts in March 2020 and cut off the busiest weeks of the season. By 2021/22 the total had passed the pre-pandemic level by about 2%. The five-season average works out to about 22.8 million visits, which hides how much a single season can move.
The 2024/25 summary adds that Switzerland had its best result in more than 15 years, though it gives no number. That makes the series a good reminder: a country's place in a ranking can change by several million visits from weather and policy alone, long before anything structural happens.
France: the lift-linked giant
France's best-known contribution is scale. The Three Valleys (Les Trois Vallées) in Savoie is promoted as the world's largest ski area, a slogan used since the 1970s. The valleys have been linked by a single lift pass since 1971, and the area spans from about 600 meters at its lowest point (Brides-les-Bains) to 3,230 meters at the top (Orelle).
The claimed size is worth a second look. The operators advertise about 600 kilometers of runs, but an independent expert measured about 493 kilometers, roughly 18% less. The area has 183 lifts, made up of 3 cable cars, 37 gondolas, 69 chairlifts, and 74 surface lifts. The distinction matters because "largest" depends on what you measure: the Three Valleys is described as the largest area linked solely by lifts and slopes, while Les Portes du Soleil, which straddles France and Switzerland, may have more total runs.
The Three Valleys also shows how much modern skiing depends on snowmaking. By 2026 the area had about 2,823 snow cannons, up from around 600 in the 1990s. That is a roughly fourfold increase in a generation, and it is typical of a trend across the Alps. The next sections explain why.
The United States: passes, snowboards, and consolidation
The United States is the market where the business model of skiing has changed most visibly. The Epic Pass, sold by Vail Resorts (NYSE: MTN), covered 42 mountain resorts in four countries (the US, Canada, Australia, and Switzerland) as of 2025. Its all-access price rose every year after 2021/22:
| Season | Epic Pass price |
|---|---|
| 2021/22 | $783 |
| 2022/23 | $841 |
| 2023/24 | $909 |
| 2024/25 | $982 |
| 2025/26 | $1,051 |
That is an increase of about 34% in four seasonal steps. Pass sales and visitation reportedly declined in 2024/25, a reminder that a price rise is not the same as growth in participation. Pass pricing matters for rankings because a multi-resort pass shifts how visits are distributed: a skier who has already paid for a season-long pass has an incentive to ski more days to get value from it, which can raise visit counts without raising the number of skiers.
Snowboarding is the other American story. The "Snurfer," a toy made by Sherman Poppen in Muskegon, Michigan, in 1965, sold roughly a million units over the next decade. In 1977 Jake Burton Carpenter founded Burton Snowboards in Vermont after showing off bindings he had designed at a snurfing competition. Snowboarding became an Olympic event at the 1998 Nagano Games. By the 2009/10 season, about 8.2 million people snowboarded in the US and Canada, more than 30% of all snow-sports participants. Today approximately 97% of ski areas in North America and Europe allow snowboarding, up from about 7% of US ski areas in 1985, though a handful such as Alta, Deer Valley, and Mad River Glen still do not.
The National Ski Areas Association (NSAA) publishes national visit totals going back to the 1978/79 season, but the numbers are sold through its store rather than posted in full, so they are not reproduced here.
Japan: the snow that built a reputation
Japan's skiing reputation rests on a feature of its geography rather than on infrastructure. Cold winter air crosses the Sea of Japan, picks up moisture, and meets mountain ranges on the coast. At Niseko in Hokkaido, the Yotei-Niseko range blocks that moisture and forces it out as snow. The resulting powder is known for being light, and the area's season runs from late November to early May.
A December 2007 ranking placed Niseko second among the world's snowiest resorts at 15.1 meters a year, behind Mt. Baker in Washington State at 16.3 meters. Those are single-ranking figures from a specific year, not long-term averages, and the same Wikipedia page also lists a conflicting annual total, so treat any precise Niseko number as an approximation. The qualitative point holds: this is one of the snowiest inhabited places on Earth.
Japan's national picture is less certain. Vanat's 2024/25 summary names Japan, along with Germany, as a market where a return to pre-pandemic levels is the most uncertain. The Wikipedia entry for Niseko attributes part of the area's appeal to low prices, noting that Japan's long economic stagnation made it one of the cheapest major ski destinations. Price and snow together, rather than infrastructure, are what draw visitors there.
China: the fastest-growing market, with a snowmaking footprint
China is the clearest example of a market being built from scratch. The 2024/25 report says China led the countries performing above their pre-pandemic average, for the second consecutive year. The 2022 Beijing Winter Olympics, like the 2014 Sochi and 2018 PyeongChang Games, relied heavily on artificial snow to supplement natural snowfall.
China's trajectory shows how skiing markets differ from, say, football. A country can create a skiing industry quickly with capital, but it must supply the snow, or make it. That is why snowmaking is not a side detail in modern skiing: it is the technology that lets a market appear where the weather alone would not allow one.
How snowmaking works, and what it costs
Snowmaking is the quiet infrastructure under most of the world's ski seasons. Snow guns force water and compressed air through a nozzle; the water breaks into fine droplets that freeze as they fall. What matters is not simply air temperature but the wet-bulb temperature, a measure that combines temperature and humidity. Think of how you cool off when you sweat: on a dry day sweat evaporates quickly and chills you, while on a humid day it barely evaporates. Droplets in a snow gun behave the same way. In dry air they lose heat by evaporation and freeze at slightly above 0 degrees Celsius; in humid air the air has to be colder.
Starting a system generally requires a wet-bulb temperature of about minus 2.5 degrees Celsius (27.5 degrees Fahrenheit). Colder air makes more snow, faster and more efficiently, which is why guns often run at night. Some resorts add nucleating agents, including proteins from the bacterium Pseudomonas syringae, to help water freeze into ice crystals.
| Snowmaking input | Typical figure |
|---|---|
| Water per cubic meter of snow | About 400 liters |
| Energy per cubic meter | Typically 3.5 to 4.3 kWh (range about 1 to 14 kWh) |
| Share of an average US resort's energy costs | About half |
| US NSAA resorts using artificial snow, 2009/10 | About 88% |
| Alpine slopes coverable with artificial snow | From about 25% in Germany to about 90% in Italy |
Source: Wikipedia, "Artificial snow," summarizing industry and academic estimates.
A worked example shows the scale. Suppose a piste is 1 kilometer long and 30 meters wide, and you want a 0.5-meter base. That is 30,000 square meters times 0.5 meters, or 15,000 cubic meters of snow. At about 400 liters of water per cubic meter, that is 6 million liters of water, roughly the volume of 2.4 Olympic swimming pools (2.5 million liters each). At 3.5 to 4.3 kWh per cubic meter, the electricity comes to about 52,500 to 64,500 kWh. These are illustrative numbers built from the typical figures above, not measurements of a real resort, but they show why a ski area's water and power bills are a first-order business concern.
Snowmaking also raises environmental and cultural questions. A significant share of the water evaporates rather than returning to groundwater, mountain reservoirs can be hazardous, and in places such as the Arizona Snowbowl the use of treated wastewater for snow has been a cultural dispute. For the broader water context, see our explainer on water scarcity.
Climate: shorter seasons and a shifting map
Several sources point in the same direction. Northern Hemisphere snow seasons have reportedly shortened by about five days per decade since the 1970s, according to the snowmaking literature summarized above. Projections cited there suggest that by the 2050s fewer than half of the past Winter Olympic and Paralympic locations would have reliable weather.
Those are broad statements, and the details differ by region and altitude. Low-lying resorts depend most on snowmaking and are the most exposed; high-altitude glacier and north-facing areas are the most resilient. Snowmaking helps, but it needs cold air to work, so it cannot fully substitute for a colder winter. If you want the physics behind this, our explainer on phase changes covers why water freezes and sublimates the way it does, and the climate change science overview lays out the larger trend. Glaciers, the high-altitude reservoirs that many ski areas lean on, are covered in how glaciers form and move.
The economic exposure is highest where skiing is a large part of local life. Austria's sector value added of EUR 6.7 billion and 17,100 direct jobs describe the cable car sector alone, not the hotels, restaurants, and shops that depend on it. Countries that rely on tourism more broadly are examined in countries most dependent on tourism.
A short history of how skiing became a mass sport
Skiing is old. One account describes a history of almost five millennia, with debated claims of skiing far earlier in the Altai Mountains. The first description of a skier using two poles dates to 1741, and continental European troops were equipped with skis by 1747. Military ski races were held in Norway in the 18th century.
Alpine skiing, the downhill kind that dominates the visit counts, split from Nordic skiing around the 1920s, when ski lifts removed the need to climb back uphill. That single change is the reason the sport became an industry: once a lift can carry hundreds of people an hour, a mountain becomes something you can sell by the day. Speed skiing dates from 1898. Leo Gasperl's 1932 run at St. Moritz is often cited as the first official record, at about 89 mph (143 km/h), though Wikipedia's record table lists it at 136.6 km/h and an earlier 1930 mark by Gustav Lantschner. Cross-country skiing and ski jumping have been in the Winter Olympics since 1924. Freestyle skiing was demonstrated at the 1988 Games and added to the Olympic program in 1992.
For a related look at how countries stack up in winter sport, our ranking of countries with the most Olympic and world sport medals takes up the competitive side.
How to read a skiing ranking without being fooled
Because the public data are thin, a checklist beats any single table. Use it on any ranking you find, including this one.
| Check | Good sign | Warning sign |
|---|---|---|
| Named source | A national lift association or the Vanat report, with an edition | "Industry estimates" with no author |
| Unit | Skier visits, skier days, or people stated clearly | A column that mixes visits with participants |
| Season | Stated for each country | One year for some countries, another for the rest |
| Definition of ski area | Says what counts (lift-served, minimum size) | Resort counts with no definition |
| Domestic vs. foreign | Separates residents from tourists | A "participation rate" with no survey cited |
| Precision | Rounded, with a caveat | Exact-looking numbers with a "+" suffix |
The last two rows catch the most common errors. A "percent of the population who ski" figure needs a household survey behind it, and most web tables that include one cannot name the survey. Likewise, a table that gives every country "visits" and a neat resort count in the same row is probably combining numbers from different years and definitions.
Frequently asked questions
Q: Which country has the most skier visits? A: The full country ranking is in a paid industry report, so no public source here lists every country. The verified public figures are Austria's roughly 51.9 million skier days a year and Switzerland's 25.4 million in 2021/22. Treat any table that ranks all countries without a named edition and season with caution.
Q: How many skier visits are there worldwide? A: About 399 million in 2024/25, according to the 18th International Report on Snow & Mountain Tourism. That beat the previous record of about 392 million in 2018/19. The report identifies about 2,000 ski resorts across 68 countries with equipped ski areas.
Q: Is the Three Valleys really the biggest ski area in the world? A: It is promoted as the largest, and it is the largest area linked solely by lifts and slopes. Its advertised 600 kilometers of runs is higher than an independent measurement of about 493 kilometers. Les Portes du Soleil, across France and Switzerland, may have more total runs, so the answer depends on the definition.
Q: Is skiing or snowboarding more popular? A: In the US and Canada, about 8.2 million people snowboarded in 2009/10, more than 30% of all snow-sports participants, so skiing still had the larger share at that time. Current splits differ by country and age. Nearly all ski areas in North America and Europe now allow snowboarding, so the two share the same lifts.
Q: Why is Japan famous for powder? A: Cold winter air crosses the Sea of Japan and picks up moisture, and coastal mountains such as the Yotei-Niseko range force it out as snow. Niseko was ranked second among the snowiest resorts in a December 2007 listing, at 15.1 meters a year. Figures vary by source, so treat the number as an approximation.
Q: How does snowmaking work, and does it solve the climate problem? A: Snow guns spray water droplets into cold air so they freeze, and they need a wet-bulb temperature of about minus 2.5 degrees Celsius to start. It lengthens seasons but needs cold air and large amounts of water and energy, about 400 liters and 3.5 to 4.3 kWh per cubic meter. It cannot replace a colder winter.
Q: How much does a ski pass cost? A: It varies by pass and season. The all-access Epic Pass rose from $783 in 2021/22 to $1,051 in 2025/26, covering 42 resorts in four countries as of 2025. Single-day lift tickets and regional passes are priced separately, and prices change every year.
The takeaway
Skiing is a numbers business with a missing public scoreboard. The world's roughly 399 million skier visits are well documented in total, but the country-by-country split lives in a paid report, so the verified public figures are a patchwork: Austria's industrial scale, Switzerland's volatile seasons, France's lift-linked giant, America's pass economy, Japan's snow, and China's rapid build-out. What ties them together is increasingly artificial: snowmaking now underpins seasons from the Alps to Beijing, at a cost of hundreds of liters of water per cubic meter. The sensible reading of any ski ranking is to ask what was counted, in which season, and whether the snow was natural.
Sources
- Vanat: International Report on Snow & Mountain Tourism, 2024/25 summary
- Vanat: Swiss ski season summaries
- WKO: Austrian cable car sector
- Wikipedia: Les Trois Vallées
- Wikipedia: Hannes Schneider
- Wikipedia: Niseko, Hokkaido
- Wikipedia: Epic Pass
- Wikipedia: Snowboarding
- Wikipedia: Artificial snow
- Wikipedia: Skiing
Related Reading
Follow new articles
Add SciHub101 to your feed reader to see new science and technology stories.
About the Author
SciHub101 is an independent science and technology publication founded and edited by Buğra Sözeri, a software engineer and app developer based in Türkiye. AI tools assist with drafting and research. Source documentation in the existing archive is uneven, and articles are being reviewed and corrected. The Editorial Team byline identifies editorial responsibility; it does not certify specialist or independent human review. Where we compare products, anything built by our own team is labelled as such — see the editorial guidelines and About page for how corrections and disclosures work.
Related Articles

Countries with the Most Libraries (2025 Ranked)
Russia has more libraries than any country — 130,000+ public, school, and special libraries. The United States has the world's largest library (the Library of Congress, with 173 million items). Finland has the highest library visit rate per capita of any country.

Countries That Waste the Most Food (2025 Ranked)
Australia wastes 312 kg of food per person per year — the most in the world. The US wastes 80 million tonnes annually. Globally, one-third of all food produced is lost or wasted — enough to feed every hungry person on Earth twice over. Here's the full picture of global food waste and what the most effective interventions are.

Countries with the Most Sports Participation (2025 Ranked)
Finland and Sweden have the highest sports participation rates — over 70% of adults play sport regularly. Australia has the most sports organisations per capita. The US has the most professional sports leagues. Here's the full ranking of the world's most sports-active nations.

Top 10 Greatest Basketball Players of All Time (2026 Ranked)
Michael Jordan went 6-0 in NBA Finals. LeBron James is the all-time leading scorer. Kareem Abdul-Jabbar held the scoring record for 39 years. The 10 greatest basketball players ranked by championships, statistics, and impact.

Countries with the Most Tourists Per Capita (2025 Ranked)
San Marino receives 6 million tourists annually for a population of 34,000 — 176 tourists per resident. Iceland, Andorra, and the Maldives receive 3–8x their own population in tourists each year. Over-tourism is straining small destinations. Here's the complete tourists-per-capita ranking and the double-edged sword of being the world's most-visited small nation.
Countries with the Most Olympic and World Sport Medals (2025 Ranked)
The United States leads all-time Olympic medal tables with 2,631 total medals. China dominates weightlifting and diving. Kenya owns distance running. Jamaica dominates sprints. Here's the full breakdown of which countries dominate which sports — and what drives sporting excellence.