Index Funds vs Active Funds — Which Wins?
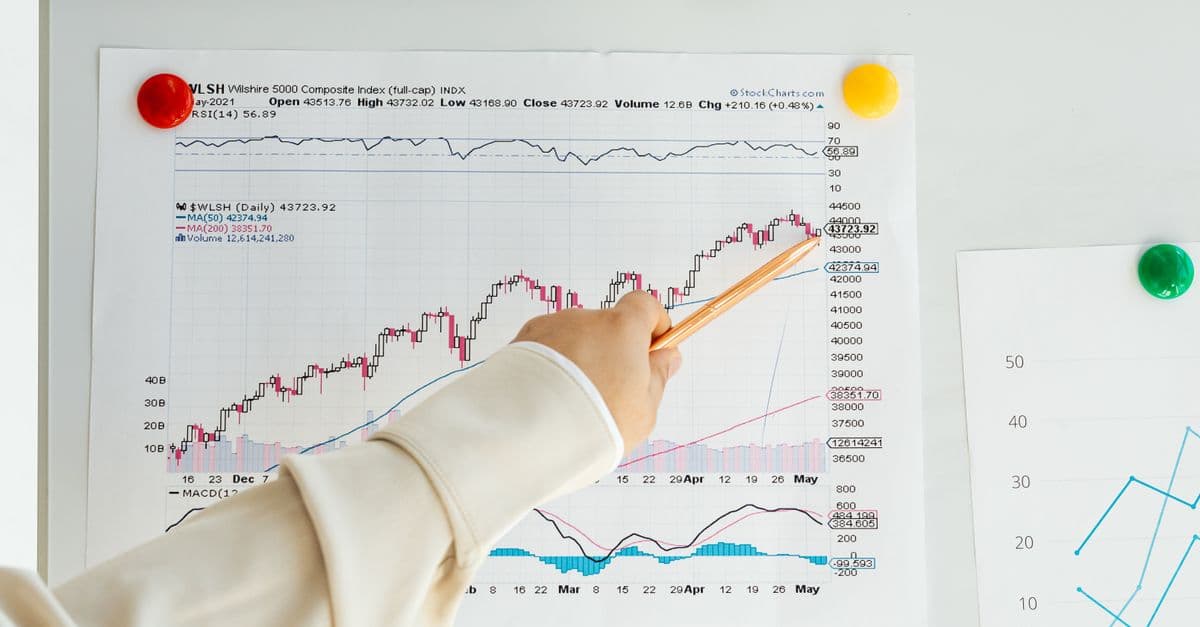
Photo: www.kaboompics.com / Pexels
Over the 20 years ending December 31, 2024, 91.99% of actively managed U.S. large-cap stock funds earned less than the S&P 500, according to S&P Dow Jones Indices. Only about a third of the funds that existed at the start of that period were still around at the end. That gap between index funds and active funds is the most studied result in retail investing, and it has a mechanical explanation rather than a mysterious one. This article walks through the data, the arithmetic behind it, the honest exceptions, and what the evidence cannot tell you.
Educational only, not financial advice. Investing involves risk of loss, and past performance does not guarantee future results. This article describes research findings and does not recommend any fund, strategy, or allocation. A licensed financial professional can address your own situation.
What an index fund and an active fund actually do
An index fund tries to match the return of a market benchmark, such as the S&P 500, by holding the same securities in roughly the same proportions. Nobody inside the fund decides that a stock looks cheap or expensive. When the index changes, the fund changes with it. For the mechanics of how that tracking works in practice, see our explainer on how index funds track markets.
An active fund employs a manager and a research team who try to beat the benchmark. They choose which securities to hold, how much of each, and sometimes when to hold cash. The pitch is simple: pay for judgment, receive better returns than the market average.
Both products can come as a mutual fund or an exchange-traded fund (ETF), a fund whose shares trade on an exchange like a stock. The wrapper matters less than the strategy inside it, and the two wrappers differ mainly in how they are bought and taxed, which our piece on how ETFs differ from mutual funds covers in detail.
Think of the choice as two ways of crossing a river. The index fund takes the bridge that everyone else is already using, pays a small toll, and arrives with the crowd. The active fund hires a guide who promises a shortcut, charges a much larger fee up front, and may or may not find the ford. The guide's fee is paid whether the shortcut works or not.
What the fee gap looks like in real numbers
Costs are the one variable that is known in advance. A fund's expense ratio is its annual operating cost expressed as a percentage of assets, deducted from returns before you ever see them. The Investment Company Institute (ICI), the U.S. fund industry's trade association, publishes asset-weighted averages, which reflect what shareholders actually paid rather than what is merely on offer.
| Fund type (U.S., asset-weighted average) | Expense ratio | Year |
|---|---|---|
| Index equity mutual funds | 0.05% | 2025 |
| Index equity ETFs | 0.14% | 2025 |
| All equity mutual funds | 0.40% | 2025 |
| Actively managed equity mutual funds | 0.64% | 2025 |
Source: ICI 2026 Investment Company Fact Book, chapter 6, Figures 6.1, 6.4 and page 76; ETF figure also in ICI's March 2026 fee release.
Two details are worth reading carefully. First, the averages are weighted by assets, so they are pulled down by the very large, very cheap funds that most investors actually hold. The simple average for equity mutual funds was 1.09% in 2025, because many small funds charge a lot. Second, fees have fallen for everyone. ICI reports that the asset-weighted equity mutual fund average dropped from 0.99% in 2000 to 0.40% in 2025, a 60% decline, and credits competition and the growth of index products for part of it.
What a small percentage does over 30 years
A fee is subtracted every year from a balance that would otherwise compound, so its cost grows with time. The arithmetic below is ours, not a published forecast. It assumes a one-time $100,000 investment, a 7% annual gross return, annual compounding, no taxes, and no further contributions.
| Annual fee | Net return | Value after 30 years |
|---|---|---|
| 0.05% (typical index mutual fund, ICI) | 6.95% | about $750,000 |
| 0.64% (typical active equity mutual fund, ICI) | 6.36% | about $636,000 |
| 1.00% (a pricier active fund) | 6.00% | about $574,000 |
The 7% gross return is a placeholder, not a prediction, and the table makes a fixed-return assumption that real markets never honor. What carries over to the real world is the shape of the result: a gap of roughly half a percentage point a year becomes a gap of about $115,000 over three decades on this balance, and a one-point fee gap costs about $187,000 relative to a zero-fee fund. For the underlying math, see our explainer on compound interest.
An active fund can still be worth its fee if it earns more than the fee gap. That is the whole question, and it is empirical.
The SPIVA scorecard: what 20 years of data show
S&P Dow Jones Indices publishes the SPIVA (S&P Indices Versus Active) scorecard, which compares the returns of actively managed funds with the benchmark that matches each fund's stated style. SPIVA is built to avoid three common distortions:
- Survivorship bias. Funds that were closed or merged during the period still count, because an investor at the start could have owned them. Many comparisons quietly drop the dead funds, which flatters the active side.
- Mismatched benchmarks. A small-cap fund is measured against a small-cap index, not the S&P 500.
- Double counting. Only the largest share class of each fund is counted, and index funds are excluded from the active universe.
The year-end 2024 U.S. scorecard, which uses data through December 31, 2024, gives the following share of funds that underperformed their benchmark, based on absolute (not risk-adjusted) return:
| Category | Benchmark | 1 year | 10 years | 15 years | 20 years |
|---|---|---|---|---|---|
| All domestic funds | S&P Composite 1500 | 78.65% | 89.70% | 93.23% | 94.11% |
| All large-cap funds | S&P 500 | 65.24% | 84.34% | 89.50% | 91.99% |
| All mid-cap funds | S&P MidCap 400 | 62.00% | 77.32% | 87.50% | 90.93% |
| All small-cap funds | S&P SmallCap 600 | 29.69% | 82.22% | 90.68% | 90.80% |
| Real estate funds | S&P United States REIT | 80.52% | 82.42% | 88.00% | 90.12% |
Source: S&P Dow Jones Indices, SPIVA U.S. Scorecard, Year-End 2024, Report 1a.
Read the columns left to right and the pattern is the story. The one-year numbers bounce around, and in 2024 only 30% of small-cap managers trailed their index. But every category's underperformance rate rises as the window lengthens. The report's own summary says that over the 15-year period ending December 2024 there were no categories in which a majority of active managers outperformed.
Survivorship is the quiet half of the story
The table above counts a fund as an underperformer if it died, which is the right treatment, but it hides how large the attrition is. SPIVA's Report 2 shows how many funds were still alive at the end of each window.
| Window | Domestic funds at start | Share still alive at end |
|---|---|---|
| 5 years | 2,168 | 83.76% |
| 10 years | 2,514 | 63.92% |
| 15 years | 2,938 | 49.49% |
| 20 years | 2,376 | 36.41% |
Source: SPIVA U.S. Scorecard, Year-End 2024, Report 2, "All Domestic Funds."
Among large-cap funds the 20-year survival rate was 32.95%, from a starting group of 774. Put plainly, two out of every three large-cap funds an investor could have bought at the end of 2004 had been merged away or shut down by the end of 2024. Funds that lag tend to be folded into better-performing siblings, which erases their record from fund-company marketing materials. An investor who only looks at funds that exist today sees a better history than the one that happened.
The recent update, and why 2025 looked even worse
The scorecard for calendar 2025, published in 2026, reported that 79% of large-cap funds underperformed the S&P 500 that year, versus 65% in 2024, with mid-cap at 55% and small-cap at 41%, according to a MARKETS Group summary of the S&P data. One year does not make a trend, but it fits a pattern S&P described in its 2024 report: when the index's largest stocks dominate, active management gets harder, because many managers hold less of those stocks than the index does.
That mechanism is visible in the 2024 data. S&P found that the five largest stocks accounted for 45% of the S&P 500's return for the year, in a year when the S&P 500 returned about 25%. A manager who owned the market's other 495 stocks in index-like weights, or deliberately held less of the giants, was swimming against the tide even if the choices were individually sensible.
Two ways the scorecard could mislead, and how it holds up
Any single statistic deserves a skeptical look. SPIVA has two features that readers sometimes use to wave the result away.
- The benchmark is the S&P 500, and the S&P 500 has been unusually strong. That is true, and it is why the report also measures each fund against a style-matched index. Even so, the large-cap core and growth categories still show 20-year underperformance above 90%.
- Absolute return ignores risk. A fund could trail the index but take less risk. SPIVA's Report 1b answers this with a risk-adjusted view, in which 95.48% of large-cap funds trailed over 20 years. Adjusting for risk made the active record look worse here, not better.
The data support a narrower claim than "active management never works." They support this one: as a group, and net of fees, active U.S. stock funds have lost to cheap benchmarks over long periods, and the share that lose rises with time.
Why active funds lose: Sharpe's arithmetic
William Sharpe, who shared the 1990 Nobel Prize in Economics, published a short paper in the Financial Analysts Journal in 1991 called "The Arithmetic of Active Management". Its argument fits in a paragraph, and it does not depend on anyone being foolish.
Divide all investors in a market into two groups. Passive investors hold every security in market proportion. Active investors hold everything else. Together they must hold the whole market, and the active group's holdings are whatever the passive group does not own. So, before costs, the average actively managed dollar and the average passively managed dollar earn the same return, which is the market return. Sharpe's own wording is that "before costs, the return on the average actively managed dollar will equal the return on the average passively managed dollar." Subtract costs, which are higher for active management, and the paper's conclusion follows: "the after-cost return from active management must be lower than that from passive management."
Poker offers a good analogy. Imagine a table where every player is equally skilled and the house takes a rake from each pot. Over many hands the average player leaves with less than they brought, not because the cards are unfair but because the house takes a cut. Some players will still walk away winners, and a few will win by a lot. But the group as a whole cannot win, and the bigger the rake, the worse the average result. An active fund is a seat at that table, and an index fund is staying home and owning the casino's average payout.
Sharpe's argument also contains a subtle point. For one manager to beat the market, another manager must lose to it by the same amount before costs. Winners need losers, and in a market dominated by professionals the losers are other professionals. That is why the paper does not rely on retail investors being bad at this. Even a market of experts produces the same arithmetic.
Four drags that sit on top of the fees
Fees are the biggest line item, but they are not the only one.
- Trading costs. Funds that buy and sell often pay commissions and give up the gap between buying and selling prices, known as the bid-ask spread. These costs never appear in the expense ratio. They reduce returns directly.
- Taxes. In taxable accounts, funds that sell winners distribute realized capital gains to shareholders, who owe tax on them. An index fund that holds the same stocks for years distributes less. This is an effect on after-tax returns rather than on pre-tax performance, so it does not show up in SPIVA's headline figures.
- Cash drag. Funds hold some cash to meet redemptions. In a rising market, cash earns less than stocks.
- Style drift. A fund can wander from its stated category, so a "large-cap core" fund may end up with a different risk profile than the buyer expected. SPIVA measures this too: over 20 years, the style consistency of all large-cap funds was 59.30%.
Luck versus skill: the Fama-French test
SPIVA tells you what happened. A separate question is whether the winners were skilled or merely lucky. If 10,000 people flip coins, a few will flip heads 14 times in a row, and nobody concludes that they have a gift.
Eugene Fama and Kenneth French tackled this in a 2010 Journal of Finance paper, "Luck versus Skill in the Cross-Section of Mutual Fund Returns". They found that the combined portfolio of actively managed U.S. equity funds closely tracks the market, and that the high costs of active management "show up intact as lower returns to investors." Their bootstrap simulations, which reshuffle the data to see how much outperformance luck alone would produce, suggested that few funds generate returns high enough to cover their costs. Gross of costs, they found evidence of both inferior and superior performance in the tails of the distribution. So some skill exists. Most of it is consumed by the fee.
Later work has challenged parts of their method, and the debate over how many managers have real skill is not settled. What nobody in that debate disputes is the cost hurdle. A manager must beat the benchmark by more than their fee, every year, and then keep doing so after investors have noticed.
The famous exceptions, read carefully
There are real counterexamples. They are worth examining because their circumstances show why they are hard to copy.
Peter Lynch and Fidelity Magellan (1977 to 1990). Lynch averaged a 29.2% annual return running the fund, while the S&P 500 averaged about 14% a year over the same stretch, according to a Motley Fool analysis. That is an extraordinary record. The same analysis argues it happened in an unusually favorable environment: a recovery from 1970s inflation, corporate tax cuts, and the end of fixed brokerage commissions in 1975. A record from that period says Lynch was exceptional, but it cannot tell you which manager will be exceptional next.
Renaissance Technologies' Medallion Fund. Reported average annual returns for the fund have been above 60% before fees over roughly three decades. A 2024 academic paper on arXiv, a preprint that has not been peer reviewed, argues that averaging yearly returns overstates the compounded result and estimates Medallion's compounded return before fees at probably under 35%. That is still remarkable. It is also a private fund built on short-term quantitative trading, which is not something an ordinary investor can buy.
Warren Buffett. Berkshire Hathaway is a holding company that runs businesses and invests in stocks, not a fund an investor can buy at net asset value with the same structure. Buffett's own advice to ordinary investors is notable. In his 2013 letter to shareholders he described advice for the trustee of his wife's inheritance: put 10% in short-term government bonds and 90% in a very low-cost S&P 500 index fund, expecting that the trust's long-term results would be "superior to those attained by most investors," as quoted by the Motley Fool. He framed it as advice for a specific family situation, and it is not a recommendation for any reader.
The bet that made the argument public
Buffett made a wager that a low-cost S&P 500 index fund would beat a portfolio of hedge funds, after fees, over the ten years from January 1, 2008 to December 31, 2017. Ted Seides of Protege Partners took the other side and picked five funds of hedge funds. As Fortune reported after nine years, the Vanguard S&P 500 fund had compounded at 7.1% a year for a total gain of 85.4%, while the five funds of funds averaged 2.2% a year, a total gain of 22%. The best of the five gained 62.8% over the period and the worst gained 2.9%. Buffett's comment in the letter was that when Wall Street charges high fees, "it will usually be the managers who reap outsized profits, not the clients."
One bet does not prove a rule. Hedge funds aim to deliver different risk patterns rather than to beat the S&P 500 every year, and the period included a severe bear market and a long recovery. But the bet shows the cost hurdle in action, since funds of funds charge a layer of fees on top of the underlying funds' fees.
What happens when individuals pick stocks themselves
If professionals struggle, what about direct stock picking by individuals? The best-known study is Brad Barber and Terrance Odean's "Trading Is Hazardous to Your Wealth", published in the Journal of Finance in April 2000. They examined 66,465 households with accounts at a large discount broker from 1991 to 1996. The market returned 17.9% a year over that stretch. The average household earned 16.4%, and the households that traded most actively earned just 11.4%.
Before trading costs, the households did about as well as the market. The paper's explanation is that overconfidence leads to excessive trading, and the costs of that trading, in commissions and spreads, account for the penalty. The data come from the 1990s, when trading costs were higher than they are today, so the size of the gap should not be applied to present conditions. The direction of the finding, that more activity tended to mean lower net returns, is the part that carries over.
How index funds took over, and what the shift means
John Bogle founded Vanguard in 1975. On August 31, 1976 it launched the First Index Investment Trust, now the Vanguard 500 Index Fund, the first index mutual fund open to the general public. According to Vanguard's own history, the underwriting hoped to raise $50 million to $150 million and raised a little more than $11 million. Bogle later called the offering "an abject failure," and critics dubbed the fund "Bogle's Folly."
It took decades for that skepticism to fade. ICI reports that index funds' share of all long-term mutual fund and ETF net assets in the United States grew from 19% at year-end 2010 to 52% at year-end 2025, and that index mutual funds alone held $7.7 trillion, or 32% of long-term mutual fund net assets. Those percentages describe fund assets, not stock market ownership. Most U.S. stocks are still held by other kinds of owners, including institutions, individuals who pick their own stocks, and corporate insiders.
That distinction answers a common worry. If everyone indexed, who would set prices? Active trading by hedge funds, market makers, and other investors keeps setting prices, and the passive share of fund assets, while now past half, is not the whole market. The existence of index funds depends on active investors doing price discovery, which is one reason index investors benefit from a market that others keep honest.
Where active management can still make sense
Honest accounting requires examining where the case for indexing is weaker. Three areas deserve mention.
Bond funds. SPIVA's fixed-income results are less one-sided than its equity results. In 2024, the average one-year underperformance rate across fixed-income categories was 41%. Results varied widely by category: only 12% of Investment-Grade Short and Intermediate funds underperformed their benchmark, while 95% of Government Intermediate funds did. Narrow or specialized mandates. Some investors want exposures a broad index does not provide, such as a screen that excludes certain industries, a concentrated income strategy, or tax-loss harvesting at scale. Those are reasons to hold something other than a plain index fund, but they are objectives, not promises of outperformance.
Less-researched markets. The usual argument is that small, illiquid, or poorly covered markets leave more room for analysis to pay off. The SPIVA data are mixed on this. In the table above, small-cap and real estate funds still show 90%-plus underperformance at 20 years.
What indexing does not protect you from
Choosing an index fund removes manager risk and high fees. It leaves market risk fully in place. An S&P 500 index fund lost money when the S&P 500 did, and it will again. An index is also a design choice. A market-cap-weighted index like the S&P 500 puts more money in the stocks that have already grown the most, so its concentration can rise over time. In the 2024 data above, five stocks drove 45% of the index's return. Investors who care about concentration can hold other indexes, including equal-weighted and international ones, but each choice is a bet on something. Our explainer on why diversification reduces risk lays out what spreading holdings does and does not accomplish.
Factor funds: the middle ground
Between pure indexing and stock picking sits factor investing. Factor funds follow rules-based strategies that tilt toward characteristics historically associated with different returns, such as cheap stocks (value), small companies (size), or recent winners (momentum). Fama and French's 1993 paper in the Journal of Financial Economics showed that market, size, and value factors explain much of the variation in stock returns, which is one reason researchers are skeptical that some apparent manager skill is more than exposure to those known factors.
Factor funds are transparent and cheaper than most active funds, but they are not free money. A factor can underperform the market for a decade or more, and a fund that buys a factor after it has had a good run is buying at a higher price. The honest summary is that factor funds are a rules-based tilt with a risk of long dry spells, not a way to avoid risk.
A template, not a prescription: the three-fund portfolio
Many index investors build a portfolio from three broad funds: a total U.S. stock market fund, a total international stock fund, and a total bond fund. The idea, popular with the Bogleheads community that follows Bogle's philosophy, is to own the world's stocks and a bond cushion at very low cost. As an illustration only, someone might split money 60% U.S. stocks, 20% international stocks, and 20% bonds, but the right mix depends on a person's goals, time horizon, and tolerance for losses, and many reasonable investors use different ones.
Once you own more than one fund, two practical questions arise. One is how to keep the mix from drifting, which is the subject of our piece on portfolio rebalancing. The other is when to invest: all at once or in installments, which we cover in the dollar-cost averaging explainer. Account type matters as well, since where you hold a fund affects taxes, as discussed in Roth IRA vs 401(k). Some people hand all of this to an automated service, and robo-advisors vs human financial advisors compares those options.
Index vs active at a glance
| Feature | Index funds | Active funds |
|---|---|---|
| Goal | Match a benchmark | Beat a benchmark |
| Typical asset-weighted expense ratio (U.S. equity mutual funds, 2025) | 0.05% | 0.64% |
| Share of large-cap funds trailing the S&P 500 over 20 years | Not applicable (tracks the index, minus fees) | 91.99% (SPIVA, to December 2024) |
| Share of large-cap funds alive after 20 years | Not measured by SPIVA | 32.95% |
| Manager risk | Low | High |
| Tax drag in taxable accounts | Generally lower | Generally higher |
| What it protects you from | High fees, manager error | Nothing in particular; may hold less of a market's biggest stocks |
| What it does not protect you from | Market declines, index concentration | Market declines, high fees, poor stock selection |
The takeaway
The case for index funds rests on arithmetic more than on any one study. Before costs, the average active dollar earns the market return, so after costs it earns less, and a 20-year record in which about 92% of large-cap funds trailed the S&P 500 is what that arithmetic looks like in practice. The exceptions exist and are real, but they are hard to identify beforehand, rarely repeat, and are often not available to ordinary investors. The areas where active management looks more competitive, such as some bond categories, are narrower than the marketing suggests.
What the evidence does not say is just as important. It does not say index funds are safe, that active funds never win, or that any particular allocation suits any particular person. It says that fees are known, performance is not, and the fee gap is a hurdle that most funds have not cleared over long stretches. How much that matters to you depends on facts this article cannot see, which is where a qualified professional comes in.
FAQ
Q: If everyone indexed, would markets stop working? A: Prices are set by trading, and index funds do not generate the research that sets them. ICI data show index funds held 52% of long-term mutual fund and ETF net assets at year-end 2025, but that measures fund assets, not the whole stock market. Hedge funds, market makers, and other active investors still trade actively and keep setting prices. The practical result is that indexing relies on active investors rather than replacing them.
Q: Don't active managers do better in bear markets? A: Not reliably. SPIVA's annual data show that 56% of large-cap funds trailed the S&P 500 in 2008 and 51% did in 2022, both years of sharp market declines, compared with a 64% average across the 24-year history of the scorecard. Active funds did better in those years than average, but a majority still lagged. A fund can lose less in a downturn and still trail over a full cycle.
Q: Are target-date funds index or active? A: Both kinds exist. A target-date fund adjusts its mix of stocks and bonds as a chosen retirement year approaches, and it can be built from index funds or active funds underneath. The expense ratio and the underlying holdings are listed in the fund's prospectus, so checking those tells you which kind you are looking at.
Q: What about hedge funds? A: Hedge funds pursue different goals and charge higher fees, so they are not a clean comparison. The Buffett and Protege Partners wager is the best-known test. Over its first nine years, the S&P 500 index fund compounded at 7.1% a year versus 2.2% for the five funds of funds, per Fortune. It is one wager, not a study, and it does not cover every hedge fund strategy.
Q: Can I just buy individual stocks instead? A: You can, but you become an active investor. Barber and Odean's study of 66,465 brokerage households from 1991 to 1996 found the average household earned 16.4% a year against 17.9% for the market, and the most frequent traders earned 11.4%. The sample is old and trading costs have fallen, so the figures are historical. The finding that heavy trading tended to lower net returns is the lasting part.
Q: Does SPIVA count funds that closed? A: Yes. This is a core feature of the scorecard. A fund that was merged or liquidated during the period counts as part of the opportunity set. Over 20 years, only 36.41% of the 2,376 domestic equity funds that existed at the start were still alive at the end, so ignoring closures would make active management look much better than it was.
Q: What does "past performance" mean for a decision like this? A: Past results describe what happened, not what will happen. The SPIVA record covers a particular 20-year stretch dominated by large U.S. stocks, and a different era could look different. The fee gap, by contrast, is known in advance and persistent, which is why most of the argument in this article rests on it.
Sources
- S&P Dow Jones Indices, SPIVA U.S. Scorecard, Year-End 2024 (data through December 31, 2024)
- MARKETS Group, SPIVA U.S. Scorecard summary, calendar 2025
- Sharpe, W. F. (1991), The Arithmetic of Active Management, Financial Analysts Journal 47(1)
- Investment Company Institute, 2026 Investment Company Fact Book, chapter 6
- Investment Company Institute, Mutual fund and ETF fees remained near historic lows in 2025
- Vanguard, 50 years, 50 facts: indexing since 1976
- Fama, E. F. and French, K. R. (2010), Luck versus Skill in the Cross-Section of Mutual Fund Returns, Journal of Finance 65(5)
- Barber, B. M. and Odean, T. (2000), Trading Is Hazardous to Your Wealth, Journal of Finance 55(2)
- Fortune (2017), Warren Buffett scorches the hedge funds
- The Motley Fool (2019), Warren Buffett's investing plan for his family
- The Motley Fool (2026), Peter Lynch's annual return at Fidelity Magellan
- arXiv (2024), Compounded returns of the Medallion Fund
- Fama, E. F. and French, K. R. (1993), Common risk factors in the returns on stocks and bonds, Journal of Financial Economics
Follow new articles
Add SciHub101 to your feed reader to see new science and technology stories.
About the Author
SciHub101 is an independent science and technology publication founded and edited by Buğra Sözeri, a software engineer and app developer based in Türkiye. AI tools assist with drafting and research. Source documentation in the existing archive is uneven, and articles are being reviewed and corrected. The Editorial Team byline identifies editorial responsibility; it does not certify specialist or independent human review. Where we compare products, anything built by our own team is labelled as such — see the editorial guidelines and About page for how corrections and disclosures work.
Related Articles

High-Yield Savings Accounts Explained
How HYSAs work, current 4-5% rates, FDIC insurance, and how they compare to CDs, T-bills, and money market funds for parking cash safely.

How Credit Cards Work: APR, Fees and US Protections
How credit cards work: interchange fees, grace periods, APR, promotional offers and secured cards, plus the limits of US consumer fraud protections.
What Is FIRE? Financial Independence Retire Early
What is the FIRE movement? Financial Independence Retire Early explained — 4% rule, savings rates, leanFIRE vs fatFIRE, math, and criticisms.

ETFs Explained — Index Funds Made Simple
How ETFs and index funds work: creation and redemption, fees compounding over 30 years, taxes, popular funds, and leveraged ETF traps, with 2025 ICI data.

The 4% Rule Explained — Safe Withdrawal Rate
Where the 4% retirement rule came from, what it really says, why critics push 3.25-3.5%, and how Bengen, Trinity, and modern updates compare.
Portfolio Rebalancing — When and How to Rebalance
Rebalancing keeps your portfolio at its target risk. How often to rebalance, threshold vs. calendar methods, tax tricks, and what the research says.