Single-Cell RNA Sequencing Explained: How Scientists Read Gene Activity One Cell at a Time
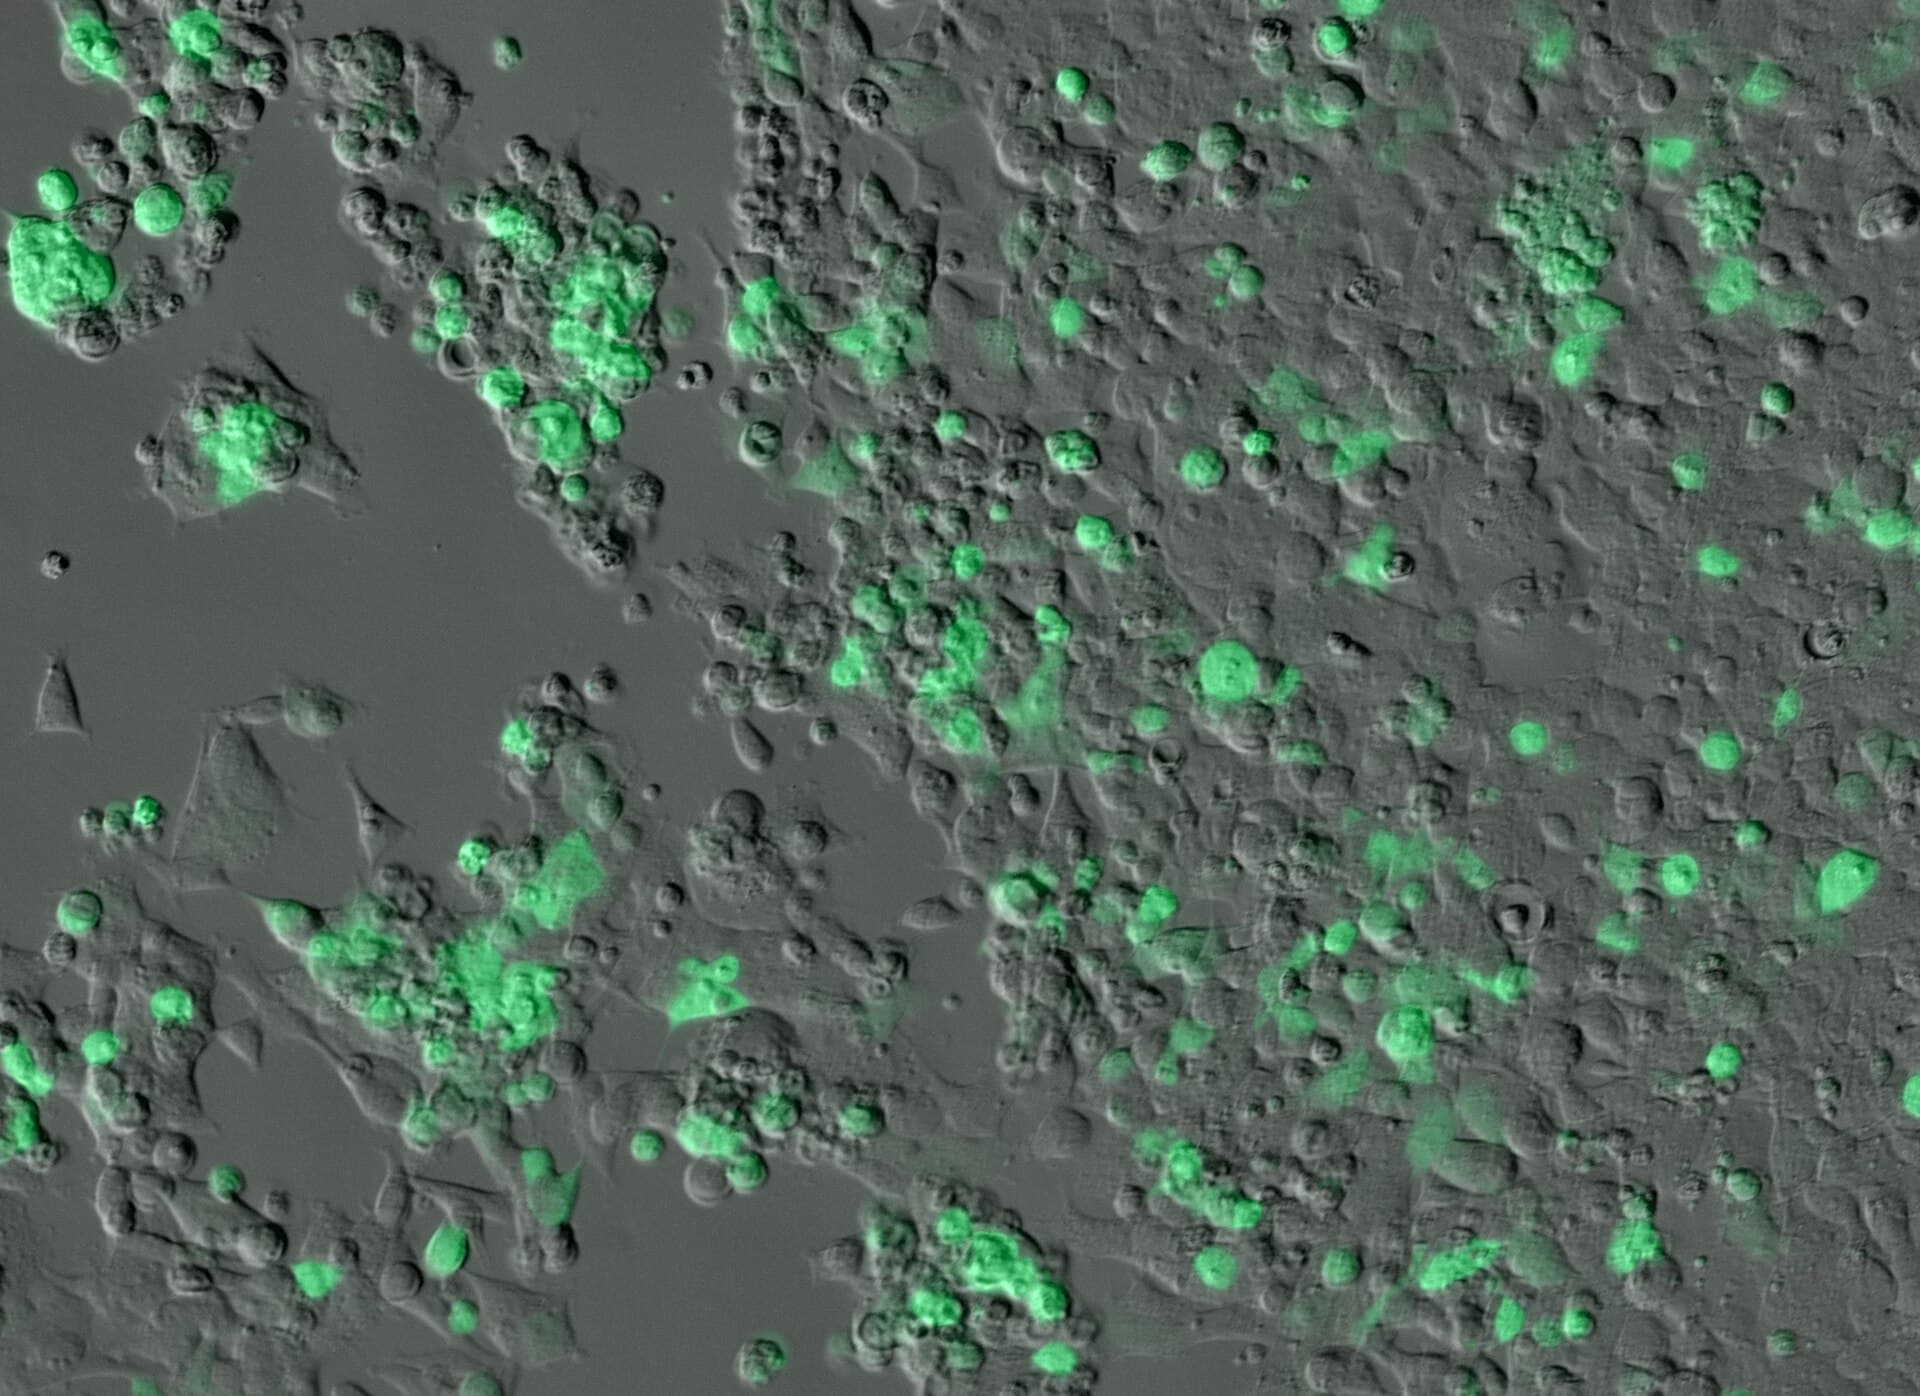
Photo: ZEISS Microscopy (CC BY 2.0) / Wikimedia Commons / CC BY 2.0
A tissue sample can contain many cell types, and those cells can occupy different states. A bulk RNA-sequencing experiment measures an average signal across the sample, much like blending a fruit salad into a smoothie: you learn the overall flavor but lose the individual pieces. Single-cell RNA sequencing, or scRNA-seq, separates the measurement into individual cells or nuclei so researchers can ask how gene activity varies from one cell to the next. This article explains the workflow, the analysis, and the limits that keep a colorful cluster map from being a finished answer.
The method is not a microscope that reads every gene perfectly in every cell. It is a chain of steps: tissue handling, cell isolation, molecular barcodes, reverse transcription, library preparation, sequencing, and computational inference. Some transcripts are missed, cells can be stressed during dissociation, and the cells that survive preparation may not represent the original tissue.
The output is usually a sparse count matrix: rows represent genes, columns represent cells or nuclei, and values estimate how many transcripts were captured. Researchers use quality control, normalization, dimensionality reduction, clustering, marker analysis, and validation to interpret it. These steps are powerful, but each one carries assumptions.
Direct answer: Single-cell RNA sequencing measures captured RNA transcripts separately from individual cells or nuclei rather than averaging an entire tissue. It can reveal cell populations, rare states, developmental trajectories, and disease-associated changes. The method is limited by sampling, tissue dissociation, dropout, doublets, batch effects, sequencing depth, and computational annotation. A cluster is an analytical pattern, not automatically a biological cell type or a clinical diagnosis.
RNA, genes, and the transcriptome
Genes are encoded in DNA, but RNA molecules reflect which genes are being transcribed and processed in a cell at a particular time. The collection of RNA transcripts is the transcriptome. It changes with cell type, developmental state, stimulus, disease, environment, and technical conditions. For the underlying machinery, see how genes actually work.
RNA abundance is not identical to protein abundance or function. A transcript can be degraded, translated at different rates, or regulated after transcription, as described in how proteins are made. scRNA-seq therefore provides an important layer of evidence, not a complete readout of cellular biology.
Bulk versus single-cell sequencing
Bulk RNA-seq pools many cells and measures an average. It gives strong signal for abundant transcripts and is often simpler. scRNA-seq preserves cell-level variation but captures fewer transcripts per cell and requires more complex analysis.
The methods answer different questions. Bulk sequencing may be better for precise overall expression in a homogeneous sample; scRNA-seq may be better for heterogeneity, rare populations, and cell-state transitions.
| Feature | Bulk RNA-seq | scRNA-seq |
|---|---|---|
| Unit measured | Average over many cells | Individual cell or nucleus |
| Strength | Depth per gene; simpler analysis | Cell types, rare states, heterogeneity |
| Weakness | Hides mixtures and opposing responses | Sparse data; dropout; heavier statistics |
| Typical output | Gene-by-sample table | Gene-by-cell sparse matrix |
| Replication unit | Sample or donor | Still the donor, not the cell |
How the field got here
Sequencing the transcriptome of a single cell became practical around 2009. A study in Nature Methods profiled a single mouse blastomere (an early embryo cell) with mRNA-Seq, detected about 75% more genes than microarrays did, and identified more than 1,700 previously unknown splice junctions (Tang et al., Nature Methods, 2009). The method worked, but it processed one cell at a time by hand.
Scale arrived in 2015. Drop-seq separated thousands of cells into nanoliter droplets, tagged each cell's RNA with a distinct barcode, and sequenced them together. The authors applied it to 44,808 mouse retinal cells and identified 39 transcriptionally distinct populations (Macosko et al., Cell, 2015). A companion paper in the same issue described a related droplet method, inDrop, applied to mouse embryonic stem cells (Klein et al., Cell, 2015).
Commercial droplet systems pushed throughput further. A 2017 paper describing the 10x Genomics platform reported roughly 50% cell capture efficiency, processing of up to 8 samples at once, and a profile of about 68,000 peripheral blood mononuclear cells (Zheng et al., Nature Communications, 2017). Today, studies with tens of thousands to millions of cells are routine enough that data science, not the sequencer, is the bottleneck; a 2020 paper in Genome Biology listed eleven grand challenges for single-cell data science for that reason (Lähnemann et al., Genome Biology, 2020).
How the laboratory workflow works
Tissue collection
The sample's origin, time, temperature, storage, and handling affect RNA quality and cell composition. Fragile cells may die during transport. A tissue sample is also a sample of a location and time, not the entire organism.
Dissociation or nuclei isolation
Solid tissue can be mechanically and enzymatically dissociated into cells. The process may remove extracellular structures, stress cells, preferentially lose fragile populations, or change gene expression. A 2017 Nature Methods letter titled "Single-cell sequencing reveals dissociation-induced gene expression in tissue subpopulations" documented exactly this problem: the preparation step itself leaves a transcriptional footprint (van den Brink et al., Nature Methods, 2017).
Nuclei sequencing isolates nuclei instead of intact cells and can work with preserved or difficult tissues. A droplet method called DroNc-seq profiled 39,111 nuclei from archived mouse and human brain samples (Habib et al., Nature Methods, 2017). The transcript profile of a nucleus differs from that of a whole cell, so the two approaches are not interchangeable.
Barcoding
Each cell or nucleus is assigned a molecular barcode. Transcripts from that cell receive the barcode during library preparation, allowing sequencing reads to be assigned back to the originating partition. Think of it as writing a cell's name on every letter it sends: the barcode is a mailing label, not a biological identity.
Reverse transcription and library preparation
RNA is converted into complementary DNA, amplified, and prepared for sequencing. Protocols differ in which transcript ends they capture, whether they measure full length, how many genes are detected, and how much material is required. Smart-seq2, a widely used plate-based protocol, generates full-length cDNA with improved sensitivity and takes about two days from cell picking to a sequencing-ready library, but it is not strand-specific and cannot detect non-polyadenylated RNA (Picelli et al., Nature Protocols, 2014).
Sequencing
The library is sequenced, and reads are aligned or quantified against a reference genome or transcriptome. The result is processed into counts, but mapping ambiguity, reference annotation, and quality filters affect the matrix.
Droplet-based and plate-based approaches
Droplet-based methods partition many cells into droplets containing beads with barcodes. They scale to large numbers of cells but often capture a limited portion of each cell's transcriptome. Plate-based methods isolate cells into wells and may offer deeper or full-length measurement for selected cells, but they process fewer cells.
| Approach | Typical strength | Typical trade-off | Example from the literature |
|---|---|---|---|
| Droplet (3' counting) | Tens of thousands of cells per run | Shallower per cell | Drop-seq: 44,808 retinal cells |
| Plate-based, full length | Depth, isoforms, splice junctions | Fewer cells | Smart-seq2 protocol |
| Single-nucleus | Works with preserved tissue | Different transcript profile | DroNc-seq: 39,111 nuclei |
The technology choice depends on whether the study prioritizes scale, depth, rare populations, spatial context, isoforms, cost, or sample type. A larger cell count does not automatically provide a better biological answer if the sample is biased or each cell has very sparse information.
The count matrix and quality control
The basic matrix records genes by cells. A zero can mean the gene was not expressed, the transcript was not captured, the sequencing depth was insufficient, or the molecule was filtered. This is called dropout or technical sparsity. Reading every zero as "off" is like assuming a missing letter in a damaged word means the letter was never written.
Quality-control measures may include total detected genes, total counts, mitochondrial transcript fraction, ribosomal fraction, doublet scores, and cell-cycle indicators. Thresholds should be justified because filtering can remove genuine biology, particularly fragile or low-RNA cell types.
Doublets
A doublet occurs when two cells share one barcode, producing a hybrid profile that can look like a new cell type. Computational tools estimate this risk. Scrublet simulates doublets from the data and trains a nearest-neighbor classifier to flag likely ones without prior clustering (Wolock et al., Cell Systems, 2019), and scDblFinder, a Bioconductor method, was reported by its authors to outperform alternative methods in an independent benchmark (Germain et al., F1000Research, 2021). Heterotypic doublets, which combine two different cell types, are the ones most likely to be mistaken for novel populations.
A sample with many high-quality cells can still be biased if one population survives dissociation better than another. Quality control must consider biology and technical metrics together.
Normalization and scaling
Cells receive different numbers of captured transcripts. Normalization attempts to make expression values comparable, but the correct method depends on protocol and analysis goal. Log transformations, size-factor methods, variance stabilization, and model-based approaches make different assumptions.
A normalized value is not a direct molecule count. Researchers should report the method, parameters, and software version. Small changes can affect variable-gene selection, clustering, and differential-expression results. A 2019 tutorial in Molecular Systems Biology lays out a standard sequence of preprocessing steps, from quality control and normalization through feature selection and dimensionality reduction, with recommendations based on independent comparison studies (Luecken and Theis, Mol Syst Biol, 2019).
Dimensionality reduction and clustering
A dataset may contain thousands of genes per cell. Dimensionality-reduction methods such as principal-component analysis, UMAP, or t-SNE represent high-dimensional relationships in fewer dimensions for visualization or downstream analysis.
These maps are useful but not literal geography. They resemble a flat map of the globe: every flat map distorts something, and which distortion you accept depends on the projection. A 2023 paper in PLoS Computational Biology argued that reducing data from hundreds or thousands of dimensions to two or three inevitably induces significant distortion, and recommended treating such embeddings with caution for exploratory biology (Chari and Pachter, 2023). Distances and clusters can change with genes selected, scaling, neighbors, parameters, and random initialization. A visual island is not proof of a distinct biological cell type.
Clustering groups cells according to measured similarity. It may reveal known populations or new states, but the number of clusters is a modeling choice. Researchers annotate clusters using marker genes, reference atlases, protein measurements, morphology, or functional experiments.
Cell-type annotation
A cluster's identity is inferred from evidence. Marker genes can be shared across related cells, induced by stress, or missing because of dropout. Automated reference-mapping tools can help but may force new states into the nearest known label.
Good annotation reports markers, reference, uncertainty, and alternative interpretations. Validation with flow cytometry, immunostaining, spatial methods, perturbation, or independent samples strengthens the claim.
A concrete example shows the payoff when annotation succeeds. In a 2017 Science study, unbiased scRNA-seq of about 2,400 human blood cells identified six dendritic cell subtypes and four monocyte subtypes, including a new dendritic cell subset that resembles plasmacytoid dendritic cells but strongly activates T cells (Villani et al., Science, 2017). Categories that older marker-based methods had lumped together were separated by whole-transcriptome profiles. For how these cells fit into defense, see how the immune system recognizes threats.
State versus type
A cell type describes a relatively stable lineage or identity; a cell state describes a condition such as activation, stress, cell cycle, or differentiation. A state can occur across types. Confusing state with type can produce an oversimplified biological story. The dissociation artifacts described above are a good example of a technical state mistaken for a biological one.
Batch effects and integration
A batch effect is systematic variation introduced by sample processing date, operator, reagent lot, instrument, protocol, tissue storage, or sequencing run. Batch can align with disease group or tissue source, making it difficult to distinguish biology from technical variation.
Integration methods can reduce unwanted variation, but aggressive correction may remove real biological differences. A 2022 benchmark in Nature Methods tested 68 method and preprocessing combinations on 85 batches from 23 publications, covering more than 1.2 million cells across 13 integration tasks, and found that selecting highly variable genes improved performance and that scaling pushed methods to favor batch removal over biological conservation (Luecken et al., Nature Methods, 2022). Methods named as performing well included scANVI, Scanorama, scVI, and scGen, particularly on complex tasks. The best solution is still often experimental design: randomize samples, process groups together where possible, include controls, and preserve metadata.
A combined atlas should record sample, donor, tissue, disease, treatment, protocol, batch, and sequencing information. Harmonizing a matrix does not erase the underlying differences in how samples were collected.
Differential expression
Researchers compare transcript abundance between cells or groups. A valid comparison requires a defined unit of replication. Treating thousands of cells from one donor as thousands of independent biological replicates can exaggerate statistical confidence. It is like polling one household of 5,000 imaginary people and reporting the result as a national survey.
A 2021 paper in Nature Communications showed that single-cell differential expression methods that ignore variation between biological replicates are biased and prone to false discoveries; the most widely used methods can discover hundreds of differentially expressed genes even when no biological difference exists (Squair et al., Nature Communications, 2021). Pseudobulk or mixed-effects approaches aggregate or model cells by donor while preserving structure. Report effect size, uncertainty, multiple-testing correction, and biological relevance, not only a list of significant genes.
Trajectories and pseudotime
Cells can represent stages of a process such as differentiation or activation. Trajectory methods order cells along a computational path called pseudotime. An early example, Monocle, used single-cell data from differentiating human myoblasts to detect abrupt shifts in key regulators and sequential waves of gene regulation, and some predicted regulators were validated in a loss-of-function screen (Trapnell et al., Nature Biotechnology, 2014). The result can suggest a transition, but it is not a time-lapse movie.
A trajectory is more like a set of photographs of different people at different ages, arranged to suggest one person's life, than a film of a single person. It depends on sampling, manifold structure, genes selected, starting assumptions, and model. Time-course experiments, lineage tracing, perturbation, and spatial evidence can test the interpretation.
Spatial transcriptomics
scRNA-seq often loses the original location of cells, because tissue is taken apart before measurement. Spatial transcriptomics measures RNA while retaining spatial coordinates, or maps single-cell profiles back to tissue sections. It can reveal neighborhoods, gradients, and cell interactions.
Spatial methods differ in resolution, gene coverage, sensitivity, and sample preparation. A spatial spot may contain multiple cells, while a high-resolution method may detect fewer transcripts. Combining spatial and single-cell data requires careful alignment and uncertainty reporting.
What scRNA-seq can reveal
Rare populations
A sufficiently sampled dataset may identify rare cells that bulk averages hide. The rare population still must be present in the sample and survive preparation. A low frequency can also be technical noise or an artifact.
Cell identity decisions
Single-cell data can reveal gene-regulation rules that bulk data cannot express. A 2015 Science study of developing mouse olfactory neurons found that most mature neurons express only one of about 1,000 odorant receptor genes, at high levels, while immature neurons often express low levels of several at once; the restriction emerges during development (Hanchate et al., Science, 2015). An average across neurons would show all receptors as moderately active, and the one-neuron-one-receptor rule would be invisible.
Disease-associated states
Researchers can compare cell states between healthy and diseased tissue, identify activated pathways, or study changes after treatment. A 2018 Science study profiled about 58,000 cells from healthy adult mouse kidneys and identified a transitional cell type in the adult collecting duct and found Notch-mediated transitions between intercalated and principal cells that shifted toward principal cells in kidney disease (Park et al., Science, 2018). Causation requires additional experiments. For cancer context, see what causes cancer.
Development
Single-cell data can map changing cell populations across developmental stages. The result is a population snapshot across sampled times, not necessarily a continuous lineage. The same logic is used to test how faithfully lab-grown tissues copy real ones: a 2020 study compared cortical organoids against primary human cortex using single-cell transcriptomics, as covered in organoids explained.
Cell-cell communication hypotheses
Ligand-receptor analysis can suggest which cells may signal to each other. It does not prove that the proteins are present, active, spatially adjacent, or functionally causal. Protein, spatial, and perturbation evidence are valuable follow-ups.
A study-design framework
| Study decision | Why it matters | Evidence to document |
|---|---|---|
| Cell or nucleus method | Changes what is captured | Tissue, storage and protocol |
| Sample size | Affects population and donor variation | Cells, donors and replicates |
| Sequencing depth | Influences dropout and rare signals | Reads, genes and saturation |
| Quality filtering | Can remove biology | Thresholds and retained populations |
| Normalization | Changes comparability | Method and software version |
| Clustering | Creates analytical groups | Genes, parameters and stability |
| Annotation | Converts patterns to biology | Markers, references and validation |
| Differential test | Determines statistical evidence | Donor-level model and correction |
| Spatial validation | Preserves location | Method, resolution and limitations |
This framework keeps computational choices visible instead of treating a pipeline as a black box.
Atlases, data sharing, and reproducibility
The Human Cell Atlas is a global effort to build reference maps of all human cells. A Nature article published online in November 2024 described five ways cell atlases are already yielding insights and looked ahead to atlases as unified foundation models (Rood et al., Nature, 2025). A 2022 Nature Medicine perspective argued that atlases can connect genes, diseases, and therapies by identifying the cell types and states in which disease-linked genes act (Rood et al., Nature Medicine, 2022). Public programs such as the Human Cell Atlas and HuBMAP provide data and standards for cell mapping.
A useful record includes raw reads or controlled access, processed matrix, reference genome, metadata, code, parameters, sample provenance, and quality metrics. Privacy is important because genomic and transcriptomic data can be sensitive. De-identification has limits, especially when combined with donor information. Access and consent should be respected.
Reproducibility also means preserving software versions and random seeds where practical. A pipeline that produces a different cluster map after a library update should document the change. Machine-learning models trained on such atlases add another layer; see single-cell AI and cell-state prediction for how those models are built and what they can mislead.
Clinical boundaries
scRNA-seq is a powerful research method and may support translational studies. A research profile is not automatically a clinical diagnostic test. Clinical use requires validation, quality control, interpretation, regulation, and evidence for the specific decision. Researchers hoping to turn expression patterns into diagnostics face the problems described in machine learning for biomarker discovery: many candidate signals, few validated ones.
A gene-expression difference between groups does not tell a person what treatment to take. Health decisions require qualified professionals and validated clinical pathways.
Common misunderstandings
"A cluster is a cell type." A cluster is the output of an algorithm run with chosen parameters. It becomes a cell type claim only after markers, references, and validation support it.
"A zero means the gene is off." Dropout means a zero can reflect missed capture. Absence of signal is weaker evidence than presence.
"More cells always means better." Cells from one donor are not independent replicates, and a biased preparation scales its bias. The unit of replication is usually the donor.
"The UMAP plot shows how related the groups are." Distances between islands on a two-dimensional embedding can be distorted, as the 2023 critique argued.
"Pseudotime shows what happens over time." It orders snapshots by similarity. Independent time-course or lineage-tracing evidence is needed for real time.
Limitations
Single-cell RNA sequencing is a sample-based, technically sparse, and computationally inferred measurement. Dissociation can stress or lose cells; nuclei and intact-cell protocols measure different material; dropout hides transcripts; doublets combine cells; batch effects confound groups; clustering and annotation depend on parameters; and donor-level replication matters. A transcript is not a protein or a diagnosis. Results need orthogonal validation and should not be overgeneralized from one tissue, cohort, or cell atlas.
This article is educational and is not medical advice or a clinical test interpretation. For urgent symptoms or an emergency, contact local emergency services.
The takeaway
The value of scRNA-seq is that it turns an average into a distribution. A tissue stops being a single number per gene and becomes a population of cells in different states, with rare members and graded transitions. The cost is that every step between the tissue and the plot, from dissociation to clustering, is a choice that can shape the picture. The most reliable single-cell studies are the ones that make those choices visible, replicate across donors, and test their central claim with a method that does not share the same blind spots.
Frequently asked questions
Q: What is single-cell RNA sequencing? A: It is a method that measures captured RNA transcripts separately from individual cells or nuclei. Each cell receives a molecular barcode so that sequencing reads can be assigned back to it.
Q: How is scRNA-seq different from bulk RNA-seq? A: Bulk RNA-seq averages transcripts across many cells, while scRNA-seq preserves cell-level variation at the cost of greater sparsity and more complex statistics. Bulk is often better for precise overall expression in a uniform sample.
Q: What is dropout? A: Dropout is a zero or missing signal caused by limited capture or sequencing, not necessarily by true absence of a transcript. It is the reason a zero in the count matrix is weak evidence that a gene is off.
Q: What is a doublet? A: A doublet occurs when material from two cells is assigned to one barcode, creating a mixed profile. Tools such as Scrublet and scDblFinder estimate which barcodes are likely doublets, but detection is not perfect.
Q: Does a cluster equal a cell type? A: No. A cluster is an analytical grouping that requires biological annotation and validation. The number of clusters is partly a modeling choice, and stress or batch can create clusters that are not cell types.
Q: Why are donors more important than cell count? A: Many cells from one donor do not represent many independent people. A 2021 study showed that methods ignoring replicate variation can report hundreds of differentially expressed genes where no real difference exists.
Q: Can scRNA-seq diagnose disease? A: Research data are not automatically clinical diagnostics. Clinical use requires assay-specific validation, regulation, and outcome evidence. A gene-expression difference between groups is not a treatment recommendation.
Sources
- Tang F, et al. mRNA-Seq whole-transcriptome analysis of a single cell. Nature Methods, 2009. PubMed 19349980
- Macosko EZ, et al. Highly parallel genome-wide expression profiling of individual cells using nanoliter droplets. Cell, 2015. PubMed 26000488
- Zheng GXY, et al. Massively parallel digital transcriptional profiling of single cells. Nature Communications, 2017. doi:10.1038/ncomms14049
- van den Brink SC, et al. Single-cell sequencing reveals dissociation-induced gene expression in tissue subpopulations. Nature Methods, 2017. doi:10.1038/nmeth.4437
- Luecken MD, Theis FJ. Current best practices in single-cell RNA-seq analysis: a tutorial. Molecular Systems Biology, 2019. PubMed 31217225
- Luecken MD, et al. Benchmarking atlas-level data integration in single-cell genomics. Nature Methods, 2022. PubMed 34949812
- Squair JW, et al. Confronting false discoveries in single-cell differential expression. Nature Communications, 2021. doi:10.1038/s41467-021-25960-2
- Chari T, Pachter L. The specious art of single-cell genomics. PLoS Computational Biology, 2023. PubMed 37590228
- Human Cell Atlas. humancellatlas.org
This article is educational and does not provide clinical testing or bioinformatics-consulting advice.
Read next:
Follow new articles
Add SciHub101 to your feed reader to see new science and technology stories.
About the Author
SciHub101 is an independent science and technology publication founded and edited by Buğra Sözeri, a software engineer and app developer based in Türkiye. AI tools assist with drafting and research. Source documentation in the existing archive is uneven, and articles are being reviewed and corrected. The Editorial Team byline identifies editorial responsibility; it does not certify specialist or independent human review. Where we compare products, anything built by our own team is labelled as such — see the editorial guidelines and About page for how corrections and disclosures work.
Related Articles
Personalized Cancer Vaccines Explained: Neoantigens, mRNA and Clinical-Trial Reality
Personalized cancer vaccines are experimental immunotherapies built from a patient's tumor sequence. See how neoantigens are chosen and what trials show.
Single-Cell AI: Understanding Cellular Diversity at Scale
How machine learning decodes individual cell states from single-cell RNA sequencing data.
How Apoptosis Works: Why Healthy Cells Choose to Die
Apoptosis is programmed cell death. Learn how caspases, mitochondria, and Bcl-2 proteins carry it out, and what goes wrong in cancer and autoimmunity.
Organoids Explained: What Mini-Organs Can and Cannot Model
Organoids are 3D cell cultures that self-organize into organ-like structures. See how they are grown, what they have taught us, and why they are not tiny organs.