How the Human Heart Works: The Cardiac Cycle Explained

Photo: Alexander Krivitskiy / Pexels
The human heart beats roughly 100,000 times per day, every day, for an average of 75 to 80 years — without ever stopping to rest, without conscious supervision, and without missing a beat under most conditions. Over a lifetime, that amounts to approximately 2.5 billion contractions. Each one is triggered by an electrical signal generated within the heart itself, coordinated through a specialized conduction system, and timed with a precision that can be measured in milliseconds from electrodes placed on the skin. Understanding how this works — from the initial electrical spark to the mechanical pumping of blood — reveals a system that is simultaneously simple in its basic logic and extraordinary in its execution.
The Heart's Basic Architecture
The heart is a four-chambered muscular pump sitting in the mediastinum (the central chest cavity, between the lungs, behind the sternum). It is roughly the size of a closed fist and weighs about 250–350 grams in adults. The organ is made primarily of cardiac muscle (myocardium) — a tissue found nowhere else in the body, with properties intermediate between skeletal and smooth muscle: striated like skeletal muscle, involuntary like smooth muscle, and uniquely capable of generating its own electrical signals.
The four chambers divide into two functional pumps working in parallel:
- Right side: Receives deoxygenated blood from the body and pumps it to the lungs (pulmonary circulation)
- Left side: Receives oxygenated blood from the lungs and pumps it to the body (systemic circulation)
Each side has two chambers:
Atria (singular: atrium) — the upper receiving chambers with thinner walls. They collect blood returning from veins and push it into the ventricles below.
Ventricles — the lower pumping chambers with much thicker walls. The right ventricle pushes blood to the lungs (low pressure circuit); the left ventricle pushes blood to the entire systemic circulation (high pressure circuit) and has walls roughly three times thicker than the right.
Source: Boron, W.F. & Boulpaep, E.L., Medical Physiology, 3rd edition (2017) — Comprehensive treatment of cardiac anatomy, chamber function, and pressure-volume relationships.
Four valves ensure blood flows in one direction. The atrioventricular valves (tricuspid on the right, mitral on the left) prevent backflow from ventricles into atria when the ventricles contract. The semilunar valves (pulmonary and aortic) prevent backflow from the pulmonary artery and aorta into the ventricles when they relax. Valve disease — stenosis (narrowing) or regurgitation (leakage) — disrupts this directional flow and produces the characteristic sounds audible with a stethoscope.
The Cardiac Cycle: Systole and Diastole
One complete heartbeat is called the cardiac cycle. At a resting heart rate of 70 beats per minute (bpm), each cycle lasts about 0.86 seconds. The cycle has two main phases:
Systole — contraction. The ventricular walls squeeze inward, pressure inside the ventricles rises sharply, the semilunar valves open, and blood is ejected into the aorta and pulmonary artery.
Diastole — relaxation. The ventricles relax, ventricular pressure falls, the semilunar valves close, the atrioventricular valves open, and blood flows from the atria into the ventricles, refilling them for the next beat.
The "lub-dub" sounds of the heartbeat are the sounds of these valves closing — "lub" (S1) is the AV valves closing at the start of systole; "dub" (S2) is the semilunar valves closing at the end of systole.
| Phase | Duration (at 70 bpm) | Event |
|---|---|---|
| Isovolumetric contraction | ~50 ms | Ventricles contract; all valves closed; pressure rises |
| Rapid ejection | ~200 ms | Semilunar valves open; blood ejected into arteries |
| Reduced ejection | ~130 ms | Ejection slows; semilunar valves still open |
| Isovolumetric relaxation | ~80 ms | All valves closed; ventricles relax; pressure falls |
| Rapid filling | ~150 ms | AV valves open; blood rushes in from atria |
| Reduced filling (diastasis) | ~200 ms | Slower passive filling |
| Atrial systole | ~100 ms | Atria contract; top up ventricular filling |
The heart does not eject all of the blood it contains. The ejection fraction (EF) — the percentage of ventricular volume pumped out per beat — is typically 55–70% in a healthy adult. At rest, each ventricle holds about 120–130 mL at the end of filling (end-diastolic volume) and ejects about 70 mL per beat (stroke volume). The product of stroke volume and heart rate gives cardiac output: approximately 70 mL × 70 bpm = 4,900 mL/min, or roughly 5 liters per minute at rest. During vigorous exercise, cardiac output can increase to 20–25 liters per minute in fit individuals.
Source: Guyton, A.C. & Hall, J.E., Textbook of Medical Physiology, 14th edition (2020) — Authoritative source for cardiac cycle mechanics, pressure-volume loops, ejection fraction, and cardiac output.
The Electrical Conduction System: The Heart's Pacemaker
The heart's regular, coordinated rhythm is not controlled by the nervous system — it is generated within the heart itself by specialized cells that spontaneously and rhythmically depolarize. This property is called automaticity, and it is what makes the heart unique among muscles: it can beat isolated in a dish of saline solution, without any external input.
The primary pacemaker is the sinoatrial (SA) node — a small cluster of specialized cardiac cells (roughly 1.5 cm × 0.5 cm) embedded in the wall of the right atrium near the opening of the superior vena cava. The SA node spontaneously depolarizes at 60–100 times per minute in a resting adult, faster than any other part of the conduction system, so it drives the heart rate. If the SA node fails, a secondary pacemaker in the atrioventricular (AV) node takes over at 40–60 bpm; if that fails, Purkinje fibers in the ventricles can maintain a rhythm at 20–40 bpm — fast enough to maintain consciousness, but barely.
The electrical signal from the SA node spreads across both atria through gap junctions (direct electrical connections between cells), causing the atria to contract. It then converges on the AV node, located at the junction between atria and ventricles. The AV node introduces a critical delay of roughly 100–150 milliseconds — just long enough for the atria to finish contracting and push blood into the ventricles before the ventricles themselves begin to contract. Without this delay, the atria and ventricles would contract simultaneously and blood transfer would be inefficient.
Source: Boyett, M.R. et al., Cardiovascular Research (2000) — Electrophysiology of the sinoatrial node; automaticity mechanisms, pacemaker current (If), and rate modulation.
From the AV node, the signal travels rapidly down the Bundle of His (a specialized conduction tract in the interventricular septum), splits into left and right bundle branches, and then fans out through the ventricular myocardium via the Purkinje fiber network. Purkinje fibers conduct at roughly 4 meters per second — about ten times faster than ordinary cardiac muscle — allowing the entire ventricular myocardium to be activated almost simultaneously, producing a coordinated, effective contraction rather than a peristaltic wave.
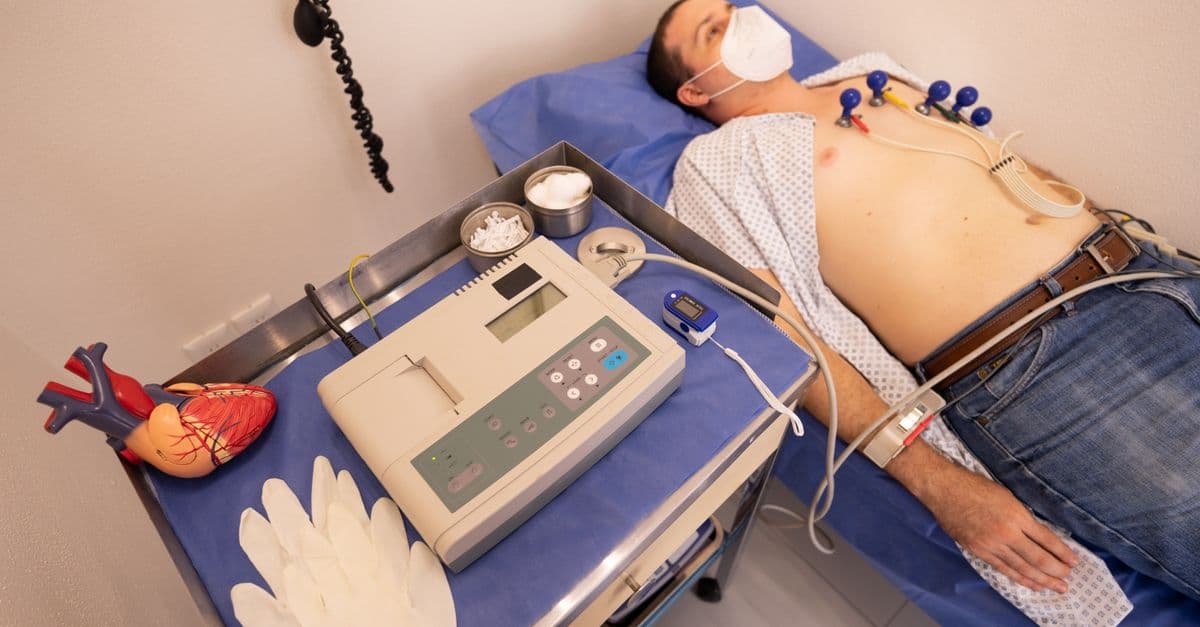
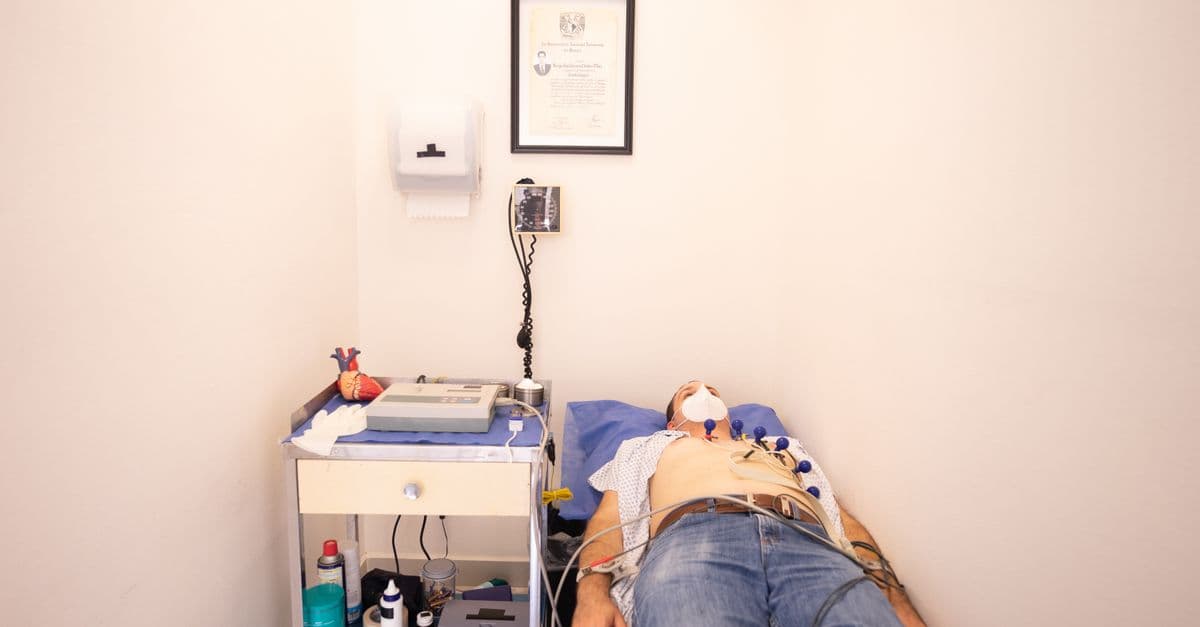
This conduction pathway is what the electrocardiogram (ECG or EKG) records from electrodes on the skin:
- P wave: atrial depolarization (SA node firing, atria contracting)
- PR interval: AV node delay
- QRS complex: ventricular depolarization (ventricles contracting)
- T wave: ventricular repolarization (ventricles relaxing)
Abnormalities in any part of this system produce characteristic ECG changes — which is why an ECG can diagnose arrhythmias, heart attacks, and conduction defects from measurements taken at the skin surface.
Coronary Circulation: The Heart That Feeds Itself
The heart muscle cannot extract oxygen from the blood flowing through its chambers — the myocardium walls are too thick. Instead, the heart has its own dedicated blood supply: the coronary circulation.
The left coronary artery (LCA) and right coronary artery (RCA) branch directly from the aorta just above the aortic valve — the first branches the aorta gives off, immediately after the heart has ejected blood into it. The left coronary artery divides into the left anterior descending (LAD) artery and the left circumflex artery. The LAD runs down the front of the heart and supplies the bulk of the left ventricular wall and interventricular septum; the circumflex supplies the lateral wall of the left ventricle. The RCA supplies the right ventricle and, in most people, the inferior wall of the left ventricle and the AV node.
Coronary artery disease — the buildup of atherosclerotic plaques (lipid-laden deposits) within the coronary arteries — is the most common cause of death in most high-income countries. When a plaque ruptures, it triggers rapid clot (thrombus) formation that can completely block the artery within minutes. The area of myocardium supplied by that artery begins to die within 20–40 minutes without blood flow: a myocardial infarction (heart attack). The LAD is sometimes called the "widowmaker" because its occlusion cuts off blood supply to a large portion of the left ventricle.
Source: Fuster, V. et al., New England Journal of Medicine (1992) — Mechanism of acute coronary syndromes; atherosclerotic plaque rupture and thrombosis as the precipitating event in myocardial infarction.
Unlike skeletal muscle, the heart cannot function under anaerobic conditions for more than a few minutes. Cardiac muscle cells extract about 70–80% of the oxygen delivered to them even at rest (compared to roughly 25% for resting skeletal muscle), which means the only way to increase oxygen delivery during exercise is to increase coronary blood flow — there is almost no oxygen extraction reserve. Coronary blood flow increases up to four-to-five-fold during peak exercise, driven by local metabolic signals (adenosine, CO₂, decreased pH) that dilate the coronary arterioles.
How Heart Rate Is Regulated
The SA node sets the intrinsic rate, but the nervous system and hormones constantly modulate it.
The autonomic nervous system has two opposing influences:
Sympathetic (fight-or-flight): releases norepinephrine onto beta-1 adrenergic receptors in the SA node and myocardium. This increases heart rate (positive chronotropy), increases the force of contraction (positive inotropy), and accelerates conduction through the AV node. Exercise, stress, and fear all activate sympathetic tone.
Parasympathetic (via the vagus nerve): releases acetylcholine onto muscarinic receptors in the SA node and AV node. This slows the SA node firing rate (negative chronotropy) and slows AV conduction. At rest, the heart operates under significant parasympathetic tone, which is why the resting heart rate (60–80 bpm) is well below the intrinsic SA node rate of around 100 bpm.
Heart rate variability (HRV) — the beat-to-beat variation in the interval between heartbeats — reflects the balance between sympathetic and parasympathetic tone. High HRV is associated with good cardiovascular health and fitness; low HRV is associated with stress, poor cardiovascular fitness, and increased cardiac risk.
Circulating epinephrine (adrenaline) from the adrenal glands has the same cardiac effects as sympathetic stimulation. Thyroid hormones also increase heart rate and myocardial contractility — hyperthyroidism causes persistent tachycardia; hypothyroidism causes bradycardia. Blood chemistry (oxygen levels, pH, temperature) also directly modulates SA node firing rate: fever accelerates it by roughly 10 bpm per degree Celsius, which is why a high temperature makes the heart race.
Source: Levy, M.N. & Martin, P.J., in Handbook of Physiology: The Cardiovascular System (1979) — Foundational account of neural control of heart rate; parasympathetic and sympathetic mechanisms and interactions.
The famous experiment that first proved chemical (rather than direct electrical) transmission in the autonomic nervous system was Otto Loewi's 1921 frog heart experiment — detailed in The Loewi Frog Heart Experiment — in which fluid from a vagally stimulated frog heart slowed a second isolated heart, demonstrating that the vagus nerve releases a chemical (acetylcholine) rather than transmitting a direct electrical signal.
Frank-Starling Mechanism: The Heart That Adjusts Itself
Beyond autonomic regulation, the heart has an intrinsic mechanism for matching output to input, without any nervous system involvement at all.
The Frank-Starling law states that the force of ventricular contraction increases as a function of the end-diastolic volume — that is, the more the ventricle is stretched by filling, the harder it contracts on the next beat, up to an optimal limit. Like a stretched elastic band that snaps back harder, more-stretched sarcomeres (the contractile units of cardiac muscle) produce more force because more actin-myosin cross-bridges are engaged at optimal overlap.
This means that if more blood returns to the heart (increased venous return) — as happens when you stand up after lying down and blood pools transiently, or when exercise drives more blood back through venous compression — the ventricle is stretched more, contracts more forcefully, and automatically increases stroke volume to match. The two sides of the heart stay in balance without any external instruction: if the right ventricle pumps a bit more, slightly more blood returns to the left ventricle, which also contracts harder.
Source: Starling, E.H., The Linacre Lecture on the Law of the Heart (1918) — Original formulation of the Frank-Starling mechanism; Starling's observations on isolated heart-lung preparations.
The Takeaway
The heart is, at its core, a pressure pump with a built-in electrical timer. The SA node generates a rhythm; the conduction system distributes it; the myocardium responds with coordinated mechanical contraction; the valves enforce directionality; and the coronary arteries supply the fuel for the whole operation. The autonomic nervous system and hormones tune the rate and force in response to moment-to-moment demand. The Frank-Starling mechanism provides a second, intrinsic layer of regulation that keeps the two pumping sides matched without any outside input. Over a lifetime of 2.5 billion beats, each one of these mechanisms runs continuously — and the failure of any part of this system, at any level, is felt immediately.
Read next:
- How the Brain Works: Neurons, Regions, and the Mind
- How the Immune System Works
- The Loewi Frog Heart Experiment
What an ECG Actually Measures — Reading the Heart's Electricity
The electrocardiogram (ECG, or EKG from the German Elektrokardiogramm) is one of medicine's most information-dense diagnostic tools, yet its output — a squiggly line traced across grid paper — is frequently treated as inscrutable by non-specialists. The trace is not arbitrary: every feature maps directly onto a specific electrical event in the cardiac conduction system, and understanding the correspondence makes the ECG legible as a real-time readout of the heart's timing machinery.
The ECG works because the human body conducts electricity. When the heart's conduction system generates its depolarization wavefront, the resulting electrical current spreads through the surrounding tissue and body fluids to the skin surface, where electrodes can detect the voltage difference between any two points. A standard 12-lead ECG places electrodes on the limbs and across the chest, recording those voltage differences from 12 different directional perspectives (leads) simultaneously. The varying waveform shape across leads reflects the changing angle between the recording electrode and the direction the depolarization wavefront is traveling — which is why a normal QRS complex looks dramatically different in lead aVR versus lead V5 even though both are recording the same underlying electrical event.
The P wave is the first deflection on a standard ECG trace. It corresponds to atrial depolarization — the spread of the electrical signal from the SA node outward across both atria, causing them to contract. The P wave is small and rounded because the atrial muscle mass is modest and the depolarization wavefront travels relatively slowly through it. A normal P wave lasts less than 120 milliseconds and has an amplitude below 2.5 mm in the limb leads. Its absence means the SA node is not the rhythm's origin; its abnormal shape can indicate atrial enlargement or abnormal conduction pathways.
Source: Thaler, M.S., The Only EKG Book You'll Ever Need, 9th edition (2019) — Standard clinical reference for ECG interpretation; waveform origins, normal values, and arrhythmia patterns.
The PR interval — measured from the start of the P wave to the start of the QRS complex — represents the time taken for the electrical signal to cross the AV node and travel down the Bundle of His to the ventricular myocardium. Normal PR interval is 120–200 milliseconds. This interval encodes the AV node's deliberate conduction delay, which ensures the atria have finished contracting and pushed blood into the ventricles before the ventricles themselves begin to contract. A prolonged PR interval (above 200 ms) indicates first-degree AV block — slowed conduction through the AV node, which can be benign or a sign of disease or drug effect.
The QRS complex is the largest deflection on the trace and corresponds to ventricular depolarization — the near-simultaneous activation of the entire ventricular myocardium through the Purkinje fiber network. Its brevity (normally less than 120 milliseconds) reflects how quickly the Purkinje system distributes the signal. A widened QRS (above 120 ms) indicates that the depolarization wavefront is traveling through ordinary myocardium rather than the fast conduction system — a bundle branch block, where one of the two bundle branches is not conducting. The QRS morphology across the 12 leads encodes the direction the depolarization wavefront is traveling through the ventricular walls, allowing inferences about ventricular geometry and damage.
The T wave follows the QRS and represents ventricular repolarization — the recovery of the ventricular myocardium to its resting electrical state, ready for the next beat. The T wave is normally in the same general direction as the QRS in most leads. An inverted T wave in leads where it is expected to be upright is one of the classic signs of myocardial ischemia — areas of the ventricular wall that are not receiving adequate blood flow repolarize abnormally, distorting the T wave's shape and direction.
The interval from the start of the QRS to the end of the T wave is the QT interval, representing the total duration of ventricular electrical activity. A prolonged QT interval indicates that ventricular myocardium is taking longer than normal to repolarize, which creates a window during which an early electrical impulse (an ectopic beat) can arrive while some cells are still partially repolarized, potentially triggering ventricular fibrillation — the chaotic, non-coordinated electrical activity that produces cardiac arrest. Long QT can be congenital or caused by certain medications and electrolyte disturbances.
Source: Goldberger, A.L. et al., Goldberger's Clinical Electrocardiography, 9th edition (2018) — Comprehensive mapping of ECG waveforms to cardiac cycle events; arrhythmia patterns, ischemia, and conduction abnormalities.
Arrhythmias manifest as systematic deviations from the normal pattern. In atrial fibrillation — the most common sustained arrhythmia — the atria are not controlled by the SA node but are firing chaotically at 350–600 times per minute from multiple ectopic foci. The P waves disappear from the ECG, replaced by a fine, irregular baseline tremor. The AV node acts as a gatekeeper, blocking most of these impulses and conducting only a fraction (irregularly) to the ventricles — which is why atrial fibrillation produces the characteristic irregularly irregular ventricular rhythm, recognizable on an ECG as QRS complexes appearing at apparently random intervals. In ventricular tachycardia, the QRS complexes are wide (because the depolarization is not traveling through the normal Purkinje system) and rapid, often above 150 bpm — a potentially dangerous rhythm because the ventricles are contracting so quickly and inefficiently that cardiac output falls. The ECG makes these distinctions visible from skin electrodes because each arrhythmia's mechanism leaves a specific electrical signature in the timing, shape, and regularity of the waveforms — a direct window into which part of the conduction system is working normally and which is not.
Q: How many times does the heart beat per day?
A: Approximately 100,000 times per day at an average resting heart rate of 70 beats per minute. Over a 75-year lifespan, the total approaches 2.5 billion beats.
Q: What is the sinoatrial node and why is it called the heart's pacemaker?
A: The sinoatrial (SA) node is a small cluster of specialized cardiac cells in the right atrium that spontaneously and rhythmically depolarize at 60–100 times per minute, faster than any other region of the heart's conduction system. Because it fires fastest, it drives the heart's rate — any slower secondary pacemaker only takes over if the SA node fails.
Q: What is an ejection fraction?
A: Ejection fraction is the percentage of blood in the ventricle that is pumped out with each beat. A normal ejection fraction is 55–70%. Values below 40% indicate significant heart failure — the ventricle is pumping less than half the blood it contains, reducing oxygen delivery to the rest of the body.
Q: Why does a heart attack happen?
A: Most heart attacks result from a rupture of an atherosclerotic plaque in a coronary artery, which triggers rapid clot formation and blocks blood flow to part of the heart muscle. Without blood supply, cardiac muscle cells begin to die within 20–40 minutes. The extent of damage depends on which artery is blocked and how quickly blood flow is restored.
Q: What is the Frank-Starling law?
A: The Frank-Starling law describes the heart's intrinsic ability to increase contractile force when more blood fills the ventricle (greater stretch). This allows the heart to automatically match its output to the amount of blood returning from the body without any nervous system input, keeping the left and right sides in balance.
Q: What does heart rate variability (HRV) measure?
A: HRV measures the variation in time between consecutive heartbeats. High HRV reflects healthy, flexible autonomic regulation — a balance of sympathetic and parasympathetic tone. Low HRV indicates dominance by sympathetic drive (stress, poor fitness) and is associated with increased cardiovascular risk.
Follow new articles
Add SciHub101 to your feed reader to see new science and technology stories.
About the Author
SciHub101 is an independent science and technology publication founded and edited by Buğra Sözeri, a software engineer and app developer based in Türkiye. AI tools assist with drafting and research. Source documentation in the existing archive is uneven, and articles are being reviewed and corrected. The Editorial Team byline identifies editorial responsibility; it does not certify specialist or independent human review. Where we compare products, anything built by our own team is labelled as such — see the editorial guidelines and About page for how corrections and disclosures work.
Related Articles
How the Immune System Works: Innate, Adaptive, and Vaccines
The immune system is not a single organ or a single type of cell — it is a distributed surveillance network that distinguishes your own tissue from foreign invaders within minutes, then builds custom molecular weapons if the first response is not enough. Here is how.
How the Brain Works: Neurons, Regions, and the Mind
The brain runs on roughly 86 billion neurons, consumes 20% of your body's energy despite weighing only 2% of your body, and rewires itself with every new experience. Here is the mechanism behind all of it.
How the Heart Works — Anatomy and Function
How the human heart pumps blood: chambers, valves, electrical conduction, cardiac cycle, and the most important diseases and treatments.

How the Human Heart Pumps Blood: A Complete Guide
Your heart beats about 100,000 times a day without a single conscious thought. Here's the remarkable engineering behind it.
How Does the Human Heart Actually Work?
Your heart beats 100,000 times a day, pumping ~5 litres of blood every minute. Here's the elegant biology of the most reliable mechanical organ in your body.

Why Do Our Ears Pop? The Science of Pressure Equalization
Every airplane climb or diving descent reminds us: the human ear is exquisitely sensitive to pressure change. The familiar pop occurs because the middle ear—a small air-filled chamber behind the eardrum—must equalize its pressure to match the ambient environment. When you yawn or swallow, the Eustachian tube opens to let air flow in or out, restoring balance. Altitude, diving, colds, and even weather shifts can create pressure mismatches that strain the tympanic membrane; when equalization finally succeeds, you feel the sudden relief of the pop.