App Store Optimization (ASO): How to Get Your App Discovered in 2026
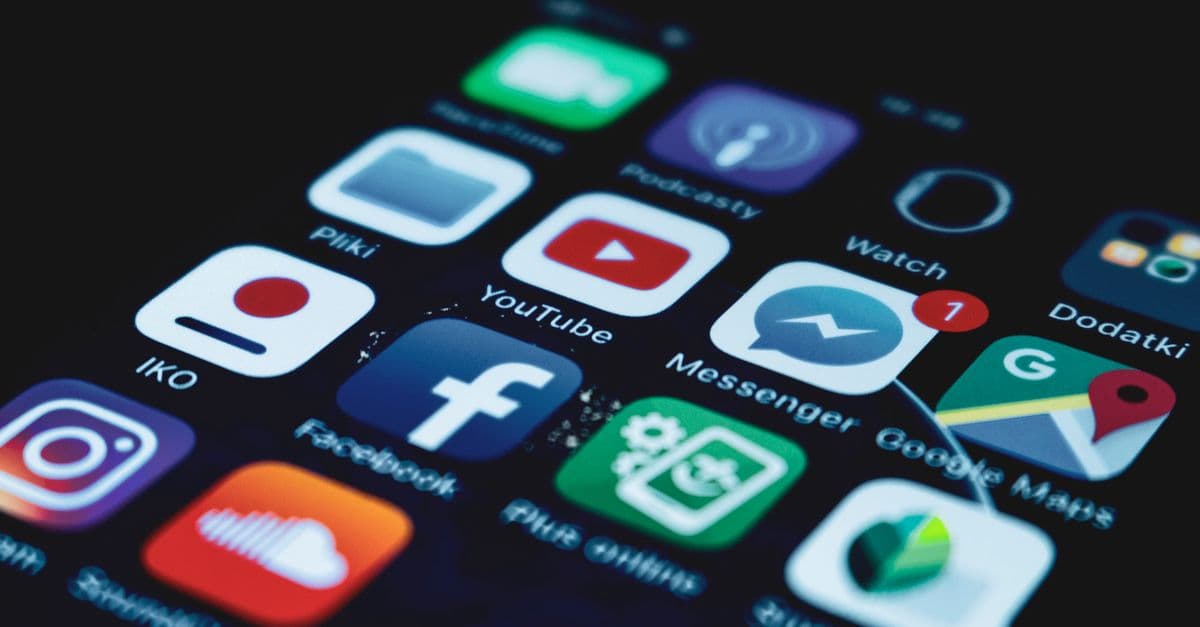
Photo: Mateusz Dach / Pexels
Every second, approximately 213,000 apps are downloaded from the App Store and Google Play combined. Yet an estimated 45 percent of apps are downloaded zero times after their launch. The difference between success and obscurity on app stores has little to do with features and everything to do with discoverability. An app buried in search results or presented with a mediocre screenshot generates no installs, no revenue, and no user feedback to iterate on. App Store Optimization—ASO—is the systematic practice of maximizing an app's visibility and appeal within app store search rankings and category pages. Unlike web search, where visibility depends on external links and domain authority, ASO is almost entirely within your control. It requires understanding how app store algorithms work, what motivates users to tap that install button, and how to measure and improve the metrics that matter.
The stakes are high because the math is brutal: a mobile app company's success is proportional to installs multiplied by retention multiplied by monetization. Remove discoverability, and the math breaks. This guide walks through the mechanics of ASO, the key differences between the App Store and Google Play, the tactics that convert search visitors into installers, and the realistic timeline for seeing results.
What Is App Store Optimization and Why It Matters
App Store Optimization is the discipline of improving how discoverable, compelling, and credible your app appears to potential users within app marketplaces. ASO encompasses keyword strategy, visual design (screenshots and app preview videos), metadata management (title, subtitle, description), ratings and reviews, and installation rate (conversion rate). Each of these signals influences both the store's ranking algorithm and the user's decision to tap install.
Algorithm visibility — the app store algorithms (App Store's search algorithm and Google Play's AI-driven ranking system) treat ASO metadata as input signals. Apps with optimized keywords rank higher in relevant search queries. Apps with high conversion rates (the percentage of searchers who install) receive algorithmic boosts. Apps with high ratings are trusted more by the algorithm and by users.
User conversion — even if your app ranks on the first search result page, a low-quality screenshot or misleading title destroys conversion. Users skim an app's title, read a 2-3 line description, glance at screenshots, check the rating, and decide in 10 seconds. ASO optimization means every pixel on those pages works to communicate value and reduce friction.
Feedback loop — ASO is not a one-time task. Every install triggers user reviews and ratings, which feed back into the algorithm. Every review reveals user frustration points. Every uninstall represents a lost opportunity to iterate. ASO creates a tight feedback loop between discovery, quality, and market fit.
The economic impact is measurable. Studies show that optimizing an app's keyword strategy can increase organic installs by 30-50 percent within 30 days. Improving screenshots can lift conversion rates by 10-25 percent on the same number of impressions. For a mid-market app receiving 100,000 monthly impressions, a 15 percent conversion lift means 15,000 additional monthly installs and (at a $2 lifetime value per install) $30,000 in incremental annual revenue—all from changing a few visuals and metadata strings.
Understanding App Store Algorithms: App Store vs. Google Play
The App Store (iOS) and Google Play (Android) use fundamentally different ranking algorithms, and this forces ASO practitioners to maintain two distinct strategies.
App Store algorithm factors:
The App Store ranks search results using a machine learning model that weighs:
Keyword relevance — the app's title, keywords field, and category must match the user's search query. Exact phrase matches carry more weight than keyword fragments.
Rating and reviews — apps with 4.5+ stars rank higher than 4.0 star apps in identical keyword positions. Volume of recent reviews also matters; stale app listings with old reviews rank lower than apps accumulating new reviews weekly.
Conversion rate — the App Store measures what percentage of searchers tap install within seconds of viewing the search result. High-conversion apps (from better screenshots or clearer positioning) receive algorithmic boosts and are shown to more users.
Category and trending — the App Store features trending apps in category listings, using signals like install velocity (installs per day) and user engagement metrics (session frequency, session length).
Developer trust — apps from developers with multiple successful apps, clean app store account history, and no trademark/policy violations are given a slight ranking boost.
Google Play algorithm factors:
Google Play uses a more transparent, multi-signal model:
Keyword metadata — short description, full description, and the recent feature of short-form tags. Google Play gives high weight to the short description because it is visible in search results below the title.
User behavior — install velocity (momentum), uninstall rate, and in-app engagement signals (derived from Google Play Services integration) inform ranking. A high uninstall rate will suppress an app's visibility even if it has many installs.
Ratings and review quality — average rating is a factor; Google Play also considers review sentiment (using NLP to detect positive vs. negative language), recency, and review volume.
Crash data and stability — apps with high crash rates or poor performance reviews are ranked below stable competitors.
Localization — apps translated into the user's language and culturally adapted for their region rank higher for users in that region.
The key difference: App Store is relatively opaque and leans heavily on conversion rate, while Google Play is more data-driven and transparent, using installation velocity and uninstall rate as dynamic ranking signals. An app that converts 3 percent of viewers on the App Store will outrank an app that converts 2 percent, even if the second app has more total installs. On Google Play, an app with 10,000 installs last week but a 40 percent uninstall rate will rank lower than an app with 5,000 installs last week and a 5 percent uninstall rate.
Keyword Research and Strategy for App Store ASO
Keyword research is the foundation of ASO because keywords determine which search queries display your app. Unlike web keyword research, which focuses on search volume and competition, app store keyword research balances three factors: search volume, keyword difficulty (competition), and relevance to your actual app.
Finding high-value keywords:
Use tools like App Annie (now Sensor Tower), Mobile Action, or AppFigures to:
Identify seed keywords — brainstorm 10-20 keywords your target user might enter when searching for apps like yours. For a meditation app, seed keywords include "meditation," "sleep," "mindfulness," "relaxation," "anxiety relief," "sleep sounds."
Check search volume — filter keywords with monthly search volume above 1,000 (App Store) or 5,000 (Google Play). Keywords with sub-1,000 volume rarely deliver meaningful installs.
Assess keyword difficulty — difficulty scores range from 1-100. Keywords with difficulty above 75 are dominated by apps with 100,000+ installs and high ratings; targeting them as a new app is futile. Target keywords with difficulty 30-60 for realistic ranking potential.
Validate relevance — avoid keyword stuffing unrelated terms into your metadata. An app optimized for "cryptocurrency wallet" but designed for "budgeting" will attract users looking for the wrong product, destroying conversion rate and ratings.
Allocating keywords to metadata fields:
App Store and Google Play provide specific keyword fields:
Title (30 chars, App Store; 50 chars, Google Play) — include your primary keyword if it fits naturally. Example: "Notion: AI Note-Taking" works for the Notion app because "note-taking" is both accurate and searchable. Avoid keyword stuffing like "Notion | AI | Notes | Task Manager | Wiki" because awkward titles hurt conversion.
Subtitle (30 chars, App Store only) — use this field for a secondary keyword and value prop. Example: "Organize Your Work."
Keywords field (100 chars, App Store; not a field in Google Play, replaced by short tags) — enter comma-separated keywords. Example: "notes, ai, productivity, knowledge management, wiki." No spaces before/after commas; prioritize highest-value keywords first because Google Play and App Store may truncate.
Short description (80 chars, Google Play) — the first line users read; include your primary keyword and primary benefit. Example: "Organize your thoughts with AI-powered note-taking."
Full description (4,000 chars, App Store; 4,000 chars, Google Play) — expand on benefits, use keywords naturally 2-3 more times, avoid keyword repetition that damages readability.
Example keyword allocation (meditation app):
| Metadata Field | Content | Keywords Included |
|---|---|---|
| Title | "Calm: Sleep & Meditation" | Calm, Sleep, Meditation |
| Subtitle | "Guided Sleep & Mindfulness" | Sleep, Mindfulness |
| Keywords | "meditation, sleep, mindfulness, relaxation, anxiety, sleep sounds, breathing, yoga" | 8 keywords |
| Short Description | "Fall asleep faster with guided meditations and sleep sounds." | Asleep, Sleep, Guided, Meditations |
| Full Description | "Calm helps millions sleep, meditate, and manage anxiety. Our library includes... [expand on features, benefits, credentials]" | Sleep, Meditate, Anxiety (plus 1-2 more uses) |
This allocation targets multiple search queries (meditation, sleep, mindfulness, anxiety, relaxation) without keyword stuffing, preserving readability and conversion.
Screenshots, Videos, and Visual Strategy
Screenshots are the highest-leverage ASO tactic because they drive conversion rate more than any other metadata element. A user sees your app's icon, reads your title in 1 second, glances at the first screenshot in 2 seconds, and decides whether to tap install. A poor first screenshot eliminates 30-50 percent of potential converters before they read your description.
Screenshot strategy (5 screenshots per iOS; 8 per Android recommended):
Screenshot 1 — Hook and value prop — text overlay (20-40 words) explaining the single biggest benefit of your app. Use a phone-shaped visual or in-app UI to establish credibility. Example (meditation app): "Fall asleep in minutes with personalized sleep stories." This is not marketing copy; it is a single clear statement of what the app does.
Screenshot 2-4 — Feature depth — each screenshot highlights one key feature and explains it in plain language. Example (meditation app): Screenshot 2: "200+ expert-guided meditations for every mood." Screenshot 3: "Personalized sleep sounds and music." Screenshot 4: "Track your progress and build streaks."
Screenshot 5 — Trust signals and CTA — ratings, user testimonial (one real quote), social proof, or free trial availability. Example: "4.8 stars from 2M+ users. Trusted by doctors and therapists." Then "Get 7 days free."
Design principles:
Contrast and text size — text must be legible on a small phone screen from 1 meter away. Use 28+ pt font for headlines, 16+ pt for body text.
Avoid clutter — each screenshot makes one point. Do not try to sell 5 features in one image; it overwhelms.
Use real app UI — screenshots showing the app's actual interface build trust more than hand-drawn mockups.
Localize visuals — if targeting Spanish-speaking countries, create Spanish-language screenshots (App Store and Google Play support multiple screenshot sets by locale).
App preview videos (15-30 seconds, App Store and Google Play):
A short looping video of your app in action converts 25-35 percent better than screenshots alone. Keep it simple: show the main user flow (open app, select a meditation, listen, rate) with background music. Subtitle key steps. Upload to both app stores.
Ratings, Reviews, and Credibility
An app with 4.8 stars and 100,000 reviews will rank higher than an app with 4.2 stars and 100,000 reviews, even if they target the same keywords. Ratings are a proxy for quality; the algorithm amplifies apps users trust.
Generating and maintaining high ratings:
Timing — ask for ratings after a positive user experience. A meditation app should ask for a rating after a user completes their first meditation, not when they first open the app. A weather app should ask after they have saved a location and viewed a forecast.
Platform-native prompts — iOS and Android provide in-app rating prompts (SKStoreReviewController on iOS; In-App Review API on Google Play) that do not interrupt the user's flow. Use these instead of custom pop-ups.
Respond to reviews — spend 15 minutes weekly responding to low ratings. A one-star review saying "Crashes on startup" should get a response: "We fixed the startup crash in version 2.1. Please update and let us know if the issue persists." This demonstrates responsiveness to the review algorithm and to potential users reading reviews.
Feature requests in reviews — read reviews for feature requests. The most-requested features reveal user pain points; building them locks in positive future reviews. A budgeting app receiving dozens of "add investment tracking" reviews should make that a roadmap priority.
Vertical slice of quality — do not chase volume. One thousand five-star reviews with a 4.8 average is preferable to five thousand three-star reviews with a 3.8 average. A low average rating is algorithmic quicksand; focus on converting enthusiasts into vocal promoters rather than appeasing casual users.
Conversion Rate Optimization: Turning Viewers into Installers
Conversion rate—the percentage of users who see your app in search results and tap install—is the single highest-leverage ASO metric. A 1 percent conversion rate is typical for an established app; 2-3 percent is strong; above 3 percent is exceptional. Improving conversion rate by 1 percentage point can double or triple monthly installs.
Conversion optimization steps:
Title clarity — your title must answer "What does this app do?" within 30 characters (iOS) or 50 (Android). Avoid clever wordplay or branding nonsense. "Expense Tracker: Budget Planner" is clearer and more optimized than "MoneyFlow."
Icon and app name cohesion — users recognize apps by icon shape and color. Changing your icon mid-campaign confuses users and suppresses conversion. The icon and title must work together; if your title is "TravelLog," your icon should visually communicate travel, not be abstract.
Screenshot narrative — the first three screenshots must tell a clear story: (1) What is this app? (2) How do you use it? (3) What will you get from it? Users should know the app's purpose without reading a single word of fine print.
Price and friction — a free app with in-app purchases converts higher than a $9.99 paid app selling identical features. This is not morality; it is friction. A "Download" button is frictionless; a "Buy" button kills conversion. If monetizing through IAP, be clear in your screenshots and description that the app is free but contains premium options.
A/B testing — the App Store and Google Play both support A/B testing of screenshots, app preview videos, and app icons. Run tests on one variable at a time (change screenshot 1, keep others constant) for 2-4 weeks each, then measure conversion rate. A 10 percent lift is meaningful and rollable.
App Store vs. Google Play: Platform-Specific Tactics
The App Store and Google Play attract different user types and have different algorithmic incentives.
App Store (iOS) specific:
iOS users convert at 2-3x higher rates than Android users on average. The App Store audience is older, more affluent, and more willing to pay or grant app permissions.
The App Store review process (1-24 hour turnaround) is rigorous; apps violating guidelines are rejected. A rejected build causes 1-7 day delays. Avoid metadata that invites review rejections (e.g., "Beat all competitors" can trigger trademark review; "Completely free forever" can trigger if your app later monetizes).
App Store users expect polished, fast apps. A 200 MB app is considered bloated; aim for sub-100 MB. Optimize for iPhone 14 / 15 performance; older devices matter less because iPhone users upgrade more frequently.
The "Today" tab (editorial curation) drives enormous visibility. Pitch your app for featuring by submitting a press release and high-quality press kit (screenshots, video, supporting marketing assets) 2-3 weeks before launch.
Google Play (Android) specific:
Android users are more price-sensitive and more likely to pirate or use ad blockers. Monetize with ads (rewarded video or banner) or freemium IAP, not premium purchases.
Google Play's review process is automated (minutes); rejections are rare. However, app policy violations (privacy, security, ads) can result in app removal.
Android devices span vast hardware ranges (budget phones to flagship tablets). Test your app on devices with 2 GB RAM and 5-year-old processors; if it crashes, you will lose millions of users in developing markets.
Google Play offers phased rollouts; release to 5-10 percent of users initially, monitor crash rates and negative reviews, then ramp to 100 percent. This reduces the damage from launch bugs.
Metrics: Measuring ASO Success
Track these metrics monthly:
Keyword rankings — for your 10 primary keywords, note which search result position your app occupies on the App Store and Google Play. Position 1 = top spot in search results. Improvements from position 15 to position 5 indicate ASO working. Tools: App Annie, Sensor Tower.
Organic install volume — the number of installs from app store search (not ads, not links, not partnerships). Compare month-over-month. A 20 percent month-over-month growth in organic installs indicates improving discoverability.
Conversion rate — (installs / impressions). The App Store reports impressions in App Analytics; Google Play reports this in Play Console. A rising conversion rate with flat or declining impressions is a good sign (your visual assets are improving).
Average rating — monitor weekly. A decline from 4.6 to 4.4 signals user dissatisfaction; identify the change that caused it (update, feature removal, bug).
Uninstall rate — the percentage of installers who uninstall within 7, 30, 90 days. High uninstall rates (above 50 percent at day 7 for a game; above 30 percent for a utility) indicate product-market fit issues, not ASO issues.
Frequently Asked Questions
Q: How long does ASO take to show results?
A: Keyword ranking changes appear within 1-2 weeks on Google Play and 2-4 weeks on the App Store. Conversion rate improvements from new screenshots are visible within days. However, meaningful install volume increases (10+ percent month-over-month) typically require 6-8 weeks of compounded optimization because the algorithm needs time to sample the new metadata and integrate it into ranking decisions.
Q: Should I keyword-stuff my title and description?
A: No. Keyword stuffing (repeating the same keyword 5+ times or listing unrelated keywords) damages conversion because titles and descriptions become unreadable. It also triggers app store policy reviews. The correct approach is one primary keyword in the title, 1-2 secondary keywords in the subtitle or first line of description, and the rest allocated naturally across the full description.
Q: Does app size affect ASO ranking?
A: Indirectly. A bloated app (500+ MB) triggers uninstalls and poor reviews from users on limited storage or older devices, which harms ratings and uninstall rates, which harms ranking. The App Store and Google Play do not directly penalize large file sizes in the algorithm, but users do.
Q: Can I use famous people's names or brands in my keywords?
A: App stores reject metadata with trademarked brands or celebrity names unless you have licensing rights. A fitness app cannot claim "Used by Serena Williams" without her endorsement. Keywords can include generic terms (e.g., "meditation app like Calm") if they are descriptive, but cannot be "Calm" plus other apps' names.
Q: How often should I update my app's metadata?
A: Update metadata quarterly at minimum. A/B test screenshots or preview videos monthly. Major description changes (reframing your value prop or target audience) are justified when you have new feature releases or user feedback revealing a better positioning. Do not change metadata just to change it; each iteration should be hypothesis-driven by data.
Q: What is the relationship between app rating and ASO ranking?
A: App rating is a strong but not dominant ranking signal. A 4.8-star app will outrank a 3.5-star app if they target identical keywords and have similar install velocity. However, a 3.5-star app with 1 million installs and high conversion rate can still rank above a 4.8-star app with 10,000 installs because the algorithm balances rating, volume, and conversion in a weighted model.
Read Next
Grow your app's user base by pairing ASO with user retention and marketing strategy:
- How to Build a Personal Brand Online in 2026 — understanding your audience and communicating consistently.
- How the Internet Actually Works — foundational context for app discovery and data transmission.
- How to Protect Your Online Privacy in 2026 — user trust and privacy policy requirements for app store approval.
Source: Sensor Tower (2024), 2024 State of Mobile Apps — comprehensive annual study on app store trends, keyword difficulty benchmarks, and conversion rate medians by category.
Source: Apple (2024), App Store Optimization Best Practices — official Apple guidelines on metadata, screenshots, and app preview videos.
Source: Google (2024), Google Play Strategy and Best Practices — official Google guidelines on keyword strategy, app policy, and developer vitals.
Source: Data.ai (2023), State of Mobile Gaming 2023 — analysis of conversion rates, user acquisition costs, and retention curves across app categories.
Source: TechCrunch (2024), "Why 45% of Apps Are Downloaded Zero Times After Launch" — industry analysis on app store saturation and discoverability crisis.
Source: Mobile Action (2023), Keyword Difficulty Benchmark Report — quantitative analysis of keyword difficulty scoring and ranking probability by difficulty tier.
Source: App Annie Essentials (2023), Conversion Rate Benchmarks by Category — conversion rate medians for 15+ app categories (games, productivity, health, finance, etc.).
Source: Reforge & Growth Collective (2024), Mobile Growth Workshop — case studies on ASO A/B tests, screenshot variations, and conversion rate lifts.
Source: Nielsen (2024), Global Mobile Consumer Survey — user behavior data on app discovery methods (search vs. browsing vs. ads vs. word-of-mouth).
Source: Adjust (2023), Mobile Measurement Best Practices — attribution modeling and how to measure organic install attribution accurately.
Source: App Radar (2024), ASO Trends Q1-Q2 2026 — real-time keyword rankings, algorithm change analysis, and emerging ASO tactics.
Source: PocketGamer.biz (2024), App Marketing Budget Allocation Study — how successful studios balance ASO, paid UA, and retention marketing spend.
Follow new articles
Add SciHub101 to your feed reader to see new science and technology stories.
About the Author
SciHub101 is an independent science and technology publication founded and edited by Buğra Sözeri, a software engineer and app developer based in Türkiye. AI tools assist with drafting and research. Source documentation in the existing archive is uneven, and articles are being reviewed and corrected. The Editorial Team byline identifies editorial responsibility; it does not certify specialist or independent human review. Where we compare products, anything built by our own team is labelled as such — see the editorial guidelines and About page for how corrections and disclosures work.
Related Articles

AWS vs Azure vs Google Cloud Platform (GCP): 2026 Comparison
Three cloud providers dominate the market: Amazon Web Services (AWS, 32% market share), Microsoft Azure (23%), and Google Cloud Platform (11%). Each offers compute, storage, databases, and networking. AWS is the broadest; Azure integrates tightly with Windows/Office; GCP excels at data analytics and machine learning. Pricing, compliance requirements, and lock-in differ. A practical guide to understanding what each platform offers, their relative strengths, and how to choose based on your workload.

How Microphones Work — From Sound Waves to Electrical Signals
A microphone is a transducer that converts pressure waves in air into electrical signals, and there are at least six fundamentally different ways to accomplish that conversion, each with trade-offs in sensitivity, ruggedness, and frequency response.
Best ASO Tools for Indie Developers 2026
Best ASO tools 2026: ASOhack for free audits, Sensor Tower for market data, AppTweak for keyword research, and AppFollow for review management compared.
How Smartphones Changed the World
In less than 20 years, smartphones transformed how billions of people communicate, navigate, shop, and think.

Countries with the Highest Internet Penetration (2025 Ranked)
Iceland, Denmark, and Norway all exceed 99% internet penetration — virtually everyone online. Meanwhile, Eritrea has just 2% penetration, and large parts of sub-Saharan Africa remain below 30%. The internet has reached 5.4 billion people but the last billion face the most stubborn barriers.
What Is 5G — and How Is It Really Different from 4G?
5G is faster, lower-latency, and more efficient than 4G. It also enables connected cars, remote surgery, and smart factories. Here's how it actually works and what's hype.