The Largest Solar Power Plants

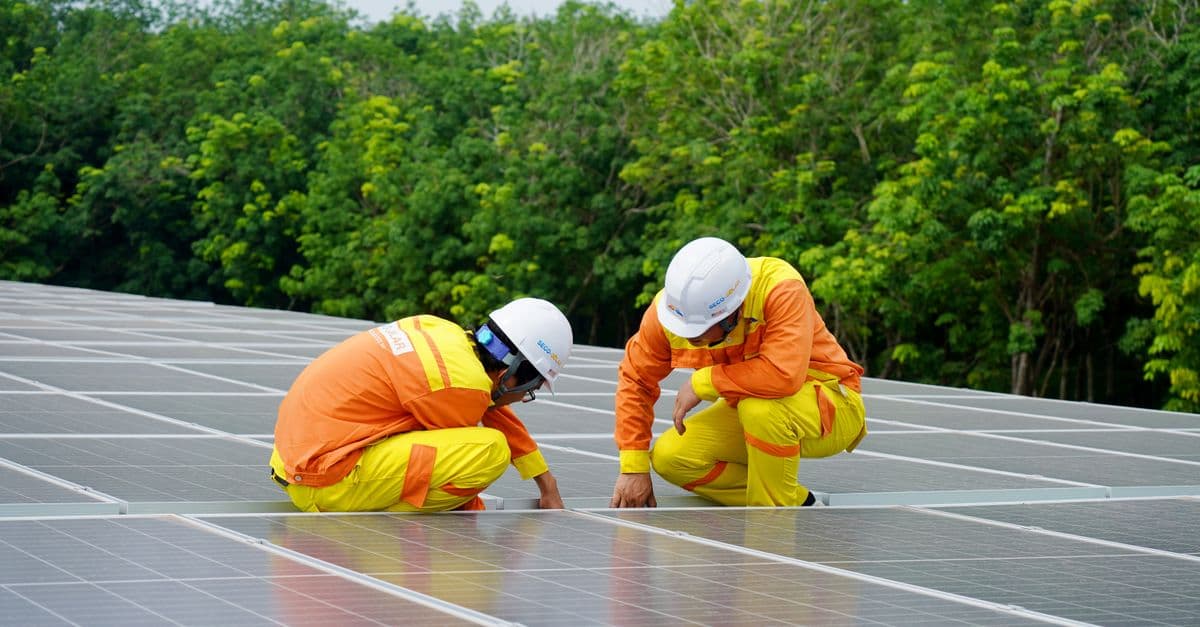
Photo: Luxinate Fynt / Pexels
The world's largest solar power plant is China's Gonghe Talatan Solar Park in Qinghai Province, with roughly 21 gigawatts (GW) of installed capacity spread across 420 square kilometers (162 square miles) of high-altitude desert. That single number is easy to state and hard to picture: 21 gigawatts is enough generating capacity, under peak sun, to match about a fifth of the United Kingdom's entire electricity demand. This guide breaks down how plants reach that scale, why China and India dominate the largest-plant rankings, what actually limits how big a solar installation can grow, and why a gigawatt of solar capacity never means a steady gigawatt of delivered power.
What counts as "largest," and why the ranking keeps changing
Utility-scale solar — a photovoltaic (PV) installation built specifically to feed electricity into the regional grid, rather than to power a single home or business — is measured primarily by two numbers: installed capacity (megawatts or gigawatts of peak generating potential) and physical footprint (hectares or square kilometers of panel-covered land). Neither number alone tells the full story, and the two don't always move together, because panel efficiency and land layout vary by site.
Gonghe Talatan's roughly 21 GW as of March 2026 makes it the largest by capacity, according to plant-level reporting from energy-industry trackers, but the title has changed hands repeatedly over the past decade (Wattlytics, 2026). Before Talatan's expansion, India's Bhadla Solar Park in Rajasthan held a widely cited "world's largest" claim at 2,245 megawatts, or about 2.25 GW, a scale that looked enormous in 2020 and now ranks well outside the global top ten (evwind/REVE News, 2024). That volatility is itself a useful fact: unlike a mountain or a canyon, a solar-capacity record is not fixed by geology, it moves every time a government approves a bigger transmission interconnection.
Two separate technologies get lumped under "solar power plant," and conflating them causes a lot of the record-chasing confusion. Photovoltaic (PV) panels convert sunlight directly into electricity using the photovoltaic effect inside silicon or thin-film cells, with no moving parts and no heat cycle involved. Concentrated solar power (CSP) instead uses mirrors or lenses to focus sunlight onto a receiver, heating a fluid that drives a conventional steam turbine, the same basic mechanism as a coal or nuclear plant, just with mirrors standing in for the furnace. Nearly every plant discussed in this article, including Gonghe Talatan and Bhadla, is PV. CSP plants like Morocco's Noor Ouarzazate complex are typically smaller in capacity but valuable for a different reason: covered in the next section.
How photovoltaic and concentrated solar actually differ
The distinction between PV and CSP matters because it explains why the "largest" list looks the way it does, and why storage strategy differs plant to plant. PV is a solid-state technology: sunlight striking a semiconductor cell knocks electrons loose, producing direct current (DC) electricity that inverters then convert to the alternating current (AC) the grid uses. Modern commercial PV modules run at roughly 20% conversion efficiency, according to comparative technology assessments, meaning about one-fifth of the solar energy hitting the panel becomes usable electricity, with the rest lost mostly as heat.
CSP, by contrast, is a thermal technology wearing a solar costume. Parabolic mirrors or heliostat fields concentrate sunlight onto a receiver filled with a heat-transfer fluid, often molten salt, which then boils water into steam to spin a turbine exactly like a fossil-fuel plant does downstream of the boiler. CSP systems run closer to 30% thermal efficiency under ideal concentration, but cost roughly twice as much per installed watt as PV, which is the central reason PV has won the scale race (SolarQuarter, 2023; EnergySage, n.d.).
CSP's one durable advantage is storage. Because it generates heat rather than electricity directly, a CSP plant can bank that heat in an insulated molten-salt tank and keep the turbine spinning for hours after sunset, something a PV panel simply cannot do on its own; PV requires a separate battery system bolted on afterward (EnergySage, n.d.). That's why CSP survives at all in a PV-dominated market: it is, in effect, solar power with several hours of built-in storage baked into the physics rather than added as a separate product.
Why almost every record-holder today is photovoltaic, not CSP
PV's per-watt cost has fallen roughly in half since 2023 as global module manufacturing scaled up, according to International Energy Agency tracking of the Chinese market, while CSP construction costs have stayed comparatively flat because it depends on precision-engineered mirrors and steam turbines rather than mass-produced silicon cells (IEA, 2024). Cheaper, simpler technology wins at gigawatt scale, which is why virtually every plant on the current largest-installations list, from Gonghe Talatan to Bhadla to Egypt's Benban complex, is PV rather than CSP.
The largest utility-scale solar installations, ranked by capacity
The table below reflects the most reliable publicly reported capacity figures available for each site; because expansions happen continuously, treat the numbers as a snapshot rather than a permanent ranking.
| Plant | Location | Approximate capacity | Notable feature |
|---|---|---|---|
| Gonghe Talatan Solar Park | Qinghai, China | ~21 GW (as of March 2026) | High-altitude desert, 420 km² footprint |
| Ningxia/Gansu desert clusters | Northwest China | Multi-gigawatt regional aggregate | Coordinated provincial buildout, part of national desert-base policy |
| Kubuqi "Great Solar Wall" (under construction) | Inner Mongolia, China | Planned ~100 GW by 2030 | 250-mile-long panel corridor across desertified land |
| Bhadla Solar Park | Rajasthan, India | ~2.25 GW | 10 million panels across roughly 5,700 hectares (14,000 acres) |
| Pavagada Solar Park | Karnataka, India | ~2.05 GW | Built on leased farmland during a multi-year drought |
| Benban Solar Park | Aswan, Egypt | ~1.8 GW | Africa's largest utility-scale PV complex |
| Noor Abu Dhabi | United Arab Emirates | ~1.18 GW | One of the lowest reported per-kWh solar tariffs at commissioning |
Gonghe Talatan alone now exceeds the combined capacity of Bhadla, Pavagada, Benban, and Noor Abu Dhabi — a measure of how quickly China's desert-base strategy has outpaced earlier record-holders.
Sources: Wattlytics (2026) on Gonghe Talatan; evwind/REVE News (2024) and Wikipedia plant infobox data cross-referenced against NASA Earthdata satellite imagery (2024) for Bhadla; IEA (2024) and Noticias Ambientales (2026) for China's Kubuqi buildout; industry trackers (SolarTechOnline, 2025) for Benban and Noor Abu Dhabi capacity figures.
Why China and India dominate the largest-plant rankings
Three factors converge to explain why nearly every gigawatt-scale plant sits in China, India, the Middle East, or North Africa, and the ranking above is not a coincidence of geography alone.
Land availability at the right price. A 21-GW installation needs hundreds of square kilometers of contiguous, low-value land that isn't competing with farming, housing, or protected ecosystems. China's Qinghai and Inner Mongolia deserts and India's Thar Desert both offer flat, high-irradiance terrain that was previously marginal for almost any other economic use, which keeps land-acquisition costs low relative to the plant's eventual power output.
Falling panel costs plus deliberate government policy. China's utility-scale PV additions more than tripled in 2023 as global module prices fell roughly 50%, and Beijing simultaneously enacted policy specifically accelerating construction of large-scale PV plants in desert regions, a combination the IEA credits directly for the desert-base boom (IEA, 2024). China added 277.57 GW of new PV capacity in 2024 alone, a 28% increase over the prior year's record, bringing national installed PV capacity to 886 GW (IEA, 2024). India followed a parallel, smaller-scale version of the same playbook: government-designated "solar parks" like Bhadla and Pavagada bundle land acquisition, transmission planning, and developer bidding into a single coordinated project rather than leaving each developer to negotiate land individually.
High and consistent solar irradiance. Desert and semi-arid latitudes receive more direct sunlight per square meter annually than temperate regions, and that irradiance is also more predictable day to day, since desert skies have less persistent cloud cover than, say, northern Europe. More reliable sun per panel means a better return on the capital sunk into hundreds of thousands of individual modules, which is the financial calculation that ultimately decides where a gigawatt-scale project gets built rather than merely proposed.
None of these three factors works alone. Cheap land without cheap panels doesn't produce record-scale plants, and cheap panels without a government-coordinated transmission plan produce scattered mid-size farms rather than a single 21-GW complex. Gonghe Talatan and the broader Kubuqi "Great Solar Wall," planned to eventually reach roughly 100 GW across a 250-mile corridor in Inner Mongolia, exist specifically because all three converged under one national industrial policy (Noticias Ambientales, 2026).
The physical engineering of building at gigawatt scale
A useful way to picture what "21 gigawatts of solar" actually requires is to compare it to something more familiar: it's roughly the peak generating capacity of ten large nuclear reactors, except spread across hundreds of thousands of individual, independently wired modules instead of concentrated in ten compact buildings. Where a nuclear reactor is one enormous, tightly engineered machine, a gigawatt-scale solar plant is closer to a coordinated swarm, millions of comparatively simple units, each producing a few hundred watts, combined through an enormous web of wiring, inverters, and transformers.
That structural difference drives the engineering challenge in a specific direction. Instead of designing one machine to survive extreme stress, engineers design a distribution and control system robust enough to aggregate millions of small, independently fluctuating power sources into one stable output the grid can absorb. Each string of panels feeds a combiner box; combiner boxes feed inverters that convert direct current (DC) to the alternating current (AC) the grid uses; inverter outputs are stepped up through transformers to transmission voltage, then carried out on high-voltage lines built specifically to move that plant's power to demand centers, sometimes hundreds of kilometers away.
That transmission link is frequently the true bottleneck, not the panels themselves. A plant capable of generating 21 GW is worthless if the nearest grid connection can only carry a fraction of that; China's desert-base strategy has therefore paired its largest solar developments with dedicated ultra-high-voltage transmission corridors built in parallel with the panel fields, a pattern also visible in India's solar-park model, where the government pre-builds substation and transmission capacity before inviting developers to bid on plots (IEA, 2024). Financing follows the same logic: lenders will not fund a multi-billion-dollar panel field without contractual certainty that the power it generates has somewhere to go.
Why gigawatt ratings never mean a gigawatt of delivered power
The single most common misunderstanding about record-setting solar plants is treating installed capacity as if it equals continuous output. A plant's gigawatt rating describes its performance under standardized peak-sun test conditions, essentially a laboratory best case, not what it produces at 9 p.m. or during a cloudy week in the monsoon season.
The metric that captures real-world output is capacity factor — the percentage of a plant's rated capacity it actually delivers on average across a full year, once night, clouds, dust accumulation, and seasonal sun-angle changes are all factored in. Utility-scale solar PV typically achieves a capacity factor in the 15% to 25% range depending on latitude and local weather, meaning a "2.25-GW" plant like Bhadla realistically delivers an average of roughly 340 to 560 megawatts across a typical year, not 2,250. That's not a flaw in the plant, it's an inherent property of a resource that only exists roughly half of every 24-hour cycle and fluctuates with weather the other half.
This gap between rated and delivered capacity is precisely why raw gigawatt figures make for compelling headlines but poor engineering planning; grid operators size backup generation, storage, and transmission capacity around expected capacity factor, not around the plant's nameplate number. It is also why solar's growing share of the grid creates a genuinely hard integration problem, covered in the next section, rather than one solved simply by building more panels.
Does a plant's gigawatt rating reflect its actual power output?
No. The gigawatt figure reflects peak capacity under standardized ideal sunlight conditions, not average delivered power. Real-world output, measured as capacity factor, typically runs 15% to 25% of that peak rating once night, cloud cover, and seasonal variation are accounted for across a full year of operation.
The grid-integration problem gigawatt-scale solar creates
Building a 21-GW plant solves a generation problem but immediately creates a delivery and stability problem, because solar output does not arrive when demand peaks and does not arrive at all for roughly half of every day. Electricity demand on most grids peaks in the early evening, right as solar generation is falling toward zero, a mismatch utilities call the "duck curve," first documented and named by California's grid operator as solar penetration rose there in the 2010s.
At gigawatt scale, that mismatch is not a minor scheduling inconvenience, it is a stability risk: a grid operator has to have enough dispatchable backup capacity, whether from batteries, hydropower, or fossil-fuel plants held in reserve, ready to ramp up within minutes as solar output falls each evening. Battery storage is increasingly the tool of choice because it can charge during the midday solar peak and discharge during the evening ramp-down, but engineering that kind of storage at a scale that matches a 21-GW solar complex is a genuinely difficult and expensive problem in its own right, involving thermal management, degradation over thousands of charge cycles, and enormous upfront capital cost, a challenge explored in depth in why grid storage is hard.
China and India have each pursued different partial solutions. China increasingly pairs new desert solar bases with dedicated ultra-high-voltage transmission lines that carry power to demand centers thousands of kilometers away, effectively using geography, moving power to a different time zone's evening peak, as a partial substitute for storage. India has leaned more heavily on requiring new solar-park developers to co-locate battery storage or hybrid wind-solar generation on-site, smoothing output before it ever reaches the transmission grid. Neither approach eliminates the underlying intermittency; both manage it at a cost that scales with plant size.
What people consistently get wrong about record-setting solar plants
Beyond the capacity-factor confusion already covered, several other misconceptions recur whenever a new "world's largest" plant makes headlines, and each one is worth correcting directly.
The first is assuming "largest" is a stable, permanent title, the way "tallest mountain" is stable. It isn't. Bhadla's 2.25-GW plant held a widely cited "world's largest" claim as recently as 2020; five years later it doesn't crack the global top ten, eclipsed by Gonghe Talatan's roughly 21 GW and by China's still-under-construction Kubuqi corridor, planned to eventually reach around 100 GW (Noticias Ambientales, 2026). Any "largest solar plant" ranking should be read as a snapshot with an implicit expiration date, not a settled fact.
The second is assuming bigger panels or exotic new cell chemistry explain the scale-up. They don't. The panels themselves have improved incrementally, module efficiency crept from roughly 15% toward 20%-plus over the past decade, but the jump from megawatt-scale plants to 21-GW complexes is almost entirely a story about land policy, transmission investment, and falling manufacturing cost per watt, not a materials-science breakthrough in the panels themselves.
The third is conflating footprint with capacity. A plant covering more land isn't automatically more powerful; panel density, module efficiency, and site layout all affect how much capacity a given hectare produces. Bhadla's roughly 5,700 hectares yield about 2.25 GW, while Gonghe Talatan's 42,000 hectares yield roughly 21 GW, a considerably higher capacity-per-hectare ratio driven by newer, more efficient panels and tighter site engineering rather than simply "more land."
The fourth misconception, related to floating installations increasingly built on reservoirs and lakes to avoid competing with farmland for space, is worth a brief mention: floating solar arrays solve the land-competition problem differently than desert megaprojects do, and the physics of building a stable platform on open water introduces its own distinct engineering challenges, covered separately in how floating solar panels work.
The takeaway
The record for the largest solar power plant has shifted from India's Bhadla Solar Park at 2.25 gigawatts to China's Gonghe Talatan complex at roughly 21 gigawatts in under five years, and China's planned Kubuqi corridor could push the record past 100 gigawatts before 2030. That trajectory isn't driven by a breakthrough in panel technology; it's driven by falling manufacturing costs, deliberate government land and transmission policy, and abundant desert irradiance converging in China and India specifically. The number that matters most for understanding any of these plants, though, isn't the gigawatt figure that makes headlines, it's the capacity factor, typically 15% to 25% of that peak rating, and the grid-storage engineering required to make an intermittent resource behave like a reliable one at gigawatt scale.
Read next:
- The Longest Suspension Bridge Spans
- The Tallest Dams Ever Built
- Why Grid Storage Is Hard
- How Floating Solar Panels Work
FAQ
Q: What is the largest solar power plant in the world?
As of 2026, China's Gonghe Talatan Solar Park in Qinghai Province holds the record at roughly 21 gigawatts of installed capacity across 420 square kilometers of high-altitude desert, according to plant-level industry tracking (Wattlytics, 2026). It surpassed earlier record-holders like India's Bhadla Solar Park, which was widely cited as the world's largest at 2.25 gigawatts as recently as 2020.
Q: Why do the largest solar plants get built in deserts?
Desert and semi-arid regions combine high, consistent solar irradiance with flat, low-value land that isn't competing with farming or dense population, which keeps land-acquisition costs low relative to a plant's eventual power output. China and India have both paired that geographic advantage with deliberate government policy accelerating desert-based solar construction and dedicated transmission investment.
Q: Does a plant's gigawatt rating reflect its actual power output?
No. The gigawatt figure reflects peak capacity under standardized ideal sunlight conditions, not average delivered power. Real-world output, called capacity factor, typically runs 15% to 25% of that peak rating once night, cloud cover, and seasonal variation are factored in across a full year.
Q: What limits how large a solar plant can be built?
Land availability, transmission-grid connection capacity, and financing are the primary constraints, not any manufacturing limit on individual panels, since gigawatt-scale plants are built from millions of standard-sized modules wired together. A plant's power is often worthless without a dedicated high-voltage transmission line built specifically to carry it to demand centers.
Q: What is the difference between photovoltaic and concentrated solar power plants?
Photovoltaic (PV) panels convert sunlight directly into electricity via the photovoltaic effect and have no moving parts, while concentrated solar power (CSP) uses mirrors to focus sunlight onto a receiver that heats fluid to drive a conventional steam turbine. PV costs roughly half as much per watt as CSP, which is why nearly every current record-holding plant, including Gonghe Talatan and Bhadla, is PV rather than CSP.
Q: How does gigawatt-scale solar affect grid stability?
Solar generation falls to zero every night and drops sharply during the early-evening demand peak, a mismatch grid operators call the "duck curve." At gigawatt scale, that requires either large battery storage systems, dedicated long-distance transmission to different demand time zones, or dispatchable backup generation ready to ramp up within minutes as solar output declines each evening.
Follow new articles
Add SciHub101 to your feed reader to see new science and technology stories.
About the Author
SciHub101 is an independent science and technology publication founded and edited by Buğra Sözeri, a software engineer and app developer based in Türkiye. AI tools assist with drafting and research. Source documentation in the existing archive is uneven, and articles are being reviewed and corrected. The Editorial Team byline identifies editorial responsibility; it does not certify specialist or independent human review. Where we compare products, anything built by our own team is labelled as such — see the editorial guidelines and About page for how corrections and disclosures work.
Related Articles


How Solar Panels Actually Work: From Photon to Grid (2026)
A deep-dive into the full physics of solar energy — the photovoltaic effect, silicon p-n junctions, Shockley-Queisser efficiency limits, perovskite tandem cells, inverters, and the real economics of solar in 2026.


The Deepest Scientific Drill Holes
The Kola Superdeep Borehole reached 12,262 m, the deepest scientific drill hole. See how deep crust drilling works, what it found, and why it stopped.