ETFs Explained — Index Funds Made Simple
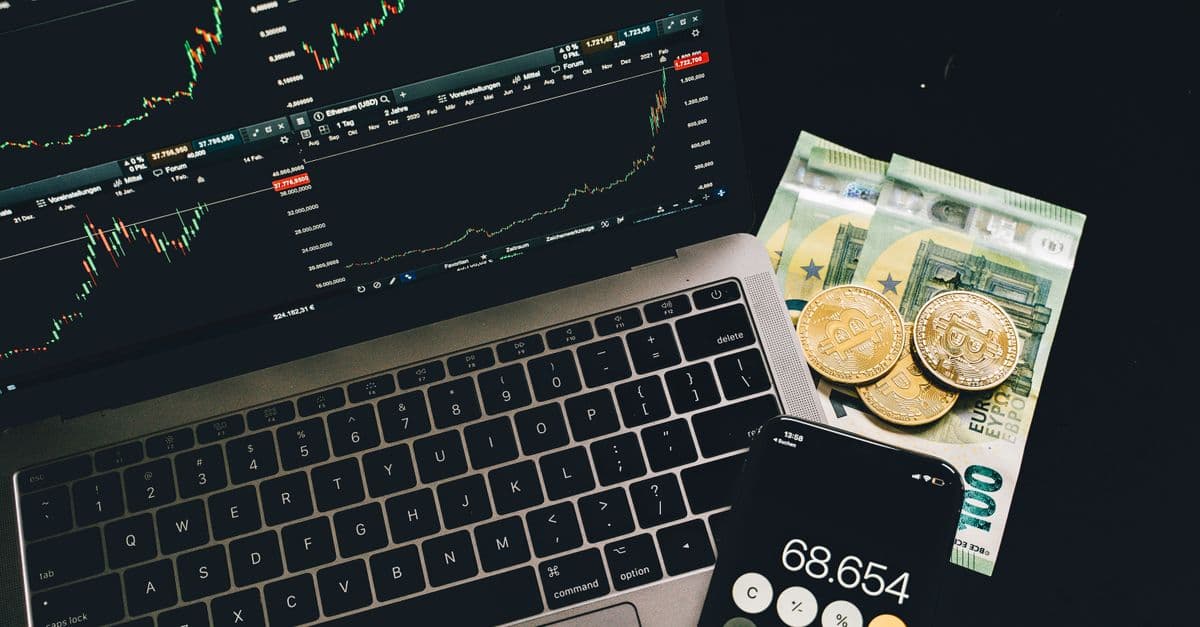
Photo: Marta Branco / Pexels
An exchange-traded fund (ETF) is a pooled investment whose shares you buy and sell on a stock exchange, minute by minute, just like shares of a single company. One share of an S&P 500 ETF represents a sliver of roughly 500 large US companies at once. According to the Investment Company Institute (ICI), US ETFs held $13.4 trillion across 4,495 funds at the end of 2025. The first US ETF launched only in 1993, so it is worth understanding what is inside the wrapper, how the price stays honest, and where the costs hide.
Educational only, not financial advice. Investing involves risk of loss; past performance does not guarantee future results. Consult a licensed financial advisor before making investment decisions.
This article covers how ETFs are built, why a mechanism run by large trading firms keeps their prices close to the value of what they hold, how fees compound over decades, why taxes often differ from mutual funds, and which structures (leveraged, inverse, and thinly traded funds) behave very differently from the plain index ETF most people picture.
What an ETF actually is
Think of an ETF as a sealed grocery basket with a ticker symbol stamped on the lid. The basket contains shares of many companies, or bonds, or sometimes commodities, and its recipe is published. You do not buy the groceries one at a time; you buy a fraction of the whole basket, and you can resell that fraction whenever the exchange is open.
The ICI defines an ETF as "a pooled investment vehicle with shares that investors can buy and sell throughout the day on a stock exchange at a market-determined price." Most ETFs are organized as open-end investment companies, the same legal form as mutual funds, or as unit investment trusts, and they are governed by the same federal rules. A smaller group, mostly funds holding commodities, currencies, or futures, uses different structures and faces different regulation (ICI 2026 Fact Book, chapter 4).
The word "index" is where people get tangled. An index is just a published list of securities with rules for weighting them, such as the S&P 500, which weights companies by their market value. An index fund tries to hold the same list in the same proportions. An index ETF is an index fund that happens to trade on an exchange. Not every ETF is an index fund, but most of the money sits in ones that are: ICI reports that actively managed ETFs registered under the Investment Company Act of 1940 held 11.1% of ETF assets at year-end 2025, and funds outside that act another 3.4%.
If you want a deeper walk through the tracking side of this, see our explainer on how index funds track markets.
Where ETFs came from: from 1976 to a ticker called SPY
The idea behind index investing predates the ETF by almost two decades. In 1976, Vanguard launched the First Index Investment Trust, now the Vanguard 500 Index Fund, for individual investors. Vanguard's own history notes that industry insiders called the move "un-American" and a "sure path to mediocrity." John C. Bogle, the firm's founder, argued that if most professional managers could not reliably beat the market after costs, ordinary savers should simply own the market cheaply (Vanguard corporate history).
The first US ETF followed on January 22, 1993: the SPDR S&P 500 ETF Trust, ticker SPY, which began trading that day according to its issuer State Street Global Advisors. It was organized as a unit investment trust, a fixed-basket legal structure that differs from the open-end form most newer ETFs use (State Street SPY page). According to Wikipedia, the SPDR was designed and developed by Nathan Most and Steven Bloom.
The product took years to spread. The ICI's year-end series shows only 80 US ETFs holding $66 billion in 2000. Bond ETFs did not appear until 2002, commodity ETFs until 2004, and hybrid ETFs until 2007. In September 2019, the SEC adopted Rule 6c-11, which lets qualifying open-end ETFs launch under one standard rule instead of seeking individual exemptive orders, lowering the legal cost of launching a new fund (SEC press release 2019-190).
How the creation and redemption loop keeps the price honest
Here is the puzzle. A mutual fund sells and redeems shares at its net asset value (NAV), the per-share value of everything it holds, calculated once a day. An ETF's shares trade between investors all day at whatever price buyers and sellers agree on. What stops that price from drifting far above or below the value of the basket?
The answer is a group of large trading firms called authorized participants (APs), who deal directly with the fund issuer. When an ETF's market price rises above the value of its holdings, an AP can buy the underlying securities, deliver them to the issuer, and receive newly created ETF shares, which it sells at the higher price for a small profit. That extra supply pushes the ETF's price back down. When the ETF trades below the value of its holdings, the AP does the reverse: it buys cheap ETF shares, hands them to the issuer, and receives the underlying securities, which it sells for more than it paid.
Picture a thermostat. The room (the ETF's price) drifts warm or cold, and a sensor (the AP's arbitrage profit) switches the heating or cooling on until the temperature returns to the setting (the NAV). Nobody has to be altruistic; the profit motive does the work, and the gap rarely lasts long for large, liquid funds.
In-kind exchange, and why it matters
Creations and redemptions usually happen "in kind," meaning securities change hands rather than cash. The ETF does not have to sell stock to meet a redemption, so it does not generate a taxable sale inside the fund. Rule 6c-11 also lets an ETF use "custom baskets" that are not an exact slice of the portfolio, provided it adopts written policies covering how those baskets are built and accepted (SEC press release 2019-190).
Most trading never touches the fund
Ordinary investors do not use this loop. ICI data show that in 2025, on average 88% of all activity in ETFs took place in the secondary market, meaning investors trading shares among themselves, rather than in creations and redemptions. Those trades do not change the fund's underlying holdings. Domestic equity ETFs had $8.3 trillion of primary market activity in 2025, equal to only 5.6% of the $148.1 trillion of company stock traded that year.
ETFs have also become a big part of daily market volume. ICI reports they averaged 28% of US stock trading volume in 2025, and reached 43% on December 24, 2018, when the S&P 500 neared bear market territory. In stress, investors lean on ETFs to move risk quickly, which is also when their prices can stray furthest from NAV.
ETFs by the numbers
The table below uses ICI year-end figures for the US ETF industry. Total net assets are in billions of US dollars.
| Year-end | Number of US ETFs | Total net assets (USD billions) |
|---|---|---|
| 2000 | 80 | 66 |
| 2005 | 204 | 301 |
| 2010 | 923 | 992 |
| 2015 | 1,597 | 2,101 |
| 2020 | 2,203 | 5,449 |
| 2024 | 3,641 | 10,305 |
| 2025 | 4,495 | 13,373 |
Source: Investment Company Institute, 2026 Investment Company Fact Book, Figure 4.1.
A few other figures from the same chapter put the growth in context. The US industry accounted for 70% of the $19.2 trillion in ETF net assets worldwide at year-end 2025. Large-cap domestic equity ETFs held $5.0 trillion (38%) of US ETF assets, and bond ETFs $2.2 trillion (17%). Net share issuance reached a record $1.5 trillion in 2025.
Sponsors launched 1,099 new ETFs in 2025 and liquidated or merged 224. Over the past decade, 4,576 ETFs launched and 1,425 closed. That last number is worth remembering: a fund can exist and still fail to attract enough assets to survive.
What happens when you click "buy"
When you place an order for an ETF through a brokerage account, you are almost never dealing with the fund company. Your broker routes the order to an exchange or another trading venue, where it meets someone selling: another investor, or a market maker, a firm that continuously quotes both a buying and a selling price for the fund. The fund itself does not receive your money, and its holdings do not change. This is the "secondary market" in the ICI's language, and it is where 88% of ETF activity took place in 2025.
The two prices a market maker quotes are the bid (what it will pay) and the ask (what it will sell for). The gap between them is the bid-ask spread, and it is the main trading cost for a fund you plan to hold, alongside any commission your broker charges. For a very large, heavily traded fund the spread can be tiny. For a small niche fund it can be wide enough to matter, and FINRA lists wide spreads among the key risks of exchange-traded products.
Market makers can quote tight prices partly because the creation and redemption loop gives them a way to manage their own inventory. If investors pile into a fund, a market maker who sold shares can ask an authorized participant to create more, rather than being stuck short. That backstop is invisible to most buyers, yet it is part of why a large ETF often trades as smoothly as a big-company stock even when the thousands of securities inside it do not.
Who is buying
ETFs have spread from institutional trading desks to ordinary portfolios. ICI reports that in 2024 full-service brokers and fee-based advisers had 35% and 49%, respectively, of their clients' household assets invested in ETFs, up from 10% and 17% in 2014. The report links this to the growing use of model portfolios, ready-made allocations that an adviser applies to many clients at once. In other words, a lot of ETF demand comes from professionals building portfolios, not just from self-directed buyers.
ETF vs mutual fund vs individual stocks
All three can be held in the same brokerage account, but they differ in mechanics. The table sets out the standard differences. ETFs and mutual funds are both pooled; an individual stock is a single company.
| Feature | ETF | Mutual fund | Individual stock |
|---|---|---|---|
| When it trades | Throughout the trading day at market prices | Once a day at NAV | Throughout the trading day |
| How price is set | Supply and demand, anchored to NAV by arbitrage | Calculated NAV after close | Supply and demand |
| Ongoing fee | Expense ratio | Expense ratio, sometimes plus sales loads | None (commissions may apply) |
| Trading costs | Bid-ask spread, possible commissions | Usually none to buy no-load funds | Bid-ask spread, possible commissions |
| Diversification | Built in, depends on the fund's index | Built in, depends on the fund | None unless you buy many |
| Capital gains passed to holders | Often low for index ETFs | Can be larger when the fund sells holdings | Only when you sell |
| Settlement | T+1 | Varies by fund | T+1 |
The settlement row deserves a note. In the US, the standard settlement cycle for most securities trades moved from two business days (T+2) to one (T+1), with a compliance date of May 28, 2024, under rules the SEC adopted on February 15, 2023 (SEC press release 2023-29).
FINRA, the securities industry's self-regulator, puts the cost distinction this way: ETPs carry expense ratios but no loads or 12b-1 fees, while brokerage commissions and bid-ask spreads also apply (FINRA). For a head-to-head treatment of the two wrappers, see our piece on how ETFs differ from mutual funds.
Some employer retirement plans offer only mutual funds. In that case the relevant comparison is not ETF versus mutual fund but one mutual fund's expense ratio against another's, which is where the next section matters most.
Why fees decide more than most people expect
The expense ratio is the fund's annual cost as a percentage of assets. You never receive a bill. The fee is deducted from the fund's assets continuously, so it shows up as slightly lower returns.
Because fees come off every year and the savings that would have grown are gone, the damage compounds, the same way compound interest works in your favor on the way up. The table below is a simplified illustration: $10,000 invested for 30 years at a constant 7% gross annual return, reduced each year by the stated fee, with no taxes or trading costs. Real returns are not constant, so treat the figures as arithmetic, not a forecast.
| Annual fee | Net annual return | Value after 30 years (approx.) | Shortfall vs 0.05% fee |
|---|---|---|---|
| 0.05% | 6.95% | $75,100 | n/a |
| 0.14% | 6.86% | $73,200 | about 3% less |
| 0.40% | 6.60% | $68,000 | about 9% less |
| 1.00% | 6.00% | $57,400 | about 24% less |
The two ends matter. A 1% fee, which is not unusual for a costly actively managed fund, leaves the saver with roughly a quarter less money than a 0.05% fund after 30 years in this example, even though both funds earned the same gross return. The money did not vanish into a market loss; it went to the fund company.
What funds actually charge
The ICI measures average expense ratios in two ways, and the difference tells a story. A simple average counts every fund equally, while an asset-weighted average reflects what shareholders actually paid, because investors have concentrated their money in cheaper funds.
| Fund type (2025) | Simple average | Asset-weighted average |
|---|---|---|
| Equity mutual funds, all | 1.09% | 0.40% |
| Actively managed equity mutual funds | n/a | 0.64% |
| Index equity mutual funds | n/a | 0.05% |
| Index equity ETFs | 0.45% | 0.14% |
| Index bond ETFs | n/a | 0.09% |
| Actively managed equity ETFs | n/a | 0.44% |
Source: ICI 2026 Fact Book, chapter 6 (Figures 6.1, 6.4, and 6.5 and accompanying text). "n/a" means the figure is not given in the sources cited.
Two things stand out. First, average costs have dropped sharply: ICI reports that the asset-weighted expense ratio of equity mutual funds fell from 0.99% in 2000 to 0.40% in 2025, a 60% decline, which it attributes in part to competition from index funds and ETFs. Second, the index share of the market has grown fast. The share of all long-term mutual fund and ETF assets held in index funds rose from 19% at year-end 2010 to 52% at year-end 2025.
The gap between the simple average (0.45%) and the asset-weighted average (0.14%) for index equity ETFs is a reminder that plenty of expensive, niche funds exist; most investors just do not hold them. ICI found that 97% of ETF-owning households said fees and expenses were important to their investment decision.
Inflation makes the same point from the other direction. If prices are rising 3% a year, a fund returning 7% before fees is delivering far less real purchasing power, and each percentage point of fee takes a larger bite of what remains. Our article on how inflation erodes purchasing power covers the mechanics.
Index, active, and everything between
Most conversations about ETFs assume the fund tracks a broad index. The product range is wider than that, and the labels can mislead.
- Broad-market index ETFs track a wide index such as the S&P 500 or a total US stock market index. They are the cheapest and most diversified.
- Sector and thematic ETFs hold narrower slices such as energy, healthcare, or a theme like cybersecurity. They are still index funds in form, but diversification is limited by design.
- Bond ETFs hold portfolios of government, corporate, or other debt. ICI reports bond ETFs held $2.2 trillion at year-end 2025.
- Actively managed ETFs let a manager choose holdings rather than copy an index. They typically charge more; ICI's asset-weighted average for active equity ETFs was 0.44% in 2025, roughly three times the 0.14% for index equity ETFs.
- Commodity, currency, and futures ETFs often use different legal structures from stock and bond ETFs, with different regulatory treatment and tax rules.
- Leveraged and inverse ETFs seek a multiple, or the opposite, of an index's daily return. They are covered separately below because they behave so differently.
A related product often confused with ETFs is the exchange-traded note (ETN). FINRA notes that ETNs carry issuer credit risk: if the issuer defaults, you may lose some or all of your investment, whereas an ETF holds actual assets in a fund (FINRA). The words "exchange-traded" appear in both names, but the structures differ.
Mutual funds can also turn into ETFs. ICI counts 191 mutual funds, with $113 billion in net assets at the time of conversion, that converted to ETFs from 2021 through 2025, which was 2.4% of ETF net issuance over the period.
Reading a fund before you buy: examples and what to check
The table lists a few widely held US ETFs as reference examples of how different structures look on paper. It is not a recommendation. Figures come from each issuer's page or the sources cited, and they change.
| Ticker | What it tracks | Expense ratio | Notes |
|---|---|---|---|
| SPY | S&P 500 | 0.0945% (gross) | First US ETF, launched January 22, 1993, unit investment trust. About $810 billion in assets on October 16, 2026 |
| IVV | S&P 500 | 0.03% | iShares Core S&P 500 ETF, launched May 15, 2000; 504 holdings on October 16, 2026 |
| QQQ | Nasdaq-100 | 0.18% | Launched March 10, 1999; moved from a unit investment trust to an open-end ETF structure in December 2025 |
Sources: State Street, iShares, Invesco, and Wikipedia's Invesco QQQ entry for the structure change.
Note what the table shows. Three funds with almost the same US large-company exposure (SPY and IVV track the same index) differ by several basis points in annual cost. A basis point is one hundredth of a percentage point, so the gap between 0.0945% and 0.03% is about 6.5 basis points. That is small in a single year and not zero over decades, but it is trivial next to the difference between an index fund and a 1% active fund.
What "market-cap weighted" means for your exposure
Most broad index ETFs weight each company by its market capitalization, the total value of its shares. A company worth ten times another gets roughly ten times the weight. The effect is that a fund holding 500 companies does not put 0.2% into each. The largest firms carry far more influence than the smallest, so the index's returns depend heavily on how its biggest members do.
This is not a flaw. It follows from the logic that the index mirrors what the market itself says companies are worth, and it keeps trading inside the fund low, since prices moving automatically adjusts weights. But it means "500 companies" overstates diversification when a handful of giants dominate. Equal-weighted and other rule-based index funds exist, and they put more weight on smaller names. Their expense ratios and internal trading costs can differ from a standard market-cap fund, so check each fund's documents rather than assuming either direction.
A short checklist of fund facts
Before anything else, the fund's own documents tell you what it will do. These are the items worth reading:
- The index and its rules. Does it cover the whole market, or a sector? How does it weight companies? A market-value-weighted index leans more heavily on its largest names.
- The expense ratio, and whether it is net of waivers. Gross and net figures can differ, as SPY's "gross" label hints.
- Tracking error. FINRA defines this as the deviation of the fund's returns from its underlying benchmark. A well-run index fund should track closely, with the gap mostly explained by its fee.
- Liquidity and the bid-ask spread. FINRA warns that some ETPs may have wide bid-ask spreads or trade at a large premium or discount to value. The spread is the difference between the highest price buyers offer and the lowest price sellers accept, and it is a real cost every time you trade.
- Assets and age. Very small funds are more likely to close. ICI's liquidation count shows this happens regularly.
The premium and discount, in plain terms
During normal trading, a large equity ETF's price sits within a small distance of its NAV. In turbulent markets, or for funds holding assets that trade infrequently, the gap can widen. The reason is simple: if the AP cannot easily price or trade the underlying securities, the arbitrage loop slows. A bond ETF during a bond-market panic is the classic case, because the ETF can trade continuously while individual bonds may not.
Taxes: why ETFs often distribute less
Capital gains tax is where the in-kind mechanism earns its keep. In the US, the IRS treats a gain on an asset held more than one year as long-term, and gains on assets held a year or less as short-term and taxed as ordinary income. For 2025, the long-term rates are 0%, 15%, or 20%, depending on taxable income (IRS Topic 409).
A mutual fund that must raise cash to pay departing shareholders may sell holdings at a profit, and the resulting gains are passed to everyone who still owns the fund, including people who sold nothing. This is how an investor can receive a taxable distribution in a year when the fund's price fell. An ETF that meets redemptions by delivering securities in kind avoids that forced sale, so many index ETFs distribute little or no capital gains. Wikipedia's ETF entry summarizes the result: ETF investors generally realize capital gains tax mainly when they sell their own shares at a gain.
Three caveats keep this honest:
- It is a tendency, not a guarantee. Funds that hold derivatives, trade actively, or use unusual structures can still distribute gains, and some ETF types (such as many commodity funds) are taxed under different rules.
- It matters most in taxable accounts. Inside an IRA or 401(k), capital gains distributions are not taxed currently, so the difference largely disappears. Our guide to Roth IRA versus 401(k) explains how those accounts treat taxes.
- Dividends are still taxable. An ETF that holds dividend-paying stocks passes the dividends through, and they are taxed in the year they are paid in a taxable account.
Tax rules change and depend on personal circumstances, so the specific treatment of any fund is a question for a tax professional.
Leveraged and inverse ETFs: the arithmetic of decay
Leveraged ETFs promise a multiple, such as two or three times, of an index's return, usually over a single day. Inverse ETFs promise the opposite. FINRA's guidance on leveraged and inverse exchange-traded products is blunt: their returns "can differ significantly from the performance" of the underlying index or benchmark over the same period, "which can make these products risky long-term—or even medium-term—investments, especially in volatile markets" (FINRA).
The reason is compounding. Each day the fund resets to its multiple, so the next day's gain or loss applies to a changed base. A simple example shows the problem.
| Day | Index move | Index level | 3x fund move | 3x fund level |
|---|---|---|---|---|
| Start | n/a | 100.00 | n/a | 100.00 |
| Day 1 | +10% | 110.00 | +30% | 130.00 |
| Day 2 | -10% | 99.00 | -30% | 91.00 |
The index ends down 1%. The 3x fund ends down 9%, not 3%. Neither day was unusual in direction; the loss comes from the sequence. A long, steady uptrend can do the opposite and deliver more than three times the index's total return. The point is that the outcome depends on the path, not just where the index ends up, which is why choppy markets are punishing.
Think of it as a cyclist who recalculates the effort target at every corner rather than for the whole route. The destination matters less than how many corners there are.
The SEC's description of Rule 6c-11 also says leveraged and inverse ETFs cannot rely on it, which is one more sign that regulators treat them as a separate category. Costs, holdings, and the use of derivatives vary from fund to fund, so each fund's prospectus is the place to check. If you want to understand the related idea of borrowing to amplify returns, see our explainer on margin trading and leverage.
Common traps with ETFs
ETFs are a wrapper, and the wrapper does not fix a bad choice of contents. These problems come up repeatedly.
Confusing "ETF" with "diversified." A fund holding 30 companies in one industry is an ETF. An ETF holding the whole market is also an ETF. The label tells you how it trades, not how it is built. A fund's holdings page tells you how diversified it is, and our article on why diversification reduces risk explains what to look for.
Trading too often because trading is easy. Intraday trading makes it simple to react to headlines. Each trade pays the spread, and behavior often hurts returns more than fees do. The research on loss aversion, summarized in our piece on why losses feel stronger than gains, helps explain why investors sell at the worst moments.
Chasing a theme after it has run. New funds tend to appear when a theme is already in the headlines, which means a buyer may be paying for a story that prices have already absorbed. ICI's data show 1,099 launches in 2025 against 224 closures, and closures come from funds that did not attract enough assets.
Ignoring the bid-ask spread on thinly traded funds. A fund with low volume can have a wide spread. If you plan to hold for many years, the spread matters less; if you trade frequently, it matters a lot. Limit orders, which set the maximum price you will pay or minimum you will accept, are a common way to control the cost.
Overlooking overlap. Owning an S&P 500 fund, a large-cap growth fund, and a technology fund may feel like three separate bets, but the same handful of companies appears in all three.
Assuming an index ETF cannot lose money. An index fund exactly tracks its market, including the bad years. The ICI series show total ETF assets falling from $7.2 trillion at the end of 2021 to $6.5 trillion at the end of 2022, even as the fund count rose. Net share issuance was still positive that year ($609 billion), so falling market prices, not investors leaving, caused the drop.
A note on starting small
ETF shares are priced individually, and many brokerages now offer fractional shares, so you can often invest a small dollar amount rather than the price of a full share. Policies vary by broker, so check yours. Investing a fixed amount on a schedule is a separate approach with its own trade-offs, discussed in our explainer on dollar-cost averaging.
What ETFs do not do
A few misconceptions are worth clearing out, because they lead to disappointment.
ETFs do not beat the market on their own. An index ETF is designed to match its index, minus costs. If the index falls 20%, the fund falls about 20%.
Low fees are not a prediction. A cheap fund can still hold expensive stocks. Fees are the part of the equation you can observe in advance; returns are not.
Index funds are not "the market." The S&P 500 covers about 500 large US companies, not every listed company, and not bonds, real estate, or international stocks. Our overview of how the stock market works shows how these pieces fit together.
Rebalancing is still your job. If stocks rise faster than bonds in your holdings, your portfolio drifts toward more risk than you planned. Our guide to portfolio rebalancing explains the options. Bond ETFs behave differently from stock ETFs when interest rates move, a topic covered in understanding bonds and fixed income.
FAQs
Q: Are ETFs safe? A: ETFs carry market risk like any investment in stocks or bonds, so their value can fall. FINRA notes that ETPs "can increase or decrease in price" like any stock. The wrapper itself is regulated, but risks come from what the fund holds, how concentrated it is, and whether it uses leverage.
Q: What is the difference between an ETF and an index fund? A: An index fund is any fund that tries to match an index. It can be a mutual fund or an ETF. An ETF is any fund whose shares trade on an exchange, and it can follow an index or be actively managed. Many popular products are both: index ETFs.
Q: How much money do I need to buy an ETF? A: At minimum, the price of one share, or less where a broker offers fractional shares. Share prices vary widely by fund, and brokers set their own rules on fractional shares and commissions.
Q: Do ETFs pay dividends? A: Yes, when the underlying holdings pay dividends or interest, the fund passes the income through as distributions, typically on a set schedule. In a taxable account those distributions are generally taxable in the year received. Many brokerages allow automatic reinvestment.
Q: Why does my ETF's price differ slightly from its NAV? A: The ETF's price is set by buyers and sellers during the day, while NAV is a calculation of the holdings' value. Authorized participants trade to keep the two close, but small gaps are normal and can widen when the underlying market is stressed or hard to trade.
Q: Why are leveraged ETFs considered risky to hold? A: They reset their leverage daily, so over longer periods their return can differ sharply from the multiple of the index's return. In a volatile market, a fund can lose value even when the index ends nearly flat. FINRA describes them as risky long-term or even medium-term investments.
Q: Can an ETF close? A: Yes. Sponsors liquidate or merge funds that fail to attract enough assets. ICI counted 224 ETF liquidations and mergers in 2025. A closing fund generally returns shareholders' money based on the value of its holdings, and in a taxable account that payout can create a taxable gain or loss, so check the fund's closure notice.
The takeaway
An ETF is a delivery system. The contents, the cost, and the way you use it determine what happens to your money. The arbitrage loop run by authorized participants is a clever piece of market plumbing that keeps the price near the value of the basket, and the in-kind mechanism often keeps taxes lower than a comparable mutual fund. Neither feature protects you from market losses or from a poor choice of fund.
The cleanest lesson in the data is about costs. ICI figures show that the average equity mutual fund investor paid 0.40% in 2025, versus 0.14% for the average index equity ETF holder, and the compounding table above shows what a gap of that size does across 30 years. Fees are one of the few variables an investor can see and compare before committing a dollar. Everything else, including returns, is uncertain.
Sources
- Investment Company Institute, 2026 Investment Company Fact Book, Chapter 4: US Exchange-Traded Funds
- Investment Company Institute, 2026 Investment Company Fact Book, Chapter 6: US Fund Expenses and Fees
- U.S. Securities and Exchange Commission, ETF rule adoption, press release 2019-190
- U.S. Securities and Exchange Commission, T+1 settlement, press release 2023-29
- FINRA, Exchange-Traded Funds and Products
- Internal Revenue Service, Topic No. 409, Capital Gains and Losses
- Vanguard, Corporate history
- State Street Investment Management, SPDR S&P 500 ETF Trust (SPY)
- BlackRock, iShares Core S&P 500 ETF (IVV)
- Invesco, QQQ ETF
- Wikipedia, Exchange-traded fund and Invesco QQQ
Follow new articles
Add SciHub101 to your feed reader to see new science and technology stories.
About the Author
SciHub101 is an independent science and technology publication founded and edited by Buğra Sözeri, a software engineer and app developer based in Türkiye. AI tools assist with drafting and research. Source documentation in the existing archive is uneven, and articles are being reviewed and corrected. The Editorial Team byline identifies editorial responsibility; it does not certify specialist or independent human review. Where we compare products, anything built by our own team is labelled as such — see the editorial guidelines and About page for how corrections and disclosures work.
Related Articles
How Central Banks Work — Monetary Policy Explained
How central banks work: the Fed, ECB, Bank of England, and Bank of Japan set interest rates, run QE and QT, and why independence matters, with sources.

Compound Interest Explained — The 8th Wonder
How compound interest works, the Rule of 72, simple vs compound math, and why starting early beats investing more later.
Index Funds vs Active Funds — Which Wins?
Index funds vs active funds: S&P SPIVA data on 20-year results, fee gaps, the Sharpe arithmetic, and where active management can still make sense.
Portfolio Rebalancing — When and How to Rebalance
Rebalancing keeps your portfolio at its target risk. How often to rebalance, threshold vs. calendar methods, tax tricks, and what the research says.
What Is FIRE? Financial Independence Retire Early
What is the FIRE movement? Financial Independence Retire Early explained — 4% rule, savings rates, leanFIRE vs fatFIRE, math, and criticisms.
Dollar-Cost Averaging Explained — Pros and Cons
Dollar-cost averaging (DCA) explained: how it works, when it beats lump-sum investing, the Vanguard research, and the behavioral reasons it still wins.