Countries with the Best Public Transport (2025 Ranked)
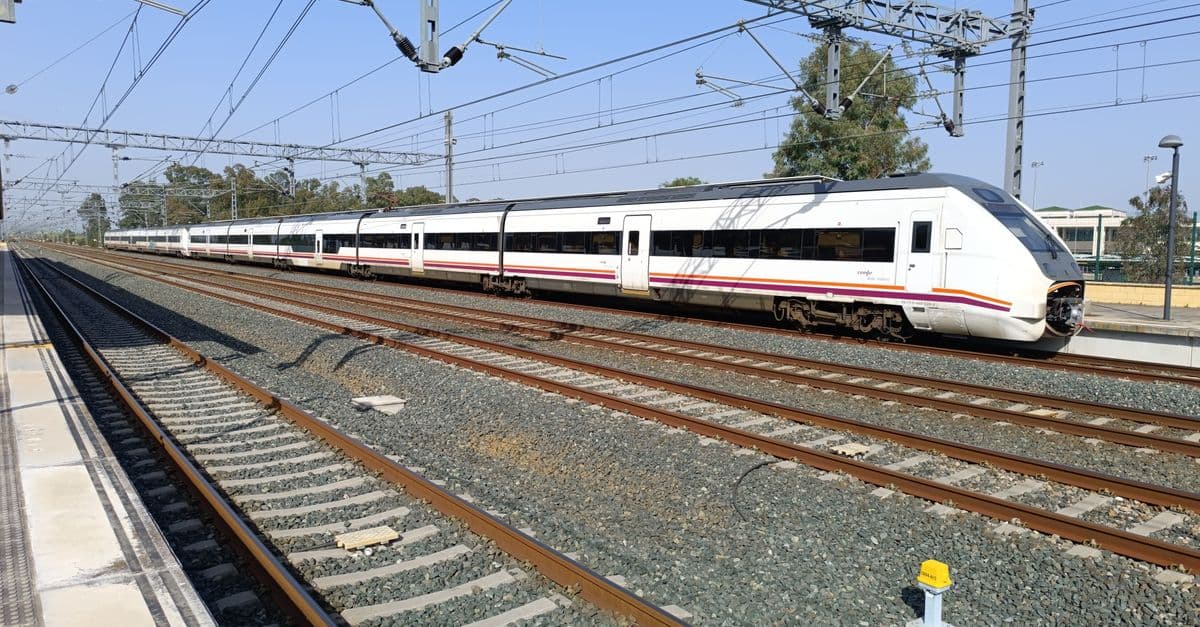
Photo: Antonio Garcia Prats / Pexels
Public transport is one of the most visible markers of urban quality of life — and one of the most important levers for reducing car dependency, carbon emissions, and urban congestion. The best systems are defined not just by coverage but by reliability, affordability, integration (seamless transfers between modes), and last-mile connectivity.
The Oliver Wyman Transit Explorer, UITP (International Association of Public Transport), and various quality-of-life rankings consistently evaluate global urban transport. Japan, Singapore, Switzerland, and Hong Kong repeatedly occupy the top positions.
Key takeaways
- Japan has the world's most punctual railway system — Shinkansen bullet trains average delays of under 1 minute over a year.
- Singapore has the highest public transport modal share of any large city at ~65% of all trips.
- Switzerland has the world's most integrated national rail network — SBB trains connect with buses, ferms, and cable cars to millimetre precision.
- Hong Kong's MTR is the world's most profitable metro, achieving fare recovery ratios above 180% through property development above stations.
- The United States ranks among the weakest developed nations for public transport — a consequence of post-WWII car-centric urban planning.
Countries with the best public transport systems
(Composite ranking based on reliability, coverage, integration, and modal share)
| Rank | Country | Notable system | Key metric |
|---|---|---|---|
| 1 | Japan | JR + Shinkansen + urban metros | <1 min avg train delay |
| 2 | Singapore | MRT + bus network | 65% modal share |
| 3 | Switzerland | SBB national rail | 92% on-time performance |
| 4 | Germany | DB + U/S-Bahn | Integrated across 16 states |
| 5 | South Korea | KTX + Seoul Metro | Seoul metro: 9.7M daily riders |
| 6 | Netherlands | NS rail + cycling integration | Highest cycling-transit integration |
| 7 | Austria | ÖBB + Vienna U-Bahn | €3/day annual transit pass (Vienna) |
| 8 | France | SNCF + Paris Métro | Paris: 5.7M daily metro riders |
| 9 | Hong Kong | MTR | Fare recovery ratio 185% |
| 10 | Sweden | SJ + Stockholm metro | — |
| 15 | Spain | RENFE AVE + Madrid Metro | Madrid Metro: 2.5M daily |
| 20 | Italy | Trenitalia + regional buses | Variable quality: north vs south |
| 25 | Australia | Mixed — state by state | Sydney better than Melbourne |
| 30 | Canada | VIA Rail + city systems | Toronto TTC reliable but limited |
| 35 | United Kingdom | National Rail + London Underground | Expensive; reliability declining |
| 45 | United States | Amtrak + city metros | Boston, NYC best; most cities car-only |
| 50 | Brazil | SPTrans São Paulo | — |
| 60 | China | HSR network + metro cities | World's longest HSR; major cities excellent |
Source: Oliver Wyman Transit Explorer, UITP (International Association of Public Transport), national transport authority reports (2024) — Ranking based on reliability (on-time performance), coverage (network density), affordability (fare-to-income ratio), and modal share (percentage of trips using public transit).
Where This Data Comes From
This ranking combines data from the Oliver Wyman Transit Explorer (a comprehensive assessment of urban transport systems globally), UITP's annual statistics, and national transport authority reports through 2024. Metrics include on-time performance (percentage of vehicles arriving within published time tolerances), network coverage (kilometers of track or route per capita or area), fare affordability (monthly pass cost as percentage of median income), and modal share (percentage of urban trips using public transit rather than private vehicles). Countries vary in data transparency; figures for comprehensive systems like Japan, Singapore, and Switzerland are well-documented, while figures for systems in developing countries may rely on estimates from transport planning agencies or research institutions.
Japan: the global standard
Japan's railway system is the most impressive in the world by most measures:
Punctuality: The Shinkansen bullet train network, operated since 1964, averages annual delays of under 1 minute due to earthquakes, weather, and mechanical issues combined. When a Shinkansen is 5 minutes late, a public apology is issued. In 2018, a Japanese train left 20 seconds early — the company apologised nationally.
Coverage and complexity: Tokyo has 13 metro lines plus 40+ suburban rail lines operated by multiple companies — with seamless transfers via IC cards (Suica/Pasmo). Getting from anywhere in Greater Tokyo (35 million people) to anywhere else by train is almost always possible within 90 minutes.
Safety: The Shinkansen has operated for 60 years and transported over 10 billion passengers without a single passenger fatality from a train accident.
The JR pass puzzle: Japan's railway system is largely privatised (Japan Railways group companies) and profitable — a rarity globally. This is achieved through property development around stations and integration with shopping, dining, and hotels at major hubs.
Singapore: the city-state model
Singapore's public transport success reflects its urban planning model — a dense city-state that made a deliberate decision in the 1960s to prevent car-centric sprawl:
Electronic Road Pricing (ERP): Singapore introduced the world's first congestion pricing system in 1998. Driving in central Singapore requires paying tolls that vary by time of day. This makes public transport economically competitive with driving.
Park and Ride: Singapore's MRT stations are surrounded by bus interchanges and cycling infrastructure, enabling genuine door-to-door multimodal journeys.
The "COE" system: Singapore requires purchasing a Certificate of Entitlement (currently S$100,000–150,000+) to own a car — making car ownership prohibitively expensive and ensuring public transport is the rational choice for most residents.
Result: 65% of trips in Singapore are by public transport — extraordinary for a city with $60,000+ GDP per capita (wealthy populations typically drive more).
Switzerland: the precision model
Switzerland's national railway (SBB) is famous for its precision integration:
The Taktfahrplan: Switzerland runs its entire rail, bus, and ferry network on a "clockface" schedule — trains and connecting buses arrive and depart at regular, synchronized intervals (typically every 30 or 60 minutes). If your train arrives at 12:02, your connecting bus leaves at 12:06. This integration means no car is needed even in remote Alpine villages.
On-time performance: SBB achieves ~92% of trains arriving within 3 minutes of schedule — the highest of any large national rail network.
Price vs. quality: Swiss rail is expensive — a monthly national pass costs ~CHF 350. But reliability makes it genuinely competitive with driving even at these prices.
Why the US lags
The United States has excellent public transport in a handful of cities (New York City, Boston, San Francisco, Washington DC) but is effectively car-only for the vast majority of its population:
Zoning and density: Post-WWII American suburban development created low-density sprawl impossible to serve economically with public transport. Buses cannot run frequently enough to be useful when destinations are 10 miles apart.
Highway subsidies: The US federal government invested massively in the Interstate Highway System (1956) while simultaneously allowing streetcar networks in most American cities to be dismantled. The car was subsidised; transit was not.
Amtrak: The US national rail service is chronically underfunded, runs on freight-owned tracks (giving freight trains right of way), and averages speeds of 50–80 mph versus Shinkansen's 200+ mph. A Boston to Washington DC trip (700 km) takes 6.5–8 hours by Amtrak — the equivalent of London to Edinburgh would take 3 hours in the UK.
Public Transport Quality: Policy Determines Outcomes, Not Wealth
The ranking reveals that public transport excellence is determined not by national wealth but by deliberate infrastructure policy sustained over decades. Japan is not the richest country—Switzerland, Denmark, and Singapore exceed it on per-capita income—yet Japan leads on reliability and convenience through consistent policy investment and private-sector innovation since the 1960s. Singapore, a city-state with lower GDP than many US metros, achieves 65% public transport modal share through anti-car policies (congestion pricing, high Certificate of Entitlement costs) that make transit the economically rational choice. Switzerland, expensive by global standards, succeeds through obsessive timetable coordination (the "clockface" schedule) that required decades of coordination between rail, bus, ferry operators. Conversely, the USA—wealthier than any of these countries per capita—lags because post-WWII policy subsidized highways while starving transit investment. Germany and the UK, wealthier than some transit leaders, underperform relative to their economic capacity because they made mixed-technology infrastructure decisions (FTTN for rail, FTTC for broadband) that locked in lower performance for decades. The lesson: a city with average wealth but excellent transit governance (coordinated planning, cross-subsidy from congestion pricing, long-term funding commitments) outperforms a wealthy city with fragmented governance and short-term budget cycles.
Frequently asked questions
What makes a public transport system financially sustainable?
Most public transport systems globally require government subsidies — fare revenue rarely covers operating costs in isolation. The notable exception is Hong Kong's MTR, which owns real estate above and around its stations, with property revenues cross-subsidising fares. Tokyo's private railways similarly derive significant revenue from station retail and property development. The key to financial sustainability is treating the station as a development platform, not just a transport node.
Is public transport better for the environment than electric cars?
In most urban contexts, yes — even compared to EVs. A full metro train carries 1,000+ passengers; an EV carries 1–5. Even accounting for electricity grid carbon intensity, per-passenger-km emissions from heavy rail are far lower than EVs in most scenarios. The urban space efficiency advantage is even stronger: a single lane of road can carry 2,000 cars/hour or 20,000 rail passengers/hour.
What is Bus Rapid Transit (BRT)?
BRT is bus service designed to function like a metro — dedicated lanes, high-frequency service, off-board ticketing, and level boarding. Curitiba (Brazil) pioneered BRT in the 1970s; Bogotá's TransMilenio is among the world's most heavily used BRT systems. BRT can provide 60–80% of rail's performance at 10–20% of the infrastructure cost, making it the preferred solution for many developing cities.
The bottom line
The world's best public transport systems share common characteristics: they are integrated (seamless transfers between modes), reliable (scheduled to the minute and consistently on time), affordable relative to local incomes, and cover sufficient density to be useful for most urban trips. Japan achieves this through engineering culture and private railway innovation; Singapore through deliberate anti-car policies that make transit the rational economic choice; Switzerland through national obsession with precision timetabling. The US demonstrates that wealth does not produce good public transport — only deliberate policy does. As climate pressure mounts and urban populations grow, the gap between countries that built transit-first cities and those that built car-first cities will become an increasingly significant quality-of-life and emissions divide.
Related Reading
Follow new articles
Add SciHub101 to your feed reader to see new science and technology stories.
About the Author
SciHub101 is an independent science and technology publication founded and edited by Buğra Sözeri, a software engineer and app developer based in Türkiye. AI tools assist with drafting and research. Source documentation in the existing archive is uneven, and articles are being reviewed and corrected. The Editorial Team byline identifies editorial responsibility; it does not certify specialist or independent human review. Where we compare products, anything built by our own team is labelled as such — see the editorial guidelines and About page for how corrections and disclosures work.
Related Articles
Countries with the Best Infrastructure (2025 Ranked)
Singapore consistently ranks first in global infrastructure quality — its port is the world's second busiest, its airport perpetually wins best-in-world awards, and its road network has near-zero potholes. Japan and Germany follow. The US scores surprisingly low given its wealth. Here's what world-class infrastructure looks like and what it costs.
Countries with the Most High-Speed Rail (2025 Ranked)
China has 45,000 km of high-speed rail — more than the rest of the world combined. Spain has the most high-speed rail per capita in Europe. Japan invented the technology with the Shinkansen in 1964. Here are the countries leading the world in high-speed rail.

Largest Solar Farms in the World
The largest solar farms rank by installed capacity, from China's Tengger park to the UAE's Al Dhafra site. Here is how capacity, land, and real output compare.
Countries with the Most Reliable Electric Grids (Regulator Data)
Germany's regulator reported 12.8 minutes of unplanned outage per customer in 2023. US customers averaged about 11 hours in 2024, a hurricane year, and about 2 hours in routine conditions. A clean global ranking does not exist because countries count outages differently, so this article compares what each national source actually reports.
Cycling Infrastructure: How to Compare Network Quality
Why kilometres of bike lanes cannot establish a global winner, and how connectivity, junctions, and design standards affect a network assessment.
Countries With the Most Electric Buses (2025)
China had more than 680,000 electric buses at the end of 2024, far ahead of any other country. This ranking compares fleets, 2024 sales, and market shares across China, India, Latin America, Europe, and the United States, and explains why the numbers are hard to line up.