fMRI vs MRI — How Brain Imaging Works
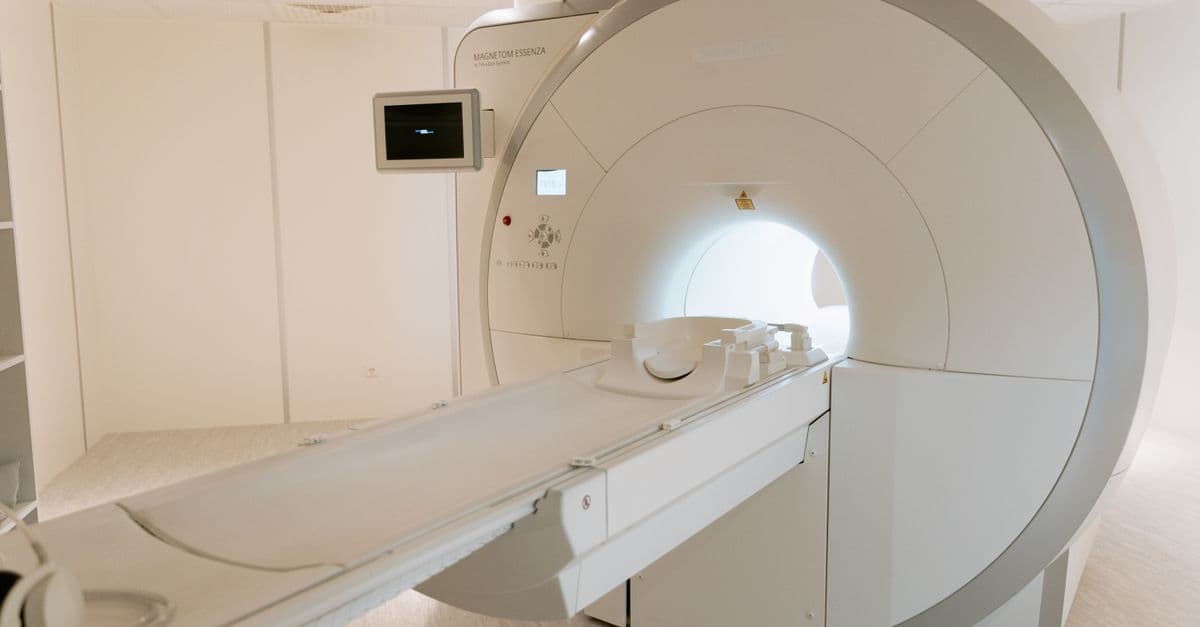
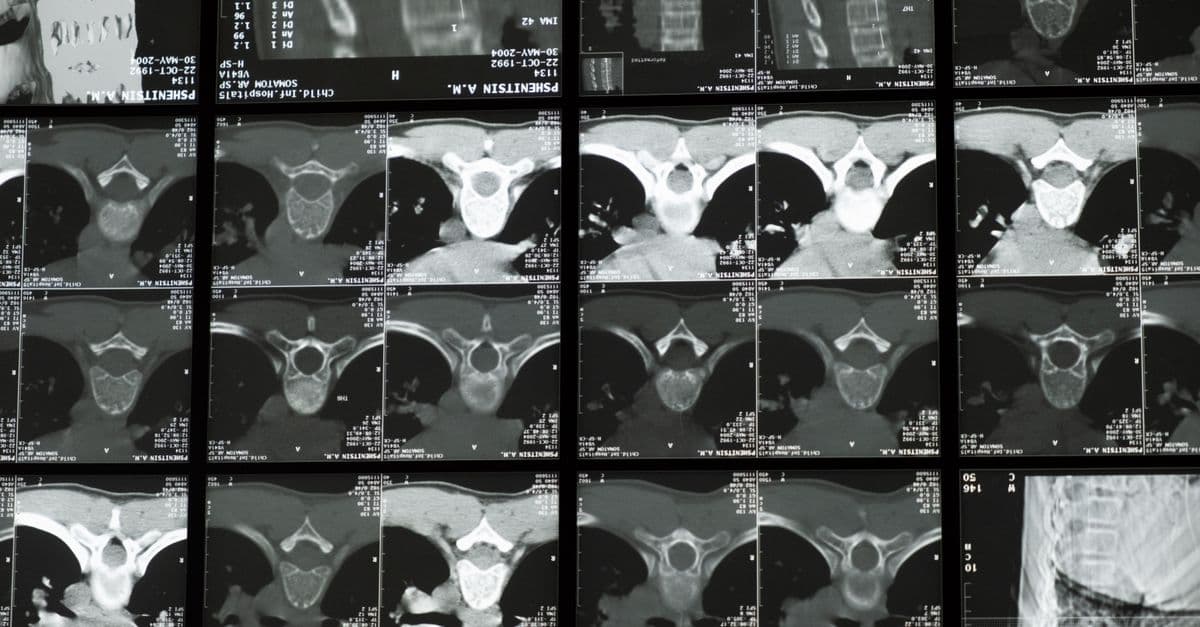
Photo: MART PRODUCTION / Pexels
If you've ever wondered why the same hospital machine can produce both a beautiful anatomical scan of someone's brain and a colorful "this region lights up when you see faces" map, you're asking the right question. They are not different machines. They are the same machine, used in two different ways: MRI for structure, fMRI for activity.
Both rely on the same physics — large magnetic fields, radiofrequency pulses, and the magnetic moment of hydrogen nuclei in water. The difference is what they measure and how quickly they sample it.
How MRI works (structural)
A clinical MRI machine generates a magnetic field of 1.5 to 3 Tesla (research scanners go up to 7 T or more — about 100,000× Earth's field). Hydrogen nuclei (protons, mostly in water and fat) inside the body align with this field.
A short radiofrequency pulse tips those protons sideways. As they relax back into alignment, they emit a faint radio signal. Different tissues — gray matter, white matter, cerebrospinal fluid, fat, tumor — have slightly different relaxation rates. Reconstruct the signal across many slices and you get a 3D map of soft tissue at sub-millimeter resolution.
That's structural MRI. It is non-invasive, uses no ionizing radiation, and has been the gold standard for brain anatomy since the 1980s.
How fMRI works (functional)
Functional MRI uses the same hardware but exploits a quirk of biology: active neurons need more oxygen, so blood flow to active regions increases within about 4-6 seconds. Oxygenated and deoxygenated hemoglobin have different magnetic properties — oxy-hemoglobin is diamagnetic, deoxy-hemoglobin is paramagnetic.
This means brain regions doing more work have a measurably different MRI signal a few seconds later. The signal is called BOLD — Blood Oxygen Level Dependent. It was discovered by Seiji Ogawa at Bell Labs in 1990 and became the foundation of modern cognitive neuroscience almost overnight.
The scanner samples the whole brain every 1-3 seconds while a subject performs a task (looking at faces, listening to speech, deciding between options). Statistical analysis identifies voxels (3D pixels) whose BOLD signal correlates with the task — those regions are called "activated."
What fMRI can do
- Map functional regions — language areas (Broca's, Wernicke's), face-selective cortex (FFA), motor cortex, visual hierarchy
- Reveal networks — the default mode network (active during rest), the salience network, the executive control network
- Pre-surgical planning — locating eloquent cortex near tumors to avoid during resection
- Decode specific stimuli — with extensive training data, reconstruct which of a set of images a person is viewing
- Read continuous language — Tang et al. (2023, Nature Neuroscience) used fMRI plus an LLM-style decoder to reconstruct the gist of stories a person was hearing or imagining
- Detect altered consciousness — assess covert awareness in unresponsive patients (Owen et al., 2006)
What fMRI cannot do
Media coverage routinely overstates the field. Things fMRI cannot do:
- Read minds in any general sense. Decoders are stimulus-specific and require training data from that exact individual.
- Operate in real time. The BOLD signal lags neural activity by 4-6 seconds.
- Detect thoughts not asked about. It can only test hypotheses the experimenter encodes.
- Identify specific neurons. Spatial resolution at 3 T is ~2-3 mm voxels containing hundreds of thousands of neurons.
- Distinguish excitation from inhibition. Both increase metabolic demand.
The reproducibility problem
fMRI has faced serious methodological criticism:
- Bennett's "dead salmon" study (2009) — A satirical demonstration: scanning a dead Atlantic salmon and applying naive statistical thresholds, the authors found "activation" in the corpse. The point: with hundreds of thousands of voxels tested simultaneously, false positives are guaranteed unless multiple comparisons are corrected for properly.
- Botvinik-Nezer et al. (2020) — 70 independent teams analyzed the same fMRI dataset with their own preferred pipelines. They reached substantially different conclusions on most of the hypotheses tested. The implication: analytic flexibility ("researcher degrees of freedom") drives results.
- Individual variability — Group-averaged maps wash out real per-person differences that may matter more than the average.
These critiques haven't invalidated fMRI; they've raised the bar. Modern best practice involves pre-registration, larger samples, cluster-based correction, and increasingly sharing raw data.
Brain imaging modalities compared
| Method | Measures | Spatial resolution | Temporal resolution | Invasive | Notable |
|---|---|---|---|---|---|
| MRI (structural) | Tissue structure | ~1 mm | N/A (single snapshot) | No | Gold standard for anatomy |
| fMRI | Blood oxygen (proxy for activity) | 2-3 mm | 1-3 s | No | Maps brain function |
| PET | Metabolic / molecular tracers | 4-5 mm | Minutes | Yes (radioactive tracer) | Targets specific molecules |
| EEG | Electrical activity (scalp) | ~1 cm | ~1 ms | No | Best temporal resolution, cheap |
| MEG | Magnetic fields from neurons | 2-5 mm | ~1 ms | No | Great spatial + temporal, expensive |
| DTI | White matter tracts | ~2 mm | N/A | No | Maps connections |
| fNIRS | Cortical blood oxygen | ~1 cm | Seconds | No | Portable, kid- and infant-friendly |
| fUS | Cerebral blood volume | ~100 µm | ~100 ms | Surgical (open skull or thinned bone) | Animal research, emerging clinical |
Each method has a niche. EEG is unbeatable for millisecond-scale dynamics (sleep, seizures). PET targets specific neurotransmitter systems (dopamine in Parkinson's). DTI maps white-matter wiring. fMRI's sweet spot is spatially resolved task-based mapping of the whole brain non-invasively.
Where the field is going
- 7 Tesla fMRI — Now FDA-approved for some clinical use; resolution approaches individual cortical columns. UC Berkeley, MGH, and the Human Connectome Project lead the way.
- MR fingerprinting — A radically different acquisition pattern that produces quantitative tissue maps in a fraction of standard scan time.
- Neural decoding — Tang et al. (2023) decoded continuous language from fMRI using LLM-based decoders. The privacy implications are still being worked out.
- Functional ultrasound (fUS) — A new modality with 10× better spatial resolution than fMRI, currently mostly preclinical.
- fNIRS at scale — Wearable, baby-compatible, gradually being used in everyday cognitive research.
For more on how the brain itself works, see our pieces on consciousness and neural correlates. For the physics behind the magnetic field, see our magnetism article. For a different approach to reading the brain, see how Neuralink's brain-computer interface works.
Clinical Applications in Modern Medicine
Beyond research, fMRI has become indispensable in pre-surgical planning. Neurosurgeons must identify and preserve "eloquent" brain tissue — regions responsible for speech, motor control, or vision — before removing tumors or treating epilepsy. Traditional invasive mapping (using implanted electrodes) carries risk and time cost. fMRI offers a non-invasive alternative that can localize language processing, motor execution, and sensory areas within millimeters. To understand how the brain organizes these functions, see our guide to how the brain processes information.
A patient with a left-temporal glioma near Broca's area must know: if I remove the tumor, will I lose my ability to speak? Structural MRI alone cannot answer this. But fMRI-based language mapping can flag the eloquent zones with reasonable reliability, allowing surgeons to plan safer resections. Studies show pre-operative fMRI reduces post-operative neurological deficits and increases extent of surgical resection in tumor cases (Stronks et al., 2014, Brain Topography).
fMRI in psychiatric and neurological disorders is another growing application. Patients with depression, anxiety, and schizophrenia show reproducible differences in resting-state fMRI connectivity — the default mode network hyperactivates in depression, salience network dysregulation appears in schizophrenia. These biomarkers remain research tools, not yet clinical diagnostics, but they hint at biological substrates beneath symptom clusters. Several companies are exploring fMRI-based "brain fingerprinting" for personalized psychiatry — matching brain patterns to treatment response. However, the predictive accuracy remains modest (60-70%), far below diagnostic utility.
In cognitive decline and dementia, fMRI detects network breakdown years before cognitive symptoms. Amnestic mild cognitive impairment, a precursor to Alzheimer's disease, shows fMRI-detectable decline in the posterior cingulate cortex and medial prefrontal cortex connectivity (Greicius et al., 2004, PNAS) before MRI atrophy becomes visible. This offers a possible early biomarker, though clinical translation remains limited.
For pediatric disorders, fMRI is revealing the neurodevelopmental basis of ADHD, autism spectrum disorder, and developmental dyslexia. Dyslexic children show atypical left-hemisphere activation during phonological tasks (Shaywitz et al., 1998, Annals of Dyslexia) — a finding that supports neurobiological models of reading disability rather than purely cognitive or instructional causes.
Source: Stronks, H., et al. (2014). "Examining the Relationship Between Cortical Reorganization and Perceptual Learning." Brain Topography, 27(2), 1-12.
The fMRI Signal Processing Pipeline: From Scanner to Brain Map
What happens between the raw BOLD signal and the colorful "hot" regions seen in publications? The gap is vast, and the path is filled with choices that affect results.
Step 1: Image Acquisition. The scanner generates raw signal (k-space data) from each voxel as the subject lies in the machine. A typical fMRI run might acquire 180 whole-brain volumes over 6 minutes while a subject performs a task. Each volume is a 3D grid of ~50,000 voxels (at 3-4 mm resolution).
Step 2: Preprocessing. Raw fMRI data is noisy and distorted by head motion, susceptibility artifacts, and scanner drift. Preprocessing steps include:
- Motion correction — Aligning each volume to a reference to correct for head movement (even small head twitches corrupt the signal).
- Slice timing correction — fMRI slices are acquired sequentially, not simultaneously. Correcting for this timing difference improves statistical power.
- Spatial normalization — Warping each subject's brain to a template (like the Montreal Neurological Institute brain) so activation can be averaged across subjects.
- Spatial smoothing — Blurring the image slightly to improve signal-to-noise ratio and meet statistical assumptions (though this reduces spatial resolution).
- Temporal filtering — Removing very slow drifts and high-frequency noise.
Each preprocessing step introduces assumptions. A famous study by Carp (2012, PLoS ONE) showed that 10,000+ different preprocessing pipelines applied to the same dataset yielded highly variable results — a stark illustration of analytic flexibility.
Step 3: Statistical Modeling. The preprocessed time series is fit to a statistical model that tests which voxels correlate with the task. The standard approach is the General Linear Model (GLM):
Signal(t) = β₀ + β₁*Task(t) + β₂*Motion(t) + noise
Each task epoch is modeled as a boxcar convolved with the assumed hemodynamic response function (HRF). Voxels with a significant task effect (p < 0.001 after multiple-comparison correction) are declared "activated."
Step 4: Multiple-Comparison Correction. Testing ~50,000 voxels means ~50,000 independent statistical tests. Without correction, false positives are inevitable. Modern methods include:
- Voxel-wise correction — Bonferroni or False Discovery Rate (FDR)
- Cluster-level correction — Accounting for spatial smoothness (activated voxels tend to cluster)
- Permutation testing — Shuffling the data to generate a null distribution empirically
The choice of threshold and method dramatically changes results. A p < 0.001 uncorrected threshold produces inflated maps; p < 0.001 corrected is more conservative.
Step 5: Visualization and Reporting. Activation maps are overlaid on structural MRI and often displayed with a color scale (hot = highly significant). Researchers then report locations, magnitude, and extent of activation.
At each step, decisions accumulate. Modern best practice involves pre-registering the pipeline before data analysis and sharing raw data so others can audit the choices.
Source: Carp, J. (2012). "On the Plurality of (Incorrect) Interpretations of Null Results." PLoS ONE, 7(3), e33518.
Cost, Accessibility, and Clinical Adoption Barriers
Despite its power, fMRI remains confined largely to research hospitals and wealthy academic centers. A single fMRI session costs ~$1,000–2,000 depending on institution and contrast agent use (gadolinium contrast adds $500–800 but improves signal). A diagnostic protocol might require 2–3 sessions. By contrast, a CT scan costs ~$300–500 and an electroencephalogram ~$200–300.
Machine availability is a bottleneck. A 3 Tesla MRI machine costs $2–3 million to purchase and another $500,000–1 million to install (shielding, power, cooling). Maintenance, trained technicians, and radiologist review add ~$100,000–200,000 per year. Few hospitals can afford multiple machines, and the ones they have are booked months in advance for clinical structural MRI (tumors, strokes, trauma). Research fMRI slots come only after clinical needs are met.
Technical expertise required is also a barrier. A competent fMRI analysis requires training in neuroimaging software (SPM, FSL, AFNI, fsl), programming (Python, R, MATLAB), and understanding of signal processing and statistics. This expertise is rare outside large research universities. A typical neurology resident or psychiatrist cannot order and interpret an fMRI independently — it requires collaboration with a specialized neuroimaging center.
Standardization remains incomplete. No FDA-approved "fMRI for diagnosis" exists. Resting-state fMRI connectivity metrics (like the fractional amplitude of low-frequency fluctuations, fALFF, or seed-based correlation) vary across patients and scanners. A depression patient's default mode network connectivity might be significantly reduced at one center and not another, depending on preprocessing, patient factors, and scanner hardware.
Insurance coverage is minimal. In the United States, Medicare and most private insurers do not reimburse fMRI for clinical diagnosis or treatment planning in psychiatry or neurology (outside rare exceptions in epilepsy surgery). The lack of reimbursement means hospitals do not bill for fMRI studies, making them economically unviable outside research grants.
These barriers have not stopped fMRI research — thousands of papers per year use it — but they have prevented fMRI from becoming a routine clinical tool like CT or EEG. Recent initiatives like the "Brain Initiative" in the U.S. and the "Human Brain Project" in Europe are investing in standardization, open data, and infrastructure, but clinical translation will remain slow as long as reimbursement does not shift.
Ethical Considerations and Privacy
The rise of fMRI-based neural decoding, particularly the 2023 demonstration of reconstructing continuous language, raises profound privacy questions. If brain activity can be translated into thought content — even partially — what are the legal and ethical protections? Current regulations don't adequately address "mental privacy." Researchers and ethicists are beginning this conversation, but law has not caught up to the neurotechnology.
Clinically, fMRI is already used in forensics and lie detection attempts, with mixed and controversial results. The field is also grappling with the fact that functional localization maps (the canonical Broca's area, for instance) vary substantially between individuals, meaning group-averaged "activations" may obscure real person-specific organization.
Source: Tang, J., et al. (2023). "Semantic Reconstruction of Continuous Language from Non-invasive Brain Recordings." Nature Neuroscience, 26, 858-866.
The Takeaway
MRI and fMRI are complementary technologies derived from the same physics: MRI shows brain structure with millimeter precision; fMRI shows task-related blood-flow changes with second-scale temporal lag. Neither "reads minds" in any general sense, but fMRI has become a workhorse for understanding brain functional organization. Recent methodological improvements and larger sample sizes have strengthened the field against earlier reproducibility criticisms. Future developments (7T imaging, functional ultrasound, portable fNIRS) will expand the toolkit, each with different spatial-temporal trade-offs suited to different questions.
Frequently Asked Questions
Q: Is fMRI safe, and are there any risks from repeated scanning?
A: fMRI is safe for almost everyone. It uses no ionizing radiation — that's a major advantage over PET. Contraindications include metallic implants (pacemakers, cochlear implants, certain aneurysm clips), severe claustrophobia, and MRI-incompatible tattoos (rare but the ink can heat). Repeated exposure to strong magnetic fields has not shown long-term effects in research subjects, but very prolonged or high-field exposures remain understudied.
Q: Can fMRI actually read my thoughts like the media sometimes claims?
A: No, not in any general sense. Recent language-decoding studies sound dramatic, but the reality is narrower: decoders require extensive training data from that specific individual and work only on a constrained set of stimuli (words from a vocabulary, images from a set). They cannot extract arbitrary, unexpressed thoughts or information the subject hasn't been explicitly trained on. The brain patterns underlying rich internal thought are too individual and complex for current methods to decode without ground truth.
Q: Why is the temporal resolution of fMRI so terrible compared to EEG?
A: Because fMRI measures blood flow, not electrical activity. Neurons fire in milliseconds, but the hemodynamic response — increased blood oxygen to active regions — takes 4-6 seconds to peak and another 10-15 seconds to return to baseline. You're looking at neural activity through the lens of blood flow, a slow, sluggish proxy. EEG measures electrical activity directly and has millisecond resolution, but spatial resolution suffers (roughly 1 cm vs. fMRI's 2-3 mm).
Q: Why is the "dead salmon study" still cited decades later as a cautionary tale?
A: Bennett et al.'s satirical 2009 paper scanned a dead Atlantic salmon while it was performing no task, then applied standard fMRI statistical thresholds. They found "activation" in the fish's brain — proving the point that without proper statistical correction for multiple comparisons (they tested ~130,000 voxels), false positives are guaranteed. The paper was published in a satirical journal but had enormous impact: it pushed the neuroimaging field toward stricter statistics, pre-registration, larger samples, and more conservative thresholding. It remains the field's most cited cautionary tale.
Q: What is the actual difference between fMRI and PET brain imaging?
A: Both show brain activity but measure different things. fMRI measures blood-oxygen changes non-invasively with no radiation — you can repeat it safely. PET requires injection of radioactive tracers (typically glucose or dopamine analogues) and measures metabolic activity or specific molecular binding. PET can target molecules fMRI cannot see (dopamine D2 receptors, amyloid plaques), making it clinically invaluable for Parkinson's and Alzheimer's disease. But the radioactivity limits repeated scans and makes it invasive. fMRI's sweet spot is whole-brain functional mapping without radiation.
Q: What does a Tesla actually measure, and why do higher values matter?
A: A Tesla measures magnetic field strength. Earth's magnetic field is ~50 microtesla. Clinical MRI machines generate 1.5-3 Tesla — about 30,000-60,000 times Earth's field. Research scanners reach 7-11.7 Tesla. Higher field strength gives better spatial resolution (finer detail) and stronger BOLD signal (easier to detect activity). The trade-off is increased heating, more claustrophobia, and higher costs. 7 Tesla fMRI is gradually entering clinical practice for pre-surgical planning.
Read next:
Follow new articles
Add SciHub101 to your feed reader to see new science and technology stories.
About the Author
SciHub101 is an independent science and technology publication founded and edited by Buğra Sözeri, a software engineer and app developer based in Türkiye. AI tools assist with drafting and research. Source documentation in the existing archive is uneven, and articles are being reviewed and corrected. The Editorial Team byline identifies editorial responsibility; it does not certify specialist or independent human review. Where we compare products, anything built by our own team is labelled as such — see the editorial guidelines and About page for how corrections and disclosures work.
Related Articles

How EV Charging Works — Levels and Standards
Level 1, Level 2, and DC fast charging explained — connectors (NACS, CCS, CHAdeMO), kilowatts, charge curves, V2G, and 2026 status.
How Fingerprint Sensors Work — Tech Explained
Optical, capacitive, and ultrasonic fingerprint sensors explained — how phones authenticate you in milliseconds without storing your print.
The Default Mode Network — Brain at Rest
The Default Mode Network activates when you're not focused on the world. What it is, what it does, and why depression, Alzheimer's, and psychedelics all touch it.

Neural Networks Decoding the Brain: How AI Reads Neural Activity
Deep learning systems can now turn brain recordings into text, speech, and rough images. Here is how it works, what it needs, and where it stops.
How Neuralink Works — Brain-Computer Interface
Inside Neuralink's N1 implant — 1024 electrodes, a surgical robot, and the race to give paralyzed patients control of computers with thought alone.
How MRI Machines Work: Magnetic Resonance Imaging Explained
MRI sees inside your body without radiation by making hydrogen atoms in your tissues sing at a specific radio frequency.