The Great Red Spot: Science Behind Jupiter's 350-Year Storm
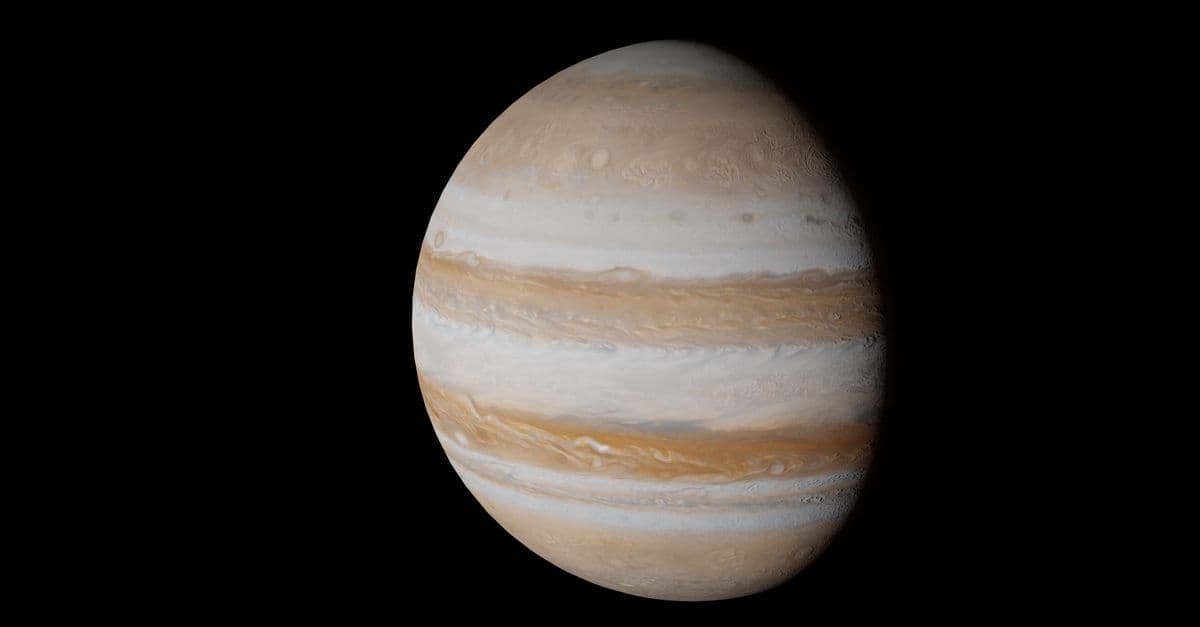
Photo: Felix Mittermeier / Pexels
No storm system anywhere in the solar system has persisted longer, been observed by more people over more centuries, or resisted scientific explanation more stubbornly than Jupiter's Great Red Spot. It is an anticyclone — a high-pressure rotating weather system — that has been turning continuously since at least 1831, and probably since its first reliable telescopic observation in 1665. That means it predates the invention of the steam engine, the Industrial Revolution, and the existence of the United States. It is larger than Earth. And it goes 500 km deep.
350 Years of Continuous Observation
The Great Red Spot has a complicated observational history. Italian astronomer Giovanni Cassini described a "permanent spot" on Jupiter in 1665, and observations from that era show a large oval feature in the appropriate location. That 17th-century spot faded from records around 1713 and a second, redder feature appeared in 1831 — whether these are the same storm that briefly faded or two separate events is unresolved.
What is certain is that the current Great Red Spot has been continuously monitored since the 1870s, when systematic planetary photography began. The earliest reliable photographs, from 1879, show a feature roughly 40,000 km across — more than three times Earth's diameter — at the boundary between Jupiter's South Equatorial Belt and the South Tropical Zone, at about 23 degrees south latitude.
The Spot appears in the southern hemisphere because of where Jupiter's jet streams position the boundaries between the belts and zones. It is pinned between an eastward jet stream to its north and a westward jet stream to its south — the same lateral shear that organizes the storm also traps it, preventing it from migrating to other latitudes.
Source: Rogers, J.H. (1995) — The Giant Planet Jupiter, Cambridge University Press; historical observation records and Cassini's 17th-century reports.
How an Anticyclone Works — and Why This One Persists
A cyclone is a low-pressure weather system where air spirals inward and upward, drawing energy from temperature differentials. A tropical hurricane is a cyclone: it feeds on warm ocean water. An anticyclone is the opposite — a high-pressure system where air spirals outward and descends, with no active energy input from below. On Earth, anticyclones are fair-weather systems that dissipate in days to weeks.
Anticyclone — a large-scale rotating atmospheric system characterized by high pressure at its center, with air circulating outward in a clockwise direction in the southern hemisphere (counterclockwise in the northern hemisphere); on Jupiter, anticyclones appear as bright oval features.
The Great Red Spot rotates counterclockwise (as seen from above) at the boundary between opposing jet streams. Its outer edge moves at about 450 km/h (280 mph). This placement at the interface of two opposing flows is what makes it stable: the shear from the opposing jets acts like the walls of a container, keeping the vortex coherent. Without that shear boundary, the storm would mix with the surrounding atmosphere and dissipate.
On Earth, no equivalent structure exists because Earth's oceans introduce friction and absorb energy, and because Earth's weather is driven by surface heating from below — all factors that break up persistent vortices. Jupiter has no solid surface, and its energy budget is different: it radiates roughly twice as much heat as it receives from the Sun, driven by internal residual heat from its formation. That deep internal energy source maintains the jet stream structure indefinitely.
The analogy that captures this: imagine two river currents flowing in opposite directions on either side of a rotating cylinder. The cylinder — the vortex — is sustained by the shear between the rivers, not by any inherent energy of its own. Remove the rivers, and the cylinder stops. The rivers are Jupiter's jet streams, and they have been flowing for billions of years.
Source: Mitchell, J.L. et al. (1981) — Voyager observations of Great Red Spot vorticity; Ingersoll, A.P. et al. (1979) — Jupiter meteorology from Voyager, Science.
Why Is It Red? The Chromophore Problem
The color of the Great Red Spot is one of the most persistently debated questions in planetary science. Jupiter's atmosphere is predominantly hydrogen and helium — both colorless. The clouds visible from space are ammonia crystals (white) and ammonium hydrosulfide (brown-yellow). The Great Red Spot is distinctly reddish-brown, and the shade varies: at times in the 19th century it was described as brick-red; in recent decades it has lightened to a more salmon or pale orange color.
Chromophore — a molecular or atomic group responsible for a compound's color by selectively absorbing certain wavelengths of light; in planetary science, used to describe the unknown coloring agents in Jupiter's clouds.
The leading hypotheses fall into two categories:
Surface chemistry (shallow chromophore model): Ultraviolet radiation from the Sun breaks apart ammonia (NH₃) and acetylene (C₂H₂) in the upper cloud layer, producing complex organic molecules — including long-chain polysulfides and nitrogen-bearing organic compounds — that are reddish-brown. This chemistry happens at the top of the cloud deck, creating a thin layer of colored material sitting atop white ammonia clouds. Laboratory experiments simulating the UV photolysis of ammonia-acetylene-water mixtures do produce reddish compounds with spectral properties matching the observed Great Red Spot color.
Deep chemistry (deep upwelling model): Material from deep in Jupiter's atmosphere, where pressures are tens of bars and temperatures hundreds of degrees Kelvin, is carried upward into the cloud deck by the anticyclone's upwelling motions. This material contains phosphine (PH₃) and hydrogen sulfide (H₂S), which react under UV to form red phosphorus (P₄) or polysulfide compounds. The Great Red Spot's reddest coloration occurs at its highest, coldest core — consistent with upwelling of chemical precursors from depth.
Neither model is conclusively proved. The laboratory spectroscopy supports the shallow chromophore model for color matching, but the spatial correlation between storm intensity (strongest upwelling) and deepest red color supports the deep chemistry model.
Source: Carlson, R.W. et al. (2016) — "Chromophores from Photolyzed Ammonia Reacting with Acetylene and Diacetylene in Jupiter's Upper Clouds," Icarus; West, R.A. et al. (1986) — Great Red Spot spectrophotometry.
Juno's Discovery: It Goes 300 to 500 Kilometers Deep
Before Juno arrived at Jupiter in 2016, the Great Red Spot was assumed to be a relatively shallow atmospheric feature — perhaps 100–200 km deep, confined to Jupiter's upper weather layer. The assumption was that below a certain pressure level, the winds should decay and the storm should lose coherence.
Juno tested this with two instruments: a microwave radiometer that can sense temperatures deep into Jupiter's atmosphere (below the cloud tops) and a gravimeter accurate enough to detect the tiny gravitational pull of the storm's mass excess as Juno flew over it at over 200,000 km/h.
In 2021, the Juno team published results in Science: the Great Red Spot extends down to at least 300 km, possibly 500 km — deeper than expected, deeper than the nominal cloud-forming weather layer (which extends to about 65 km below the visible cloud tops), but shallower than the deep jet streams that may extend 3,000 km or more. The gravity signal confirmed that the storm has a vertically coherent structure: it is not a surface phenomenon floating on a calm deep atmosphere, but a column that reaches far below what any spacecraft had previously probed.
At 500 km wide (vertically), the storm is still much wider horizontally — about 16,000 km in its current shrunken form — making it a roughly pancake-shaped structure. But a 500 km deep pancake is still an extraordinary object.
Source: Iess, L. et al. (2018); Bolton, S.J. et al. (2021) — "Microwave observations reveal the deep extent and structure of Jupiter's atmospheric winds," Science.
The Shrinking: A Century of Decline
The most striking trend in Great Red Spot data is the shrinking. In the 1880s, the storm was measured at about 40,000 km across (east-west). By 1979, when Voyager 1 flew past, it had contracted to about 24,000 km. Hubble Space Telescope images in the 1990s measured it at around 20,000 km. By 2014, the diameter had dropped to roughly 16,500 km. Current estimates (2024) put it at approximately 14,000–16,000 km — still larger than Earth's diameter (12,742 km), but barely.
The shrinking rate is roughly 900 km per year over the past decade, though it is not constant. The storm appears to be compressing as well as shrinking: as its east-west diameter decreases, its shape has become rounder and its north-south width has stayed more stable, changing the storm from an elongated oval to a more circular feature.
| Year | Approximate E-W Diameter | Source |
|---|---|---|
| ~1880s | ~40,000 km | Historical telescopic records |
| 1979 | ~24,000 km | Voyager 1 imaging |
| 1995 | ~20,000 km | Hubble Space Telescope |
| 2014 | ~16,500 km | Hubble Space Telescope |
| 2024 | ~14,000–16,000 km | Juno / ground-based |
Why is it shrinking? The current leading hypothesis is that smaller storms called "white ovals" that regularly interact with the Great Red Spot used to feed it energy when they merged or were absorbed. These mergers, which occurred frequently in the 20th century, added angular momentum and fresh vorticity. As the population of white ovals in Jupiter's South Tropical Zone has itself declined, the Great Red Spot has fewer energy inputs and is slowly losing mass to the surrounding atmosphere.
Source: Simon, A.A. et al. (2018) — "Historical and Contemporary Trends in the Size, Drift, and Color of Jupiter's Great Red Spot," The Astronomical Journal.
The 2019 "Unraveling" Scare
In May 2019, amateur and professional astronomers observing Jupiter noticed that the Great Red Spot appeared to be shedding large reddish-brown flakes or streamers from its edges. Time-lapse sequences showed elongated tendrils being pulled away from the storm's perimeter by the surrounding jet streams. Social media headlines declared that the Great Red Spot was "falling apart."
Planetary scientists were considerably less alarmed. The Great Red Spot regularly sheds filaments and smaller vortices from its edges — this is part of the normal interaction between the storm and its surrounding shear zone. The 2019 events were described by researchers at the Space Telescope Science Institute as particularly dramatic examples of this ongoing process, not evidence of imminent breakup.
The distinction matters: the Great Red Spot sheds mass from its periphery while maintaining its coherent central core. The core retains the characteristic red color and organized circulation. What gets shed are the less tightly bound outer layers, which are quickly mixed into the surrounding atmosphere. The core persists because the jet stream shear keeps refilling its angular momentum.
Whether the Great Red Spot will eventually disappear entirely is a genuine scientific question, not one with a near-term answer. Current models suggest it could persist for at least several more decades, and possibly centuries, depending on how the surrounding meteorology evolves. Some models suggest that as it continues to shrink and become more circular, it may actually become more stable — a smaller, more intense vortex rather than a large, diffuse one.
Source: Simon, A.A. et al. (2019) — press briefing, Space Telescope Science Institute; Sánchez-Lavega, A. et al. — Great Red Spot dynamics studies.
What People Get Wrong About the Great Red Spot
The most persistent misconception is that the Great Red Spot is "a storm like a hurricane." It is not. A hurricane is a cyclone — low pressure at the center, drawing energy from warm ocean water, with an eye where air descends. The Great Red Spot is an anticyclone — high pressure at the center, with air subsiding and flowing outward. It draws its energy not from a warm surface below but from the kinetic energy of the opposing jet streams that border it. A hurricane dissipates when it moves over cold water or land; the Great Red Spot has neither to dissipate against.
The second misconception is that it is growing weaker because it is shrinking. Shrinking in diameter does not necessarily mean weakening in intensity. As the storm compresses, its wind speeds at the edges appear to have been increasing rather than decreasing. A tighter, faster anticyclone is not a weaker one.
The third: the red color proves something exotic is happening. Reddish-brown organic chemistry is actually fairly mundane in Jupiter's atmosphere. The white ovals that occasionally form from merging storms sometimes turn brown or red as they age and accumulate UV-photolyzed material. The color of the Great Red Spot reflects chemistry, not some unique process exclusive to this storm.
Why the Great Red Spot Is Shrinking — and Whether It Will Survive
The historical record of the Great Red Spot's size is one of the longest continuous datasets in planetary science, and it tells an unambiguous story of contraction. In the 1880s, the storm's longest east-west axis measured roughly 40,000–45,000 km — about three and a half Earth diameters. By the time Voyager 1 photographed it in 1979, the diameter had contracted to approximately 24,000 km. Hubble Space Telescope monitoring through the 1990s recorded it at 20,000 km. By 2014, systematic Hubble measurements put the figure at 16,500 km. Measurements compiled through the Juno mission era, including ground-based observations from 2019 to 2023, place the current east-west diameter at roughly 14,000 km — barely larger than Earth.
Source: Simon, A.A. et al. (2018) — "Historical and Contemporary Trends in the Size, Drift, and Color of Jupiter's Great Red Spot," The Astronomical Journal, documenting size measurements from 1879 to 2018 using photographic plates, HST imagery, and amateur observations.
That century-long record hides significant year-to-year variability: the storm does not shrink smoothly. Periods of faster contraction have alternated with apparent plateaus, and the shape change has been as notable as the size change. In the late 19th and early 20th centuries the storm was an elongated oval, roughly 2.5 times longer east-west than north-south. By the 2020s it has become nearly circular, with the north-south diameter contracting far more slowly than the east-west. The storm is, in a structural sense, being squeezed into a more compact form. Whether that compression is a sign of weakening or of intensification is the central dispute.
The "flaking" events of 2019 to 2023 added a new complication. Starting in May 2019, observers noted that large, reddish-brown streamers — called flakes or blades — were being shed from the storm's outer edge and swept into the surrounding jet streams. At least four distinct large flaking episodes occurred between 2019 and 2023, each producing elongated tendrils hundreds to thousands of kilometers long before they were sheared apart by the opposing wind flows flanking the storm. Unlike the normal small-scale filament shedding that has been documented since the Voyager era, these flakes were conspicuous enough to prompt media coverage and concern about imminent breakup.
The planetary science community's assessment was more measured. Amy Simon at NASA's Goddard Space Flight Center, who leads the Outer Planet Atmospheres Legacy (OPAL) program that has provided annual Hubble imaging of Jupiter since 2014, described the 2019 events as an unusually active period of edge interaction — the storm consuming and partly ejecting smaller vortices and cloud structures it had absorbed. The Great Red Spot's central core, the region of deep red coloration and organized anticyclonic rotation, remained intact throughout. Flaking removes peripheral material that was not tightly bound to the core vortex; it does not erode the storm's structural foundation.
Two competing hypotheses are offered for the long-term shrinkage. The absorption-starvation hypothesis holds that the Great Red Spot historically maintained its size by absorbing smaller white oval storms that formed in its vicinity and drifted into it. These merger events have been documented: the three white ovals known as the Pearls of Aphrodite merged into a single storm called Oval BA in 1998–2000, and Oval BA itself has at times appeared to interact with the Great Red Spot. If the population of feedstock vortices in Jupiter's South Tropical Zone declines — as some models suggest has been happening over recent decades — the Great Red Spot loses mass inputs it was receiving and the net flux of material out of the storm via edge shedding is no longer compensated.
The exhaustion hypothesis is simpler: the storm has been slowly losing angular momentum and mass to the surrounding atmosphere since at least the 19th century, and the flaking events are the mechanism by which that loss occurs. In this view, the storm never had an indefinitely renewable energy source — it has always been running down from its initial conditions, just on a timescale of centuries rather than the days-to-weeks typical of Earth anticyclones. Jupiter's jet stream shear structure provides the walls of the container, but those walls are not perfectly insulating. Every flaking event, every filament shed into the surrounding atmosphere, represents a net export of vorticity from the storm.
Juno's 2021 finding that the Great Red Spot extends 300–500 km deep complicates both hypotheses in the same way: a storm with that much vertical extent has far more angular momentum stored in its column than a shallow storm would. Think of it as the difference between spinning a coin versus spinning a cylinder of the same diameter — the cylinder has far more rotational inertia and takes much longer to slow down once started. A 500 km deep anticyclone on Jupiter is more resistant to dissipation than any model based on shallow-layer assumptions would predict.
What Juno's depth measurement tells us about longevity: The storm's vertical coherence to 300–500 km depth means it is anchored in atmospheric layers below the cloud-forming weather layer, where horizontal wind shear is weaker and large-scale dynamics are more stable. This is not the fragile surface phenomenon that early models assumed. Whether it will survive the next century depends on variables that current observations do not yet constrain: the future behavior of Jupiter's jet streams, the supply of feedstock vortices, and the storm's own internal dissipation rate. Models run by teams at the University of Leicester and at Caltech's atmospheric science group suggest the storm could stabilize as a smaller, more circular, and potentially more intense vortex — a compact anticyclone with a tighter core — rather than dissipating entirely. That prediction will be tested by whoever is watching Jupiter in 2125.
Source: Bolton, S.J. et al. (2021) — "Microwave observations reveal the deep extent and structure of Jupiter's atmospheric winds," Science; Adriani, A. et al. — Juno JIRAM observations of the Great Red Spot thermal structure.
FAQs
Q: How long has the Great Red Spot existed?
A: The current storm has been continuously observed since at least 1831. A "permanent spot" was recorded by Giovanni Cassini in 1665, but whether that is the same feature is debated. The current Great Red Spot is at minimum approximately 350 years old.
Q: Is the Great Red Spot bigger than Earth?
A: Currently, the Great Red Spot is roughly 14,000–16,000 km in its longest dimension (east-west), compared to Earth's diameter of about 12,742 km. It is about 1.1–1.3 Earth-diameters wide, down from roughly 3 Earth-diameters in the 1880s.
Q: Why is the Great Red Spot red?
A: The exact chemical cause is still debated. Leading hypotheses involve UV photolysis of ammonia and acetylene creating complex organic chromophores in the upper cloud layer, or upwelling of phosphine and hydrogen sulfide that react to form red phosphorus or polysulfide compounds.
Q: How deep is the Great Red Spot?
A: Juno mission gravity and microwave data, published in 2021, constrain the depth to approximately 300–500 km. This is far deeper than the cloud-forming weather layer (~65 km) but shallower than Jupiter's deep jet streams, which may extend to 3,000 km.
Q: Will the Great Red Spot disappear?
A: It has been shrinking for at least 140 years of reliable measurement. Whether it will vanish entirely is unknown. Some atmospheric models suggest it could stabilize as a smaller, more circular, possibly more intense vortex. Others project continued shrinking. No reliable timeline for disappearance exists.
Q: What was the 2019 "unraveling" event?
A: In May 2019, the Great Red Spot was observed shedding large flakes and streamers from its edges, leading to headlines about the storm falling apart. Planetary scientists identified this as an unusually dramatic instance of normal edge-shedding behavior, not evidence of structural failure. The storm's central core remained intact and continues to persist.
The Takeaway
The Great Red Spot is not a mystery, exactly — we understand its mechanics well enough to predict that it will persist, and to explain why. What remains genuinely unresolved is the chemistry of its color, the precise mechanism of its slow shrinkage, and whether a storm that has defied expectations for three and a half centuries will eventually succumb or compress into something even stranger. Juno's discovery that it reaches 300–500 km deep rewrote what planetary scientists thought they knew about vortex depth in giant planet atmospheres. The next surprise is probably already waiting in the data.
Read next:
Follow new articles
Add SciHub101 to your feed reader to see new science and technology stories.
About the Author
SciHub101 is an independent science and technology publication founded and edited by Buğra Sözeri, a software engineer and app developer based in Türkiye. AI tools assist with drafting and research. Source documentation in the existing archive is uneven, and articles are being reviewed and corrected. The Editorial Team byline identifies editorial responsibility; it does not certify specialist or independent human review. Where we compare products, anything built by our own team is labelled as such — see the editorial guidelines and About page for how corrections and disclosures work.
Related Articles
Venus Atmosphere Chemistry Explained: 92 Bars, Acid Clouds, and the Phosphine Mystery
Venus has a surface pressure 92 times Earth's, clouds made of sulfuric acid, and a surface hot enough to melt lead — yet something in its middle cloud deck may have hinted at life. Explore the chemistry behind the solar system's most hostile atmosphere and the missions racing to decode it.
Pluto: What New Horizons Found in 2015 and What We Still Don't Know
New Horizons flew within 12,550 km of Pluto on July 14, 2015 — the only spacecraft ever to do so — and transmitted data for 16 months afterward. What it found was not a dead, cratered iceball at the edge of the solar system but an active world with mountains of water ice, a heart-shaped nitrogen glacier the size of Texas, and possibly a liquid ocean beneath the ice.
What Is Jupiter's Great Red Spot — And Is It Dying?
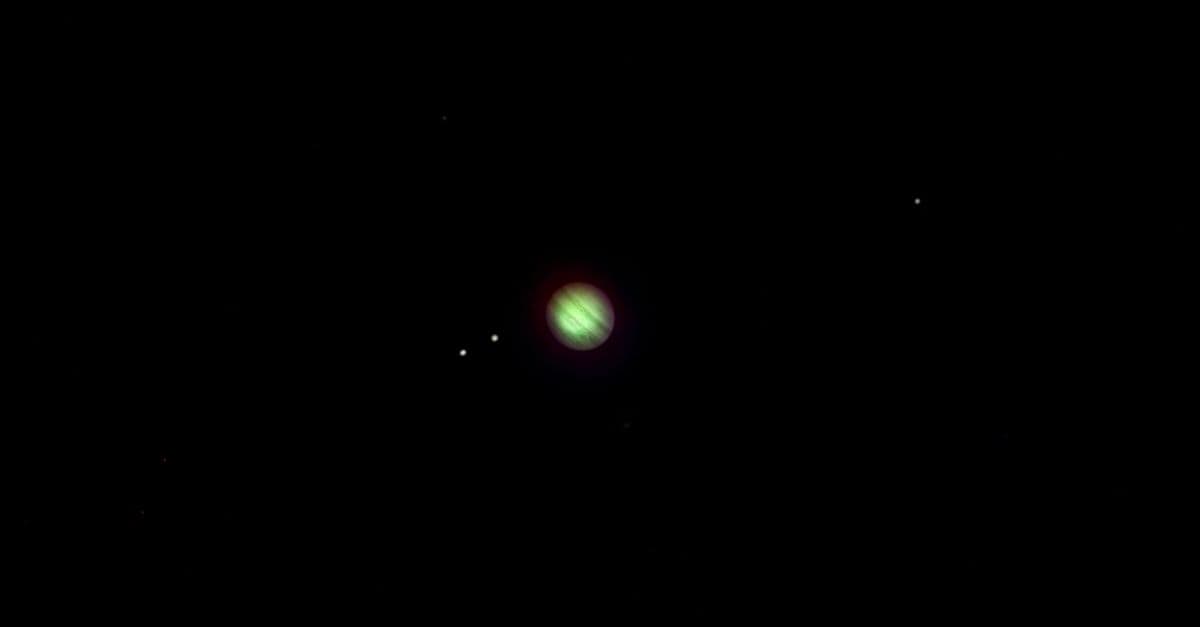
Jupiter's Great Red Spot is a storm larger than Earth that has raged for at least 350 years, but it has been shrinking dramatically — from 40,000 km wide in the 1800s to just 14,000 km today. Scientists are debating whether it is dying or simply transforming into something new.
Jupiter's Auroras: The Most Powerful Light Show in the Solar System
Jupiter's auroras are not scaled-up versions of Earth's. They are a fundamentally different phenomenon: driven not primarily by the solar wind but by the volcanic output of Io, a moon so geologically active it pumps a ton of sulfur dioxide per second into space. The resulting plasma torus is the actual engine of Jupiter's polar glow — producing auroral emissions roughly 1,000 times more energetic than anything Earth generates, visible in UV and X-ray from telescopes hundreds of millions of kilometers away.
Io Explained: Jupiter's Volcanic Moon and the Science of Tidal Heating
Io has more than 400 active volcanoes, mountains taller than Everest, lakes of molten sulfur, and a surface that repaints itself every few decades. It is the most volcanically active body in the solar system — and its power source is not radioactivity or solar heat, but the gravitational squeeze of Jupiter and its sibling moons.

The Voyager Grand Tour Explained
Voyager used rare planetary alignment, gravity assists, and durable engineering to transform knowledge of the outer Solar System.