Biggest Cities in the World by Population: City, Metro, and Urban Area
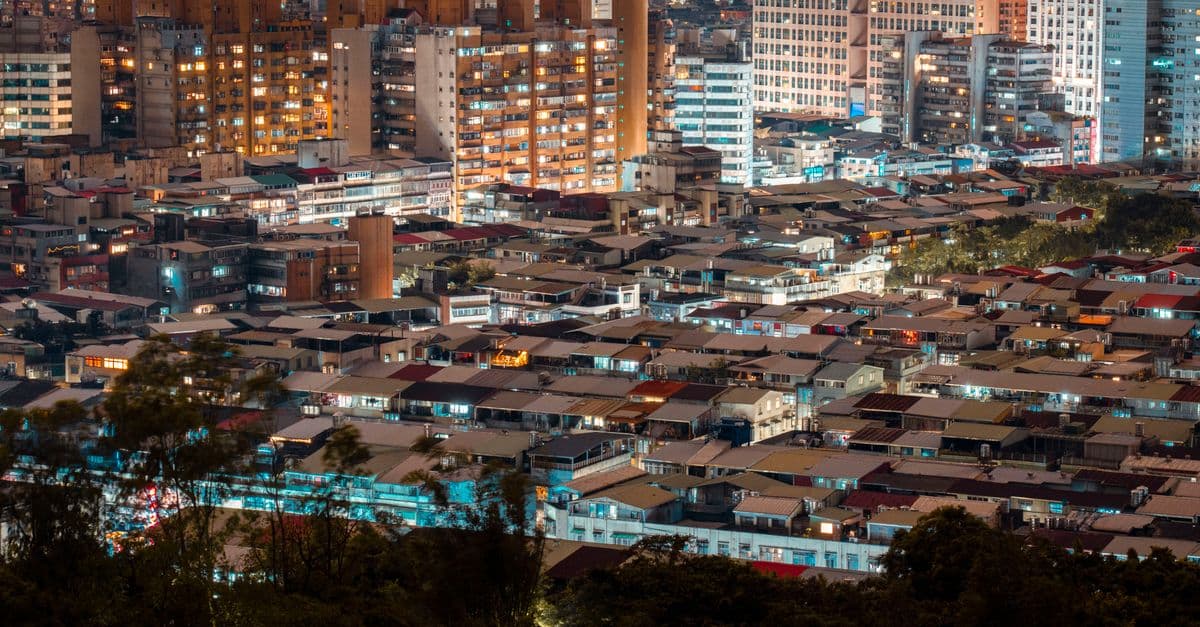
Photo: Jimmy Liao / Pexels
Ask which city is the biggest and you can get Jakarta, Tokyo, Chongqing, or Delhi, depending on who is counting and where they draw the line. Each answer can be correct, because "city" has no universal edge. This article lays out the three boundaries statisticians use, ranks the biggest cities under the most recent United Nations and national census figures, and shows where the numbers come from. By the end you should be able to look at any "world's biggest city" headline and tell what it actually measured.
Why "biggest city" doesn't have one answer
Asking for a city's population without naming a boundary is like asking how big a wildfire is without saying whether you mean the burned ground or the zone covered in smoke. Both are real, both are measurable, and they differ by orders of magnitude. A city is a legal and statistical construct laid over continuous human settlement, and countries draw that construct in very different ways.
Chongqing is the standard example. China's 2020 census counted 32,054,159 people in the Chongqing municipality, which covers about 82,000 square kilometers (31,700 square miles) of mostly mountainous and rural land, according to CityPopulation.de's compilation of the census results. The same compilation counts 9,580,819 people in the continuous urban area, which includes the Banan and Jiangbei districts. The municipality is about the size of Austria. Its urban core is about the size of a large metropolis, but not the largest.
That gap is not a rounding error. It is the whole story of why ranked lists disagree, and it is why serious demographic sources report several boundary types side by side instead of pretending that one number settles the question.
What is a city proper?
City proper, also called the municipal or administrative population, counts everyone living inside a city's official legal boundary. That line is drawn by a government for taxes, elections, and services, not to describe how people actually live. It ignores whether the land inside is dense apartment blocks or farmland, which is why Chongqing's figure looks so large next to its footprint.
What is an urban agglomeration?
An urban agglomeration is the continuous built-up area around a city, measured by how people and buildings are actually distributed on the ground, with no regard for municipal borders. If you could fly over the area and never leave the lit-up, built-up zone, you are still inside the same agglomeration. The UN's 2025 edition builds these from population grids, which the next section explains.
What is a metropolitan area?
A metropolitan area is the broadest boundary. It takes the urban core and adds the surrounding commuter belt, defined by economic ties, usually how many residents of outlying towns travel to the core for work. It can include farmland and open land between settlements. Japan's official Tokyo Metropolitan Area, covering four prefectures, is a metropolitan area in this sense.
The UN's 2025 ranking: what it measures
The United Nations Department of Economic and Social Affairs released the 2025 revision of World Urbanization Prospects on November 18, 2025. It changed how "city" is defined. For the first time the report uses the Degree of Urbanisation, a harmonized, grid-based method that classifies the same way in every country, instead of relying on each country's own definition of a city. According to the UN press release, the minimum city size dropped from 300,000 to 50,000 residents, which raised the number of cities analyzed to more than 12,000.
The practical effect was dramatic at the top. As reported by IFLScience, the switch to consistent criteria lifted Jakarta by about 30 million people compared with earlier criteria and moved Tokyo from first to third. Nothing happened to the people of either city. The ruler changed.
Table 1: The ten largest urban areas in the UN's 2025 World Urbanization Prospects.
| Rank | Urban area | Country | Population, 2025 | Source note |
|---|---|---|---|---|
| 1 | Jakarta | Indonesia | 41.9 million | Reported by Outlook Traveller; UN release says "nearly 42 million" |
| 2 | Dhaka | Bangladesh | 36.6 million | Outlook Traveller figure; the UN release says "almost 40 million" |
| 3 | Tokyo | Japan | 33.4 million | Outlook Traveller; UN release says 33 million |
| 4 | New Delhi | India | n/a | Rank per Outlook Traveller |
| 5 | Shanghai | China | n/a | Rank per Outlook Traveller |
| 6 | Guangzhou | China | n/a | Rank per Outlook Traveller |
| 7 | Cairo | Egypt | n/a | Only non-Asian city in the top ten, per the UN release |
| 8 | Manila | Philippines | n/a | Rank per Outlook Traveller |
| 9 | Kolkata | India | n/a | Rank per Outlook Traveller |
| 10 | Seoul | South Korea | n/a | Rank per Outlook Traveller |
The Dhaka row shows a problem every reader of population tables should know about. Two reputable outlets quoting the same report give 36.6 million and "almost 40 million." Press releases round and secondary tables truncate, and the full data tables in the UN Population Division's download center are the only place to settle it. For ranks four through ten, this article lists the order but not the figures ("n/a" in the table), because the published coverage does not state them.
How do you build a city from a grid?
The grid method is easier to picture than it sounds. Imagine laying a sheet of graph paper over a country, with each square covering one square kilometer. You count the residents in every square, then mark the squares that are dense enough to qualify as urban. Neighboring qualifying squares are merged into one cluster, and a cluster big enough, at least 50,000 people under the UN's threshold, counts as a city.
The result ignores every administrative line. If a city's lit-up built-up area spills across three provinces, the cluster still counts as one city. If a municipality includes 80 percent farmland, the farmland drops out. This is why the new ranking tracks how people actually live more closely than older tables did, and also why it can look odd next to a national census figure. Data for the grid comes mostly from census results and satellite mapping of settlements. The UN says 155 countries and areas contributed data from 2019 or later, much of it from the 2020 census round, as noted on the UN World Urbanization Prospects FAQ page.
What does the UN project for 2050?
The same report projects a reshuffled top ten. According to Databoks reporting on the UN projections, Dhaka would overtake Jakarta by 2050, and Tokyo would fall to seventh.
| Rank in 2050 | City | Projected population, 2050 |
|---|---|---|
| 1 | Dhaka | 52.1 million |
| 2 | Jakarta | 51.8 million |
| 3 | Shanghai | 34.9 million |
| 4 | New Delhi | 33.9 million |
| 5 | Karachi | 32.6 million |
| 6 | Cairo | 32.4 million |
| 7 | Tokyo | 30.7 million |
| 8 | Guangzhou | 29.2 million |
| 9 | Manila | 27.1 million |
| 10 | Kolkata | 23.8 million |
Source: UN DESA projections as reported by Databoks. Tokyo's projected 30.7 million would be about 2.7 million below its 2025 figure of 33.4 million, a decline of roughly 8 percent. Projections of this kind assume current fertility, migration, and urbanization trends continue, so treat them as scenarios rather than forecasts.
Ranking cities by administrative boundary
The older, simpler way to rank cities is to take each government's own count of people inside the city's legal limits. It produces a very different list, and it is the one most national statistics offices still publish.
Table 2: Large municipalities by national census count.
| City | Country | Municipal population | Census year | Urban-only population |
|---|---|---|---|---|
| Chongqing | China | 32,054,159 | 2020 | 9,580,819 |
| Shanghai | China | 24,870,895 | 2020 | 21,909,814 |
| Beijing | China | 21,893,095 | 2020 | not listed |
| Karachi | Pakistan | 18,868,021 (city, incl. cantonments) | 2023 | not listed |
| Tianjin | China | 13,866,009 | 2020 | not listed |
| Lahore | Pakistan | 13,004,135 (city, incl. cantonments) | 2023 | not listed |
Sources: CityPopulation.de, China cities (2020 census, municipality-level counts and urban population "counted on district or county level"); CityPopulation.de, Pakistan cities (2023 census, Pakistan Bureau of Statistics).
Two points stand out. First, Shanghai and Chongqing are both province-level municipalities, but they behave very differently. Shanghai's 21.9 million urban residents are about 88 percent of its 24.9 million municipal total, so the city proper and the real city are close. Chongqing's urban share is about 30 percent. Second, India is missing from the table for a reason, which the next section covers.
A worked example: Chongqing against Shanghai
Numbers make the boundary problem concrete. On municipal totals, Chongqing (32.05 million) is ahead of Shanghai (24.87 million) by about 29 percent. On continuous urban population, the order flips: Shanghai's 21.91 million is about 2.3 times Chongqing's 9.58 million. Same two cities, same census, same statistics bureau, and the lead changes hands depending on which column you read.
The reason is how each municipality was built. Shanghai's administrative limit hugs a large, dense, nearly continuous urban region, so the legal city and the real city almost coincide. Chongqing's limit was drawn in 1997, when it became a province-level municipality, around a vast interior region that includes counties and rural townships. It is a city on the organization chart and a region on the ground. That is no criticism of either place. It is simply a reminder that a municipal count describes a government, while an urban-area count describes a settlement.
The UN's grid approach is designed to sidestep this. A one-kilometer cell does not know which municipality it belongs to, so Chongqing's mountains contribute nothing to the "city" and Shanghai's suburbs contribute everything they hold. The method is not perfect, because it still depends on the quality of the underlying census, and in countries whose last count is old the inputs are partly projected. The UN says 155 countries and areas supplied data from 2019 or later for the 2025 edition, which narrows that problem without removing it.
Why India's cities are hard to compare
India's last full population census took place in 2011. The 2011 counts, compiled by CityPopulation.de, put the Mumbai urban agglomeration at 18,394,912, Delhi at 16,349,831, Kolkata at 14,057,991, and Bengaluru at 8,520,435. For Delhi, the compilation lists a separate figure of 16,787,941 for the whole Delhi territory, so "Delhi's population" can mean two different numbers from the same census.
A new census is under way. According to a press note from the Government of Goa on Census 2027, the houselisting phase began in April 2026 (April 16 to May 15 in Goa), and the population enumeration is scheduled for February 9 to 28, 2027, with a reference date of March 1, 2027. Until those results are published, any Indian city figure for 2025 is a projection from a count taken more than a decade earlier. A ranking that sets a freshly counted Pakistani city beside a rolled-forward Indian one is comparing numbers with very different confidence levels.
One city, three Tokyos
Tokyo is the cleanest illustration of why a single label hides several numbers. Japan's Statistics Bureau, in its 2020 census overview, reports three distinct Tokyo-shaped figures from the same count.
| Boundary | What it covers | 2020 census population |
|---|---|---|
| Ku-area (23 special wards) | The dense core, administered as ward governments | 9,733,276 |
| Tokyo-to (Tokyo Metropolis) | The 23 wards plus western cities, towns, and islands | 14,048 thousand |
| Tokyo Metropolitan Area | Tokyo-to plus Kanagawa, Saitama, and Chiba prefectures | 36,914 thousand |
The Metropolitan Area holds 29.3 percent of Japan's total population, in a country whose population of 126,146 thousand fell 0.7 percent between 2015 and 2020. Tokyo-to alone grew by 3.9 percent in that period, the fastest rate of any prefecture, even as 39 of Japan's 47 prefectures lost people. That is the pattern behind Tokyo's UN projection: a country shrinking overall can still concentrate people in its capital region for years before the capital region itself turns.
So when a headline says Tokyo has 37 million people, it is almost certainly using the four-prefecture Metropolitan Area (36.9 million in 2020). When another says 14 million, it means the Metropolis. When the UN says 33.4 million, it means the continuous built-up area measured on its grid. All three are accurate. They answer different questions.
Why the rankings keep shifting
Three forces move these lists year to year, and none of them require a single person to relocate.
Method changes. The 2025 UN revision is the clearest example. A method that applies the same grid-based rule everywhere removes country-specific quirks, but it also reorders the table. The earlier UN approach leaned heavily on each country's own city definitions, and the 2025 report dropped the minimum city size from 300,000 to 50,000.
Census timing. Countries count people on different schedules. China's census was in 2020, Pakistan's in 2023, Japan's in 2020, and India's last complete one was in 2011. A single ranked list usually blends fresh counts with projections, and the projection quality is not visible in the table. If you see two lists with different top cities, check which census each one used first.
Boundary changes. Cities annex neighboring districts, reclassify rural counties as urban districts, and merge. Any of those can raise a city-proper figure overnight without a single new resident. The UN's grid method is designed to be immune to this, which is one reason demographers favor it for international comparison.
Megacities, small cities, and the city that is shrinking
The UN defines a megacity as an urban area with 10 million or more people. According to the 2025 press release, the number of megacities quadrupled from 8 in 1975 to 33 in 2025. Nineteen of the 33 are in Asia, and the UN expects 37 by 2050, with Addis Ababa, Dar es Salaam, Hajipur, and Kuala Lumpur projected to pass 10 million.
The headline hides a bigger story. Cities now hold 45 percent of the world's 8.2 billion people, up from 20 percent of 2.5 billion in 1950. Yet of the more than 12,000 cities the UN analyzed, 96 percent have fewer than one million residents and 81 percent have fewer than 250,000. Small and medium cities house more people in total than megacities, and the UN says they are growing faster, especially in Africa and Asia.
Not every city grows. The UN notes that some cities shrink even while their countries grow, and that most shrinking cities had fewer than 250,000 inhabitants in 2025. More than one-third of them are in China and 17 percent in India. Mexico City and Chengdu have also lost people.
Why do megacities cluster in Asia and Africa?
The growth is where national populations are large and still moving from villages to towns. In several countries, one or two hubs absorb most of that migration, because investment in smaller regional cities lags. A country with many similarly sized regional cities, such as Germany, spreads the same growth across more places. For more on the national side of the picture, see our ranking of the most populous countries, and for the share of each country living in cities, the most urbanized countries.
What density reveals that raw population doesn't
A population total says how many people live somewhere. It says nothing about how closely they live. Picture 100 people in a ballroom, then the same 100 in an elevator. The headcount is identical, but the experience of the room is not.
The most striking example is Manila. The Philippine Statistics Authority's 2020 census counted 1,846,513 residents in the City of Manila. On the PSA's land area of 24.98 square kilometers, that comes to about 73,920 people per square kilometer, up from 71,263 in 2015. That is far denser than Tokyo-to, which holds 14.0 million people in a much larger area, and it is a reminder that a "small" city by population can be one of the most crowded places on Earth. Note also that Manila's figure is for the city proper only, a small administrative piece of a metro region that the UN ranks among the world's ten largest urban areas.
Density has practical consequences. Dense cities can run transit efficiently, since riders sit within walking distance of stations. They also strain housing, water, and drainage per hectare, and they trap heat. Why cities create heat islands covers that last effect. Tall buildings are one way dense cities add floor space without adding land, which is the subject of how skyscrapers are engineered. For a country-level view, see countries ranked by population density.
Common confusions in "biggest city" claims
Mixing a metro figure with a municipal government. Headlines cite "Tokyo, population 37 million" as though one mayor governs that many people. As the census table above shows, Tokyo-to has about 14 million residents and the 37 million figure covers four prefectures with separate governments.
Treating population rank as economic rank. A city's headcount and its economic output often diverge. Some of the world's largest metropolitan economies are not in the top ten by population. To compare national economies instead, see the largest economies by GDP.
Ignoring the date. A list published in 2022 and another in 2026 may use different UN editions, different census years, or different definitions. They can look contradictory while both were accurate for their time. The UN's 2025 revision is a good example of a list that cannot be compared with its predecessor row by row.
Assuming a larger population means a larger footprint. Population and land area do not scale together, as the Manila figure shows. Always check whether an "urban area" figure for a Chinese or Indian city includes neighboring cities.
Forgetting that growth and decline can happen together. A country can shrink while its capital grows, and the reverse. Japan is the standing example. Its population fell 0.7 percent between the 2015 and 2020 censuses while Tokyo-to grew 3.9 percent. For a look at what shrinking and aging populations mean at national scale, see countries with the oldest populations and how demographics will reshape the global economy.
A short checklist for reading any city ranking
If you only remember one section of this article, make it this one. Before trusting any list, ask the following.
| Question | Why it matters |
|---|---|
| What boundary was used? | Municipal, built-up, and metro figures for one city can differ by a factor of three or more |
| What year is the count from? | Censuses are years apart, and projections can be a decade stale |
| Who made the list? | National statistics offices, the UN, and private data firms use different rules |
| Does the table say what it counts? | Good tables name the definition; weak ones just print a number |
| Are the cities compared on the same basis? | A city proper beside an agglomeration is not a fair comparison |
Satellites also play a growing role in these counts, mapping settlement footprints that census takers can miss. Our explainer on how satellites orbit Earth covers the platforms behind that imagery.
Frequently Asked Questions
Q: What is the world's biggest city in 2025? A: By the UN's 2025 grid-based method, Jakarta, with about 41.9 million people. By administrative boundary, Chongqing, whose municipality counted 32.1 million in China's 2020 census, though only about 9.6 million of them lived in its urban area. The UN counts Jakarta as the largest city, not Chongqing, because it measures the built-up area rather than the legal boundary.
Q: Why did Tokyo fall from first to third? A: The UN changed its method in the 2025 World Urbanization Prospects, replacing country-specific city definitions with one grid-based definition applied everywhere. Under it Tokyo has about 33.4 million people, behind Jakarta and Dhaka. Tokyo's own population did not collapse. In Japan's 2020 census the Tokyo Metropolitan Area counted 36.9 million, still the most populous region in the country.
Q: Is Chongqing really the world's biggest city? A: Only by legal boundary. Its municipality spans roughly 82,000 square kilometers (31,700 square miles) and counted 32,054,159 people in 2020, but the continuous urban area counted 9,580,819. Most demographers would not call it the world's biggest city in the everyday sense of a single connected urban place.
Q: What counts as a megacity? A: An urban area with 10 million or more inhabitants. The UN says there were 8 in 1975 and 33 in 2025, 19 of them in Asia, and projects 37 by 2050. Because the count depends on how city boundaries are drawn, the exact number differs between UN editions and between organizations.
Q: Which major city is the most densely packed? A: Among large cities, the City of Manila is a leading example. The Philippine Statistics Authority's 2020 census recorded 1,846,513 residents, about 73,920 per square kilometer on a land area of 24.98 square kilometers. Density comparisons depend on boundary choices, so a different definition of Manila, or of another city, can change the ranking.
Q: Will Dhaka overtake Jakarta? A: The UN projects it will. In the 2025 revision, as reported by Databoks, Dhaka is projected to reach 52.1 million by 2050 against 51.8 million for Jakarta. Projections assume current trends in fertility, migration, and urban growth continue, so the order could change if those trends do.
Q: Why are India's city populations so uncertain? A: India's last complete census was in 2011, so recent figures are projections. The next census is scheduled for population enumeration in February 2027, with a reference date of March 1, 2027. Until results are published, a 2025 Indian city figure rests on a count taken 14 years earlier.
The takeaway
The question of which city is biggest has a stable answer only after you fix what a city is. In the UN's 2025 grid-based count, Jakarta, Dhaka, and Tokyo lead. By legal boundary, a mostly rural Chinese municipality leads. In Japan's own census, the same Tokyo appears as 9.7 million, 14.0 million, or 36.9 million depending on the line. Every number is correct for what it measures. The real mistake is comparing a municipal figure to an agglomeration figure as if they were measured on the same scale, and the practical fix is to ask what boundary, what year, and what source before trusting any list.
Read next:
- The Largest Structures Ever Built
- The Fastest Man-Made Objects Ever Built
- Countries with the Most Data Centers
Sources
- UN DESA, "Cities are home to 45 per cent of the global population, with megacities continuing to grow" (World Urbanization Prospects 2025 press release, November 18, 2025)
- UN Population Division, World Urbanization Prospects FAQ
- Statistics Bureau of Japan, Population and Households of Japan 2020 (2020 Census overview)
- CityPopulation.de, Chongqing (2020 census, National Bureau of Statistics of China)
- CityPopulation.de, China: cities and municipalities
- CityPopulation.de, Pakistan: cities (2023 census)
- CityPopulation.de, India: cities (2011 census)
- Government of Goa, press note on Census of India 2027 (March 31, 2026)
- IFLScience, "Why Tokyo is no longer the world's most populous city, according to the UN"
- Outlook Traveller, "Jakarta surpasses Tokyo to become the world's largest city: UN report"
- Databoks, "UN projects 10 most populous cities in the world by 2050"
- Philippine Statistics Authority, 2020 Census of Population and Housing results for the City of Manila
Follow new articles
Add SciHub101 to your feed reader to see new science and technology stories.
About the Author
SciHub101 is an independent science and technology publication founded and edited by Buğra Sözeri, a software engineer and app developer based in Türkiye. AI tools assist with drafting and research. Source documentation in the existing archive is uneven, and articles are being reviewed and corrected. The Editorial Team byline identifies editorial responsibility; it does not certify specialist or independent human review. Where we compare products, anything built by our own team is labelled as such — see the editorial guidelines and About page for how corrections and disclosures work.
Related Articles
Biggest Hydrogen Projects in the World
NEOM's $8.4B plant leads a wave of gigawatt-scale hydrogen projects reshaping fertilizer, steel, and shipping. Here's how the biggest ones actually work.



Most Visited Tourist Attractions in the World
The world's most visited places are not always the most famous monuments. This guide separates paid attractions, public spaces, parks, and pilgrimage sites.
The Largest Countries in the World: Russia Spans Eleven Time Zones
Russia is so large that when the sun rises over its Pacific coast, much of the country is still in the previous day. At about 17 million square kilometres it covers more than an eighth of all the land on Earth — bigger than the surface of Pluto — and stretches across eleven time zones. The ranking of the world's biggest countries is a story of empires, frozen frontiers, and a map projection that quietly lies about who's really biggest.

The Longest Mountain Ranges in the World: The 65,000-Kilometre Range You'll Never See
The Andes stretch 7,000 kilometres down the spine of South America — the longest mountain range on land, and a wall so high it creates deserts on one side and rainforests on the other. But it's not even close to the longest range on the planet. That title belongs to a mountain chain ten times longer, winding 65,000 kilometres around the globe entirely beneath the oceans, where most of Earth's volcanic activity quietly happens.