How Scientists Predict Volcanic Eruptions
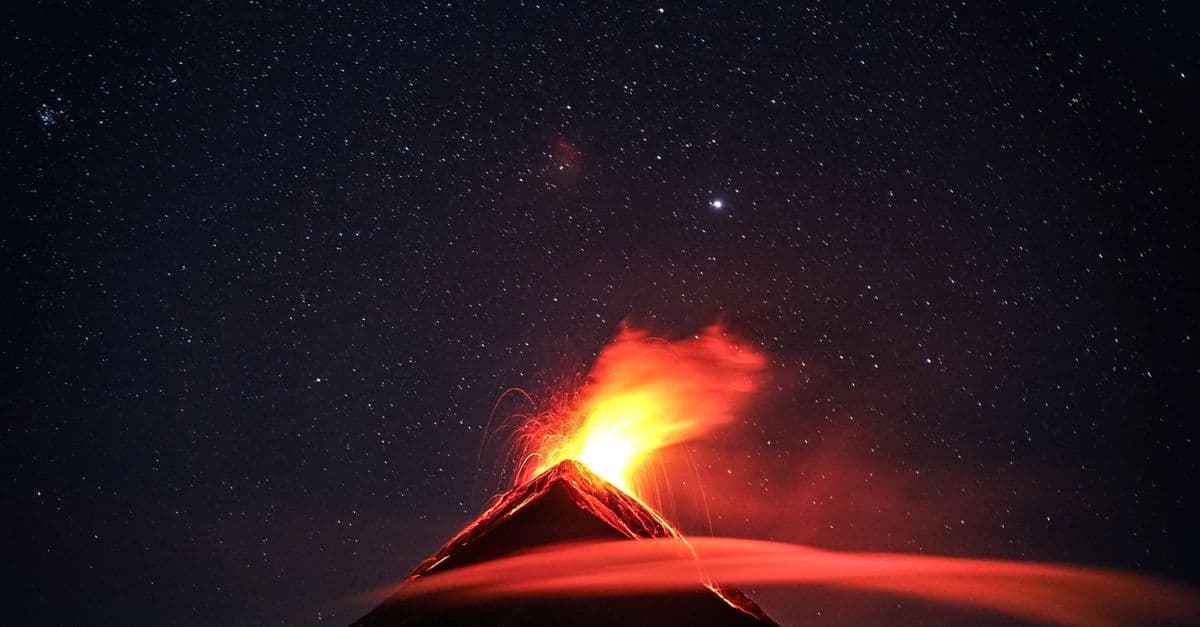
Photo: Clive Kim / Pexels
Volcanologists cannot name the day an eruption will happen, but they can often tell you a volcano is waking up weeks or months in advance. The method rests on five converging signals: earthquake swarms, ground deformation, gas chemistry, heat output, and each volcano's documented eruptive history. When the U.S. Geological Survey's Volcano Disaster Assistance Program (VDAP) helped forecast the 1991 Mount Pinatubo eruption in the Philippines, that combination of evidence gave officials enough warning to evacuate roughly 60,000 people before the second-largest eruption of the 20th century (USGS, 2021). This guide breaks down exactly what each signal measures, why no single one is proof on its own, and where the science still runs into hard limits.
Why volcanoes give warning signs at all
A volcano does not erupt from a calm, static state. Magma — molten and semi-molten rock stored beneath the surface — has to physically move, and moving rock disturbs everything around it. As magma rises through the crust, it cracks solid rock, displaces groundwater, releases dissolved gases, and heats the surrounding material. Every one of those disturbances leaves a measurable trace, which is why monitoring networks exist in the first place.
Think of a volcano's plumbing system like a soda bottle you've just shaken. The pressure buildup doesn't happen instantly; gas bubbles nucleate, the cap bulges microscopically, and if you had sensitive enough instruments you could detect the change before the cap ever pops. A volcano works on a much slower timescale, but the physics is analogous: pressurized fluid pushing toward a weak point, telegraphing its intentions through the surrounding rock.
The Smithsonian Institution's Global Volcanism Program catalogs more than 1,300 volcanoes considered active in the last 10,000 years (Smithsonian Global Volcanism Program, 2023). Of those, only a small fraction are monitored closely enough to generate real-time forecasts, which is itself one of the central limitations of the field — you can only forecast what you're watching.
Volcanic unrest — a phase of measurable seismic, geochemical, or deformation activity that may or may not culminate in an eruption — is the technical term scientists use before they'll commit to the word "eruption is likely." Unrest can last days, or it can drag on for years and fizzle out with no eruption at all, which is exactly why forecasting is treated as a probability exercise, not a countdown clock.
Reading the ground: seismology and deformation
Seismic monitoring is the oldest and most reliable piece of the eruption-forecasting toolkit. As magma forces its way through cracks in the crust, it generates two broad categories of earthquakes that seismologists distinguish on a seismogram: volcano-tectonic (VT) earthquakes, caused by rock fracturing under stress, and long-period (LP) events, caused by the resonance of fluid — magma, gas, or hydrothermal water — moving through cracks and conduits.
A rising swarm of VT earthquakes, especially one that migrates upward and shallower over days or weeks, is one of the most consistent precursors volcanologists track. At Mount St. Helens in 1980, seismic swarms began more than two months before the catastrophic May 18 eruption, giving the USGS enough confidence to warn officials and restrict access around the mountain, a decision credited with limiting the death toll (USGS Cascades Volcano Observatory, 2020). Fifty-seven people still died, almost all of them inside or near the restricted zone, which underscores a persistent problem: warnings only save lives if the hazard zone is drawn correctly and people respect it.
How GPS and InSAR detect a swelling volcano
Ground deformation — physical swelling, tilting, or subsidence of a volcano's surface as magma or gas accumulates beneath it — is measured two ways. Continuous GPS stations bolted to bedrock around a volcano can detect millimeter-scale horizontal and vertical movement in near real time. Satellite radar interferometry, known as InSAR (Interferometric Synthetic Aperture Radar), compares two radar images of the same ground taken from orbit at different times and reveals the deformation pattern across the entire edifice, not just at fixed points.
Before Kilauea's 2018 lower East Rift Zone eruption in Hawai'i, the Hawaiian Volcano Observatory tracked a rising lava lake, ground inflation at the summit, and a swarm of earthquakes migrating downrift over about a week, all of which fed into the evacuation order for the Leilani Estates subdivision before fissures opened in people's backyards (USGS, 2018). The summit caldera later collapsed in a series of stepwise failures through the following two months, an event thoroughly documented because the monitoring network happened to be one of the densest in the world.
Sniffing gas: the chemistry of an awakening volcano
Magma carries dissolved gases the same way a sealed soda carries dissolved carbon dioxide. As magma rises and pressure drops, those gases come out of solution and vent to the surface well before the rock itself breaks through — which is why gas monitoring can sometimes provide earlier warning than seismicity alone.
Sulfur dioxide (SO₂) is the gas volcanologists watch most closely because it is chemically distinct from background atmospheric gases and relatively easy to measure from a distance. VDAP scientists and partner observatories deploy scanning ultraviolet spectrometers and truck-mounted or drone-mounted instruments to quantify SO₂ output in tonnes per day, along with fixed Multi-GAS sensor stations that continuously measure the ratio of SO₂ to carbon dioxide (CO₂) at a vent (USGS Volcano Disaster Assistance Program, 2023). A rising CO₂-to-SO₂ ratio can indicate that fresh, gas-rich magma is arriving from depth, since CO₂ separates from magma earlier and at greater depth than sulfur compounds do.
NASA and the Smithsonian jointly maintain a satellite-based SO₂ tracking effort, because instruments aboard polar-orbiting satellites can detect volcanic sulfur plumes from space even at volcanoes with no ground-based sensors, which matters enormously in remote regions like Indonesia's outer islands or the Kamchatka Peninsula (NASA Goddard Space Flight Center, 2022). This satellite layer effectively extends monitoring coverage to volcanoes that would otherwise be watched only sporadically, though it can't substitute for the resolution of ground instruments.
Heat, thermal imaging, and satellite hotspot detection
A rising body of magma warms the rock and groundwater above it long before any eruption. Thermal cameras positioned around a crater rim can track subtle temperature increases in fumaroles (steam and gas vents) and in the crater floor itself, while satellite-based thermal sensors scan for hotspots — anomalously warm pixels — across remote volcanic regions daily.
The Middle Infrared Observation of Volcanic Activity (MIROVA) system, developed by researchers at the University of Turin and University of Florence, processes data from NASA's MODIS satellite instruments to flag thermal anomalies at volcanoes worldwide, often the first sign that a lava dome is growing or that lava has reached the surface at a remote site with no ground sensors (Coppola et al., 2016, published in the Journal of Volcanology and Geothermal Research). This kind of remote sensing has become indispensable for tracking volcanoes in places like the Aleutian Islands or the Democratic Republic of the Congo, where ground infrastructure is sparse or access is dangerous.
Thermal signals are useful but imperfect. Weather can obscure satellite views, and a genuinely rising heat signature sometimes reflects a stalled intrusion of magma that never reaches the surface. Like the other four monitoring streams, heat data is treated as one vote among several, never the sole basis for a public warning.
Reading the past: eruptive history and hazard maps
Instruments only tell part of the story. A volcano's own geological record — the layers of ash, pumice, and lava it has deposited over thousands of years — tells scientists what kind of eruption is physically possible at that specific site, which is information no amount of real-time monitoring can substitute for. Geologists map these deposits, date them using radiocarbon and other techniques, and build a hazard map: a document showing which valleys, slopes, and communities lie in the path of lahars (volcanic mudflows), pyroclastic flows, or ashfall based on what has actually happened there before.
This is why Nevado del Ruiz in Colombia is treated with such caution despite years of quiet: its 1985 eruption, discussed in detail in SciHub101's overview of the deadliest volcanoes in history, triggered lahars that killed more than 23,000 people in the town of Armero even though the eruption itself was moderate in size. The disaster happened because meltwater from the volcano's ice cap mixed with ash to create fast-moving mudflows that the hazard maps had already predicted almost exactly, yet evacuation orders were delayed. It remains the textbook case for why forecasting has to be paired with fast, trusted communication to actually save lives.
Understanding why a given volcano erupts the way it does also depends on its underlying plumbing and magma chemistry, covered in SciHub101's explainer on why volcanoes erupt. A volcano fed by thick, gas-rich silicic magma, like Pinatubo or Mount St. Helens, tends toward explosive eruptions, while one fed by fluid basaltic magma, like Kilauea, more often produces effusive lava flows. That distinction shapes both the monitoring priorities and the hazard-map contents for each site.
What the USGS Volcano Alert Level system actually communicates
The USGS uses a four-tier system — Normal, Advisory, Watch, Warning — paired with a color code (Green, Yellow, Orange, Red) to translate monitoring data into a single public-facing signal. "Watch" means a volcano is showing heightened unrest with an increased potential for eruption, while "Warning" means an eruption is underway or imminent with significant hazard to life (USGS Volcano Notification Service, 2023). The system exists precisely because raw seismic and gas data isn't usable by emergency managers without a simplified, standardized layer on top.
From signals to forecasts: how scientists combine the data
No individual dataset triggers an evacuation on its own. Volcano observatories run multidisciplinary teams that overlay seismic swarms, deformation curves, gas ratios, and thermal anomalies onto a shared timeline, looking for convergence — multiple independent lines of evidence pointing the same direction at the same time. That convergence is what separates a confident forecast from a guess.
The clearest historical proof of the method came from Pinatubo in 1991. USGS volcanologist Chris Newhall and Philippine Institute of Volcanology and Seismology (PHIVOLCS) scientists tracked an accelerating swarm of earthquakes, rapidly increasing SO₂ output, and ground bulging over roughly two months before the climactic eruption on June 15, 1991 (Newhall and Punongbayan, 1996, Fire and Mud: Eruptions and Lahars of Mount Pinatubo). Officials staged evacuations in expanding radii as each signal strengthened. The eruption still killed several hundred people, mostly from roof collapses under ash weighed down by a simultaneous typhoon, but the death toll would almost certainly have run into the tens of thousands without the forecast-driven evacuations.
Statistical and physical models increasingly support the human judgment calls. Some observatories use pattern-recognition algorithms trained on decades of past unrest episodes at a given volcano to estimate the probability that a specific combination of signals precedes an eruption within a given time window, an approach documented in USGS Volcano Hazards Program methodology papers. These models supplement, but do not replace, the judgment of experienced volcanologists reading raw data in real time.
Where prediction still fails
Volcanology's honest answer to "can you predict an eruption" is: sometimes, with weeks of warning, and sometimes not at all. Several categories of failure recur across the historical record.
- Silent magma. Some eruptions, particularly at basaltic volcanoes with very fluid magma, can go from first detectable unrest to eruption in hours rather than weeks, leaving little time to act. The 2021 Cumbre Vieja eruption on La Palma in the Canary Islands began with a seismic swarm that intensified sharply only about a week before the eruption started (Instituto Geográfico Nacional, Spain, 2021).
- False positives. Volcanoes routinely show unrest — earthquake swarms, minor gas increases — that never culminates in an eruption. Long Valley Caldera in California and Yellowstone have both experienced multi-year episodes of ground uplift and seismicity without erupting, and the USGS explicitly cautions that unrest is not the same as an imminent eruption (USGS Yellowstone Volcano Observatory, 2022).
- Phreatic eruptions. Steam-driven explosions caused by superheated groundwater flashing to vapor, rather than fresh magma reaching the surface, can occur with almost no precursory signal because no new magma is actually moving. Japan's Mount Ontake erupted this way in September 2014, killing 63 people, most of them hikers, with only a few minutes of detectable seismicity beforehand (Japan Meteorological Agency; Sano et al., 2015, Scientific Reports).
- Underinstrumented volcanoes. The vast majority of the world's roughly 1,300 potentially active volcanoes lack the dense seismic and GPS networks that made Pinatubo, Kilauea, and Mount St. Helens forecasting successes. Remote volcanoes in Indonesia, the Andes, and parts of Africa are monitored mainly by satellite, which detects large signals but misses subtler precursors.
Communication failure is arguably as large a limiting factor as instrumentation. The 1985 Nevado del Ruiz disaster is repeatedly cited in hazard-planning literature not because the science failed, but because hazard maps existed and were largely ignored by local authorities in the days before the eruption (Voight, 1990, Journal of Volcanology and Geothermal Research). A correct forecast that never reaches the people at risk saves nobody.
Table: the five monitoring signals and what they reveal
| Signal type | What it measures | Typical lead time | Best-known example |
|---|---|---|---|
| Seismicity (VT and LP earthquakes) | Rock fracturing and fluid movement underground | Days to months | Mount St. Helens, 1980 |
| Ground deformation (GPS, InSAR) | Swelling or subsidence as magma/gas accumulates | Weeks to months | Kilauea lower East Rift Zone, 2018 |
| Gas emissions (SO₂, CO₂ ratios) | Degassing of rising magma | Days to weeks | Mount Pinatubo, 1991 |
| Thermal anomalies (ground and satellite) | Heating of crater floor, domes, and fumaroles | Days to weeks | MIROVA-detected lava dome growth, various sites |
| Eruptive history and hazard mapping | What the volcano has physically done before | N/A (context, not real-time) | Nevado del Ruiz, 1985 |
No single row in this table is sufficient on its own — observatories issue forecasts when multiple rows move in the same direction at once.
What people get wrong about volcano prediction
The most common misconception is that volcanology works like an earthquake countdown clock, ticking toward a specific date and time. It doesn't, and no credible volcanologist frames it that way. What observatories actually produce is a probability, tied to a monitoring window, built on converging evidence — closer to a hurricane forecast cone than a scheduled event.
A second misconception treats "no eruption yet" as proof the warning was wrong. Long Valley Caldera and Yellowstone have both shown years of unrest with no eruption, and that outcome is itself useful data, not a failure of the system. Observatories would rather issue an advisory that turns out to be cautious than stay silent through a genuine crisis.
A third misconception assumes every volcano gets the Pinatubo-level treatment. In reality, monitoring density varies enormously by country, funding, and political stability. A volcano in the Cascades or Hawai'i benefits from decades of continuous USGS instrumentation; a comparably dangerous volcano in a lower-income country may have a single seismometer, if that. Global eruption forecasting is only as good as the weakest-monitored volcano in a densely populated region, which is precisely the gap VDAP was created to close through international training and rapid-deployment monitoring kits.
The takeaway
Volcano prediction works, but it works as probabilistic hazard assessment built from converging evidence, not as a precise countdown. Seismicity, ground deformation, gas chemistry, thermal signals, and a volcano's own eruptive history each catch a different physical symptom of rising magma, and observatories trust a forecast only when several of those signals move together. Pinatubo in 1991 shows how effective that combination can be when the monitoring network and the evacuation response both work; Nevado del Ruiz in 1985 shows how a correct scientific forecast can still fail if it never reaches the people at risk. The science has genuinely improved since the 1980s, but the limiting factor today is as much about instrumentation coverage and public communication as it is about geophysics.
Read next:
- Why Volcanoes Erupt
- The Deadliest Volcanoes in History
- How Climate Change Is Affecting Your Daily Life
Frequently Asked Questions
Q: Can scientists predict the exact date of a volcanic eruption? A: No. Scientists forecast probabilities over a time window, such as weeks, based on converging seismic, gas, deformation, and thermal signals. Precise date prediction isn't possible with current science because the exact moment magma breaches the surface depends on factors that aren't fully observable in real time.
Q: What is the most reliable early warning sign of an eruption? A: No single sign is reliable alone, but an accelerating swarm of shallow volcano-tectonic earthquakes combined with rising sulfur dioxide emissions and ground deformation is the strongest known combination, as demonstrated before the 1991 Mount Pinatubo eruption and the 1980 Mount St. Helens eruption.
Q: Why did some eruptions happen with almost no warning? A: Phreatic (steam-driven) eruptions, like Japan's 2014 Mount Ontake disaster, occur when superheated groundwater flashes to steam without fresh magma reaching the surface, producing minimal precursory seismicity. Very fluid basaltic magma can also rise unusually fast, shortening the warning window to days.
Q: What does the USGS Volcano Alert Level system mean? A: It's a four-tier public communication scale — Normal, Advisory, Watch, and Warning — that translates raw monitoring data into a single, standardized signal for emergency managers and the public, with Warning indicating an eruption is underway or imminent.
Q: How many volcanoes are actively monitored worldwide? A: The Smithsonian Global Volcanism Program lists more than 1,300 volcanoes as active within the last 10,000 years, but only a few hundred carry dense, real-time ground monitoring networks; many others rely primarily on satellite-based thermal and gas detection.
Sources
- USGS Volcano Hazards Program and Volcano Disaster Assistance Program (VDAP) — monitoring methods, alert levels, and historical case studies.
- Smithsonian Institution Global Volcanism Program — global eruptive history database.
- Newhall, C. and Punongbayan, R., eds. (1996). Fire and Mud: Eruptions and Lahars of Mount Pinatubo, Philippines. PHIVOLCS and University of Washington Press.
- Coppola, D. et al. (2016). "Thermal Remote Sensing for Global Volcano Monitoring: The MIROVA System." Journal of Volcanology and Geothermal Research.
- Voight, B. (1990). "The 1985 Nevado del Ruiz Volcano Catastrophe: Anatomy and Retrospection." Journal of Volcanology and Geothermal Research.
- Sano, Y. et al. (2015). "Ten-Year Helium Anomaly Prior to the 2014 Mt Ontake Eruption." Scientific Reports.
- NASA Goddard Space Flight Center — satellite SO₂ plume detection.
Follow new articles
Add SciHub101 to your feed reader to see new science and technology stories.
About the Author
SciHub101 is an independent science and technology publication founded and edited by Buğra Sözeri, a software engineer and app developer based in Türkiye. AI tools assist with drafting and research. Source documentation in the existing archive is uneven, and articles are being reviewed and corrected. The Editorial Team byline identifies editorial responsibility; it does not certify specialist or independent human review. Where we compare products, anything built by our own team is labelled as such — see the editorial guidelines and About page for how corrections and disclosures work.
Related Articles

Why the Ocean Is Still Mostly Unexplored
Less than 0.001% of the deep ocean floor has been visually surveyed. Here's why sonar, pressure, and cost keep most of the seafloor a mystery.
How Scientists Measure the Age of Earth
Earth's age is not guessed from one rock. This guide explains radiometric dating, meteorites, zircon crystals, half-lives, and why 4.54 billion years is robust.
How Volcanoes Work — Magma to Eruption
Where magma comes from, why volcanoes form at plate boundaries and hotspots, eruption types, the VEI scale, and how scientists monitor them.
How Volcanoes Work: The Science of Earth's Most Powerful Force
A single eruption can cool the entire planet for years. Here's the science behind what makes volcanoes tick — from deep magma to explosive blasts.
Plate Tectonics Explained — How and Why Earth's Crust Moves
Plate tectonics explained: how Earth's rigid plates move, what drives them, what happens at their boundaries, and the evidence that settled the debate.