Types of Stars — Stellar Classification Explained
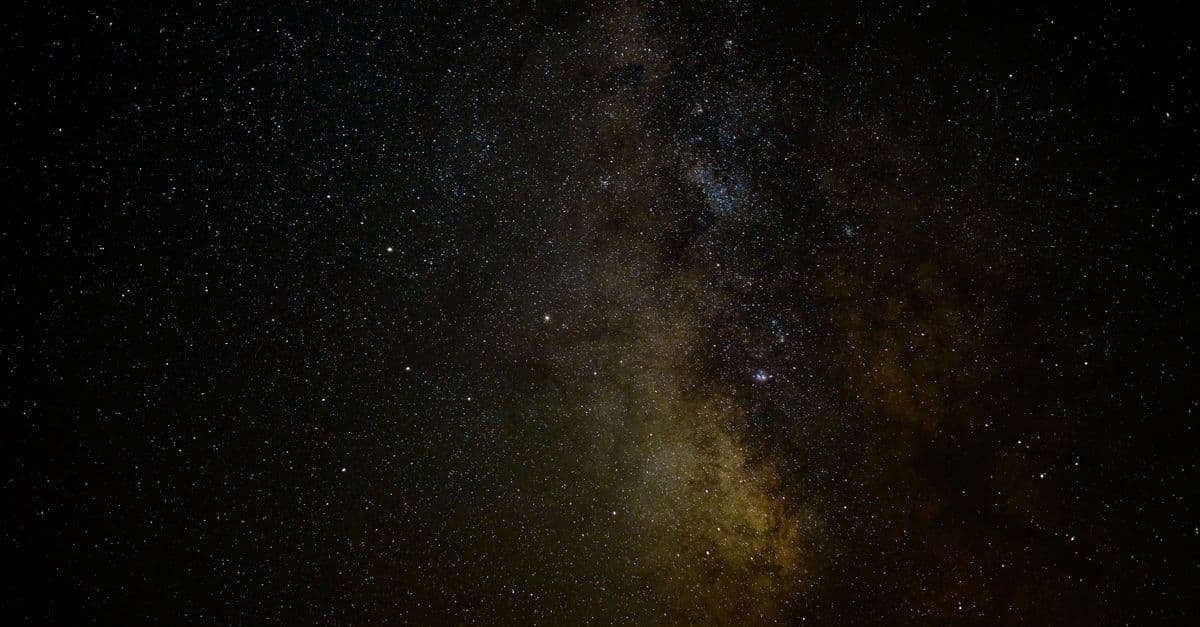
Photo: Brett Sayles / Pexels
Look up at a clear night sky and almost everything you see is a star — but they're not all alike. Some are blue-white furnaces 100 times the Sun's mass, burning so hot they tear themselves apart in a few million years. Others are dim red embers so faint that the nearest one to us, Proxima Centauri, can't be seen without a telescope despite being just 4.2 light-years away. Astronomers organize this zoo using two main tools: spectral classification and the Hertzsprung-Russell diagram.
Spectral Classification: OBAFGKM
When you spread starlight through a prism or grating, dark absorption lines appear at specific wavelengths. Those lines reveal which elements are absorbing light in the star's outer layers — and how hot it is. In the early 1900s, Annie Jump Cannon and her colleagues at Harvard cataloged hundreds of thousands of stars and developed the classification system we still use, ordered by temperature:
- O — Hottest, blue. Surface temperatures 30,000–50,000 K. Massive, luminous, rare, short-lived.
- B — Blue-white. 10,000–30,000 K. Examples: Rigel, Spica.
- A — White. 7,500–10,000 K. Examples: Sirius, Vega.
- F — Yellow-white. 6,000–7,500 K. Examples: Procyon, Polaris.
- G — Yellow. 5,200–6,000 K. The Sun is here.
- K — Orange. 3,700–5,200 K. Examples: Arcturus, Aldebaran.
- M — Coolest, red. 2,400–3,700 K. Most numerous in the galaxy. Example: Proxima Centauri.
Generations of astronomy students have memorized the order with the mnemonic "Oh Be A Fine Girl/Guy, Kiss Me."
Each class is subdivided 0–9 (hotter to cooler within the class), so the Sun is more precisely a G2. A luminosity class is also added — Roman numerals from I (supergiants) through V (main-sequence dwarfs) — making the Sun a G2V.
Two more classes — L and T — were added later for objects cooler than M, mostly brown dwarfs, with Y for the very coldest.
The Hertzsprung-Russell Diagram
Around 1910, Ejnar Hertzsprung and Henry Norris Russell independently plotted stars on a chart with temperature on the x-axis (decreasing left to right) and luminosity on the y-axis (increasing upward). Instead of scattering randomly, the points fell into well-defined bands. The H-R diagram is the single most important chart in stellar astronomy.
The main features:
- Main sequence — a diagonal band running from hot/luminous (upper left) to cool/faint (lower right). About 90% of stars at any moment, including the Sun, live here. This is where stars fuse hydrogen into helium in their cores. A star's position on the main sequence is set almost entirely by its mass.
- Giants — bright but relatively cool stars in the upper right. Stars that have exhausted core hydrogen and expanded.
- Supergiants — the largest, brightest stars, stretched across the top of the diagram. Examples: Betelgeuse, Antares, Rigel.
- White dwarfs — hot but very faint, in the lower left. Earth-sized stellar remnants.
The Sun: A G2V Yellow Dwarf
The Sun, despite its central role in our lives, is unremarkable as stars go. It's a middle-of-the-pack main-sequence G-type star, about 4.6 billion years old, with another ~5 billion years left on the main sequence. It will eventually swell into a red giant, shed its outer layers as a planetary nebula, and end as a slowly cooling white dwarf — the fate of roughly 97% of stars.
Stellar Mass Decides Everything
The single most important property of a star is its mass. Mass determines luminosity, temperature, lifespan, and final fate.
- Low mass (< 0.5 solar masses, M-type red dwarfs): fuse hydrogen extremely slowly. Lifespans of trillions of years — longer than the current age of the universe. They never reach the conditions needed for helium fusion and slowly fade into helium white dwarfs.
- Sun-like (0.5–8 solar masses): burn for billions of years, expand into red giants, shed outer layers, become carbon-oxygen white dwarfs.
- Massive (8–25 solar masses): burn through hydrogen in only millions of years, fuse heavier elements up to iron, then collapse in a core-collapse supernova, leaving a neutron star.
- Very massive (> 25 solar masses): end as supernovae but with cores too massive for neutron degeneracy pressure to support — they collapse into black holes, as covered in our piece on what black holes really are.
Exotic Stellar Endpoints
Red giants and supergiants form when core hydrogen runs out and fusion moves to a shell around an inert helium core. The star's envelope expands enormously while the surface cools. Betelgeuse is so large that if placed at the Sun's location, it would engulf the orbit of Jupiter.
Wolf-Rayet stars are extremely massive, evolved stars that have shed their hydrogen envelopes, exposing layers rich in helium, nitrogen, or carbon. They have ferocious stellar winds — losing more mass in a year than the Sun does in a million.
White dwarfs are the cooling carbon-oxygen cores left behind by sun-like stars. They pack roughly the Sun's mass into an Earth-sized sphere. A teaspoon of white-dwarf material weighs about a ton.
Neutron stars are even denser — a few solar masses crammed into a sphere about 20 km across, supported by neutron degeneracy pressure. Rapidly rotating, magnetized neutron stars sweep beams of radiation across the sky as pulsars, discovered by Jocelyn Bell Burnell in 1967.
Brown dwarfs are "failed stars" with 13–80 Jupiter masses, large enough to fuse deuterium briefly but not regular hydrogen. They span spectral classes L, T, and Y.
Stellar Fusion and the Mass-Luminosity Relation
The life and death of every star is determined by how fast it burns hydrogen in its core. A star's mass governs its fusion rate through a brutal physics principle: higher mass means higher core pressure and temperature, triggering faster fusion. This relationship is quantified by the mass-luminosity relation:
L ∝ M^3.5 (approximately)
A star twice the Sun's mass is roughly 11 times more luminous. A star half the Sun's mass is only ~0.03 times as luminous. This explains why massive stars are bright but short-lived, while low-mass stars are dim but long-lived.
Core fusion mechanisms vary with mass:
- Below 1.3 solar masses (PP chain): Hydrogen fuses to helium via the proton-proton chain. The Sun uses this process; it takes 10+ billion years.
- Above 1.3 solar masses (CNO cycle): Hydrogen fuses via the carbon-nitrogen-oxygen catalytic cycle. Faster, so more massive stars age rapidly.
- Above 8 solar masses: After core hydrogen exhaustion, core conditions reach 100 million K, enabling helium fusion to carbon and oxygen. Then neon, magnesium, silicon fusion in concentric shells—a runaway to instability.
This explains the observation: massive O and B stars are rare (live only millions of years, few form) while M dwarfs are abundant (live trillions of years, have time to accumulate).
Source: Kippenhahn, Weigert, & Weiss (2012) — "Stellar Structure and Evolution" — quantitative fusion models.
H-R Diagram Evolution: Stellar Life Tracks
The H-R diagram isn't static—stars trace evolutionary tracks as they age. A star born on the main sequence gradually brightens and warms as its core accumulates helium "ash." After ~90% of core hydrogen is exhausted, the core contracts, the outer envelope expands, and the star leaves the main sequence to become a red giant.
Main sequence: Hydrogen burning in core. Position stable for 90% of lifespan.
Red giant branch: Core hydrogen depleted, shell burning ignites, outer envelope expands to enormous size (100x solar radius common). Temperature drops—star moves rightward and upward on H-R diagram.
Horizontal branch: In lower-mass stars (1–2 M☉), helium fusion ignites in the core, stabilizing the star temporarily at higher temperature.
Asymptotic giant branch (AGB): More massive red giants reach this phase, burning both hydrogen and helium in shells. The star becomes unstable, pulsating and ejecting mass.
White dwarf cooling sequence: After shedding outer layers, the exposed carbon-oxygen core cools rightward at constant (low) luminosity on the H-R diagram over trillions of years.
Massive stars take a different path: they remain on the upper main sequence until core hydrogen exhausts, then become blue supergiants (briefly), then red supergiants, finally exploding as supernovae.
Source: Salaris & Cassisi (2005) — "Evolution of Stars and Stellar Populations" — detailed evolutionary models and H-R tracks.
Stellar Spectroscopy: Reading Light for Composition
Every absorption line in a star's spectrum carries information. Hydrogen-alpha (Hα) at 656 nm is strong in A-type stars and weak in O-types (too ionized at high temperature). Helium lines are strongest in O and B stars. Calcium ionization is strong in F and G stars. Titanium oxide (TiO) molecules only form in cool M-type stars—their presence signals coolness.
Spectroscopy reveals:
- Composition: Abundance of helium, carbon, iron, etc. tells the star's origin and age.
- Rotation: Doppler broadening of spectral lines measures rotation speed.
- Density: Line width is affected by pressure—giants have lower pressure, sharper lines; dwarfs have higher pressure, broader lines. This is how luminosity class is determined.
- Velocity: Redshift/blueshift reveals motion toward/away from us and orbital motion in binary systems.
Spectroscopic binaries are invisible pairs whose spectral lines oscillate in wavelength due to orbital motion—revealing mass ratios and orbital parameters. Many of the most precise stellar masses come from this technique.
Source: Gray, D. F. (2005) — "The Observation and Analysis of Stellar Photospheres" — comprehensive guide to stellar spectroscopy.
The Cosmic Distance Ladder: From Parallax to Cosmology
Knowing stellar distances is fundamental. The ladder has many rungs, each calibrated from lower rungs:
Parallax: Measure angular shift of nearby stars against distant background as Earth orbits the Sun. Gaia satellite (launched 2013) has measured parallaxes for billions of stars, enabling the distance ladder's recent revolution.
Main-sequence fitting: Nearby main-sequence stars have known distances from parallax. Fit their H-R diagram position, then use that to estimate distances to distant clusters using the same diagram.
Cepheid variables: Period-luminosity relation calibrated using Cepheids at known distances. Measure the period of a distant Cepheid, determine its intrinsic brightness, compare to apparent brightness, calculate distance. Used by Hubble to show other galaxies exist.
Type Ia supernovae: Thermonuclear explosions in binary white dwarf systems reach roughly constant peak brightness. Use as "standard candles" to measure distances to distant galaxies—the method that revealed accelerating cosmic expansion (2011 Nobel Prize).
The cosmic distance ladder connects us from nearest star (Proxima, 4.2 light-years) to the edge of the observable universe (46 billion light-years). Error compounds at each rung, but modern measurements have reduced uncertainty dramatically.
Source: Gaia Collaboration (2021) — "Gaia Early Data Release 3: Parallaxes" — modern parallax measurements.
Extreme Stellar Objects: The Boundaries
Emission nebulae and T-Tauri stars: Young, still-accreting stars surrounded by gas and dust, surrounded by emission nebulae (gas clouds ionized by ultraviolet light). They're found in star-forming regions like Orion and Taurus.
Wolf-Rayet stars: Hypergiant OB stars with surface temperatures exceeding 50,000 K, losing mass at 10⁻⁵ solar masses per year (a million times faster than the Sun). They're pre-supernova objects, often found in binary systems and surrounded by ejected shells.
Be stars: B-type stars rotating near breakup speed, ejecting material at the equator to form a disk (circumstellar disk). The disk radiates excess infrared and shows Balmer-series emission lines—the "Be" designation.
X-ray binaries: Neutron stars or black holes accreting material from companion stars. The in falling gas heats to millions of degrees, radiating X-rays. Discovered by early X-ray satellites, they remain some of the universe's most energetic sources.
Symbiotic variables: Binaries with a red giant and a white dwarf, separated by about a solar radius. The white dwarf accrets gas from the red giant's wind, causing dramatic outbursts and exotic nuclear burning.
Binary and Multiple Star Systems
About 50% of stars in the galaxy are part of multiple star systems — binary or hierarchical arrangements rather than isolated stars. Binary systems are essential to stellar astronomy but complicate stellar classification.
Wide binaries are separated by thousands of AU and evolve independently — each star follows the main sequence normally, and classification simply adds two individual spectral types (e.g., "A2 + K7" means an A-type and K-type star).
Close binaries separate by only a few AU or less — within each star's photosphere or close enough for gravitational interaction. These systems exhibit dramatic behavior:
Mass transfer: If one star becomes a red giant, its outer layers can overflow its Roche lobe (the region where its gravity dominates) and fall onto its companion. The mass-transferring system undergoes rapid, violent evolution. The initially more massive star can become the less massive one; the initially less massive companion accumulates mass and becomes the more evolved object. This mass transfer reversal produces systems that look inverted compared to their initial state.
X-ray binaries: When a compact star (neutron star or black hole) accretes material from a mass-transferring companion, frictional heating produces X-rays. These are among the universe's most energetic sources. Cygnus X-1 (a black hole accreting from a O-type star companion) was the first black hole candidate, identified by this X-ray signature. For more on compact stellar remnants, see neutron stars explained.
Common-envelope evolution: When a red giant overflows its Roche lobe and engulfs its companion, both stars spiral inward through shared gaseous envelope, dissipating orbital energy. This can cause dramatic shrinkage of the orbit or merger. Many exotic objects (neutron star white-dwarf binaries, black hole X-ray binaries) form this way.
Cataclysmic variables: Close binaries with a white dwarf accreting from a main-sequence companion. The accreted material heats, causing thermonuclear explosions called dwarf novae (temporary brightness outbursts). Some systems exhibit periodic eruptions; others show chaotic behavior. These systems are laboratories for understanding extreme accretion physics.
Stellar parameters from binaries: Eclipsing binary systems allow direct measurement of stellar masses, radii, and compositions with unprecedented precision—yielding data that calibrates all stellar evolution models.
Source: Pringle, J. E. (1981) — "Accretion discs in astrophysics" — foundational theory of binary mass transfer and accretion; modern eclipsing binary catalogs (ASAS-SN, Kepler mission data).
Variable Stars and Cosmic Yardsticks
Some stars vary in brightness with predictable rhythms. Cepheid variables pulsate with periods of days to months, and their average luminosity is tightly correlated with the period — a relationship discovered by Henrietta Swan Leavitt in 1908 using Cepheids in the Magellanic Clouds. Measure the period, you know the intrinsic brightness; compare to apparent brightness, you know the distance. Cepheids underpin the cosmic distance ladder and were how Hubble first showed that "spiral nebulae" were galaxies far outside the Milky Way — work that led directly to the Big Bang model.
RR Lyrae variables are older, lower-mass pulsating stars used to measure distances to galactic globular clusters and the galactic halo.
Eclipsing binaries are pairs whose orbital plane includes Earth. When one star passes in front of the other, the system dims predictably. Measuring the eclipse timing, depth, and light curve allows calculation of stellar masses, radii, and other properties with extraordinary precision—these are among our most reliable laboratory for testing stellar structure theory.
Spectral Types at a Glance
| Class | Color | Temp (K) | Mass (M☉) | Lifespan | Examples |
|---|---|---|---|---|---|
| O | Blue | 30,000–50,000 | 16–90+ | 1–10 Myr | Mintaka, Alnitak |
| B | Blue-white | 10,000–30,000 | 2.1–16 | 11–400 Myr | Rigel, Spica |
| A | White | 7,500–10,000 | 1.4–2.1 | 400 Myr–3 Gyr | Sirius, Vega |
| F | Yellow-white | 6,000–7,500 | 1.04–1.4 | 3–7 Gyr | Procyon, Polaris |
| G | Yellow | 5,200–6,000 | 0.8–1.04 | 7–15 Gyr | Sun, Alpha Cen A |
| K | Orange | 3,700–5,200 | 0.45–0.8 | 17–70 Gyr | Arcturus, Aldebaran |
| M | Red | 2,400–3,700 | 0.08–0.45 | 70 Gyr–10 Tyr | Proxima Cen, Barnard's Star |
Many of the planets discussed in our overview of exoplanets orbit K- and M-type stars, which are smaller, dimmer, and longer-lived than the Sun — making them easier transit targets and possibly extending habitable-zone lifetimes.
Frequently Asked Questions
Q: Why does the OBAFGKM stellar classification order seem random?
A: It's historical accident. Early spectral classifications by Annie Cannon used alphabetical labels based on hydrogen-line strength. When astronomers later discovered that temperature was the underlying physical variable, they reordered classes logically but kept the original letters to avoid breaking established nomenclature. The mnemonic "Oh Be A Fine Girl/Guy, Kiss Me" helps astronomers remember the sequence.
Q: What is the Sun's exact spectral classification?
A: G2V — a G-type star (yellow), subdivision 2 (slightly cooler than midpoint G), main-sequence luminosity class V ("dwarf"). The Sun is utterly unremarkable by stellar standards—a middle-aged, average-mass star in its middle-aged phase, with ~5 billion years remaining before becoming a red giant.
Q: Which stars have the longest lifespans and why?
A: Low-mass M-type red dwarfs live the longest because they fuse hydrogen extremely slowly—the mass-luminosity relation means their fusion rate is cubed-inversely proportional to mass. A 0.1 solar mass star lives roughly 10 trillion years, far exceeding the current universe age (13.8 billion years). No red dwarf has ever died of old age; none has existed long enough.
Q: What is the physical difference between red giants and red supergiants?
A: Both have left main-sequence hydrogen burning and expanded enormously, giving them cool surfaces (both are reddish). Red giants originate from sun-like stars (0.5–8 M☉); red supergiants from massive stars (>8 M☉). Supergiants are vastly more luminous and massive, produce heavier elements through fusion, and end catastrophically as supernovae. Red giants end more gently as planetary nebulae and white dwarfs.
Q: How do astronomers determine stellar composition and physical properties from light?
A: Spectroscopy reveals fingerprints of elements at characteristic wavelengths. Line patterns show composition; line widths indicate pressure and density (giants have low pressure, sharp lines; dwarfs have high pressure, broadened lines); Doppler shifts reveal motion and rotation. Spectroscopic binaries allow calculation of stellar masses from orbital dynamics. Each technique extracts different physical information from light.
Q: What distinguishes a brown dwarf from a low-mass star?
A: The mass threshold for hydrogen fusion: above 0.075 solar masses, objects can sustain core hydrogen fusion indefinitely (low-mass stars); below that, they can briefly fuse deuterium but never achieve sustained hydrogen burning (brown dwarfs). This divides brown dwarfs (13–80 Jupiter masses) from stars, making it the most fundamental boundary in stellar classification.
The takeaway
Stellar classification, from OBAFGKM to the Hertzsprung-Russell diagram, reveals that beneath apparent stellar chaos lies elegant organization governed by a single property: mass. Mass determines luminosity, temperature, lifespan, and ultimate fate through physics so straightforward (higher mass = hotter core = faster fusion) that it becomes the organizing principle for an entire cosmos of stars. The Sun, so important to us, is merely an ordinary G-type yellow dwarf—unremarkable in every way compared to the massive blue O-type giants and the trillions of dim M-type red dwarfs populating the galaxy. Modern parallax measurements from satellites like Gaia have transformed stellar astronomy from a science of rare precise measurements to a catalog of billions of stars with known distances and properties. This revolution continues reshaping our understanding of stellar populations, galactic structure, and the age of distant objects. The humble spectral classification system developed over a century ago remains one of astronomy's most powerful tools.
Read next:
Follow new articles
Add SciHub101 to your feed reader to see new science and technology stories.
About the Author
SciHub101 is an independent science and technology publication founded and edited by Buğra Sözeri, a software engineer and app developer based in Türkiye. AI tools assist with drafting and research. Source documentation in the existing archive is uneven, and articles are being reviewed and corrected. The Editorial Team byline identifies editorial responsibility; it does not certify specialist or independent human review. Where we compare products, anything built by our own team is labelled as such — see the editorial guidelines and About page for how corrections and disclosures work.
Related Articles
Planets of the Solar System — Complete Guide
All 8 planets and 5 dwarf planets explained — sizes, atmospheres, moons, missions, and what makes each world unique in our solar system.
The ISS Explained — Living in Space
How the International Space Station works: orbit, modules, daily life, science, and the transition to commercial stations and China's Tiangong by 2030.
Why Do Stars Twinkle? The Science of Atmospheric Seeing
Stars twinkle because Earth's turbulent atmosphere bends starlight in constantly shifting ways. Because stars are infinitely distant, they act as point sources, so even tiny bends in light rays cause dramatic brightness and color flickers. Planets, being much closer, show a small disk that averages out the jitter. Twinkling is worst near the horizon and is why the best observatories sit on mountaintops or in orbit.

Deep Learning and Star-Galaxy Classification: Teaching Computers to Read the Sky
Deep learning systems now classify billions of celestial objects with superhuman accuracy, enabling sky surveys that would take human astronomers millennia to complete.
How Stars Are Born and Die: The Complete Story of Stellar Evolution
Every atom of iron in your blood was forged inside a dying star. Here's the full life cycle that made you possible.

The Biggest Stars in the Universe: A Sun So Vast It Could Swallow Saturn's Orbit
If you placed the star UY Scuti where our Sun is, its surface would engulf Mercury, Venus, Earth, Mars, and reach out past the orbit of Jupiter. It is one of the largest known stars — a hypergiant so vast that light takes hours to cross it. Yet by another measure, this colossus is a lightweight: a star can be a thousand times wider than the Sun and still weigh less than the heaviest stars, which are smaller but unimaginably dense. Size, in space, is not what it seems.