Sustainability
Cycling Infrastructure: How to Compare Network Quality
Why kilometres of bike lanes cannot establish a global winner, and how connectivity, junctions, and design standards affect a network assessment.
Climate change and sustainability news: renewable energy, clean technology, environmental policy, and green innovation updates.
Why kilometres of bike lanes cannot establish a global winner, and how connectivity, junctions, and design standards affect a network assessment.
Somalia, Chad, and Sudan top the Global Climate Risk Index. Small island nations like Tuvalu and Kiribati face complete disappearance beneath rising seas. Bangladesh could lose 17% of its land by 2050. Here's which countries face the greatest climate threat — and the cruel injustice that those most at risk contributed almost nothing to causing the crisis.
WRI's 2023 Aqueduct update puts 25 countries, home to about a quarter of humanity, in the extremely high water stress category. Here is who ranks worst, why the rankings disagree, and what Cape Town, Chennai, the Aral Sea, and Israel show about causes and fixes.

Monaco packs about 18,500 people into each square kilometre of land, Singapore about 8,300 and Bangladesh about 1,330 — the densest country of any real size. World Bank 2024 data, ranked two ways, with what density does and does not tell you.
Ethiopia, DR Congo, and Niger have the worst access to clean drinking water — fewer than 50% of the population has access. 2.2 billion people lack safely managed drinking water globally. Waterborne diseases kill 1.5 million people annually. A child dies every 2 minutes from diarrheal disease linked to unsafe water.
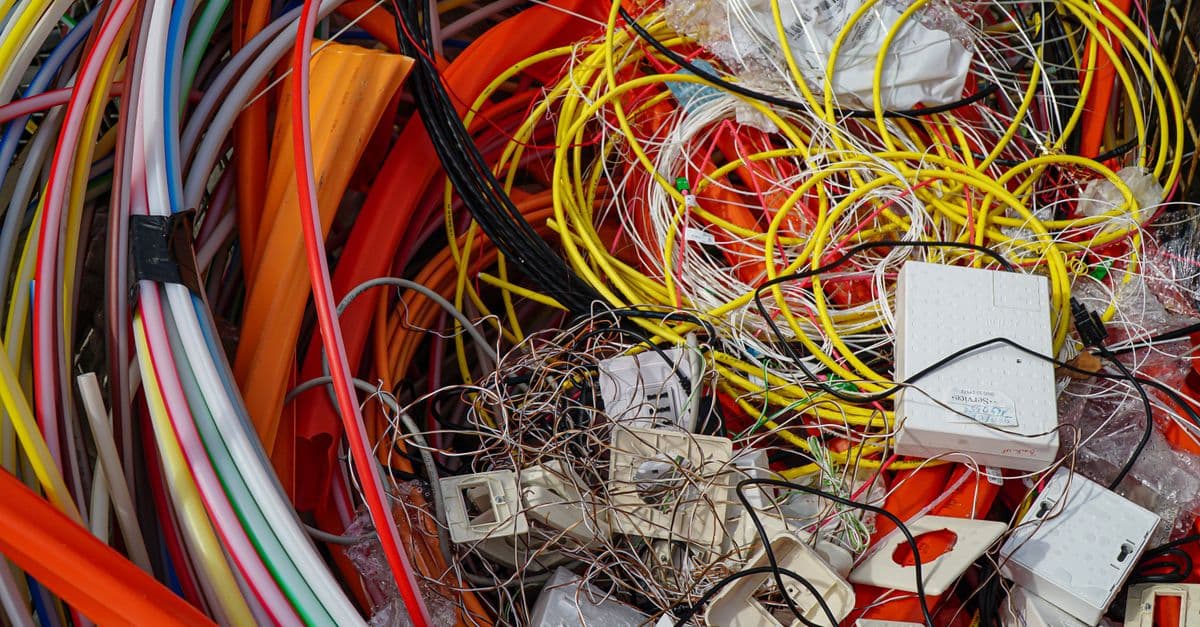
The world generated 62 million tonnes of e-waste in 2022 — a record. China produces the most e-waste in absolute terms (12 million tonnes). Norway and Iceland generate the most per capita. Only 22% of e-waste is formally recycled. E-waste contains $62 billion in recoverable precious metals annually.
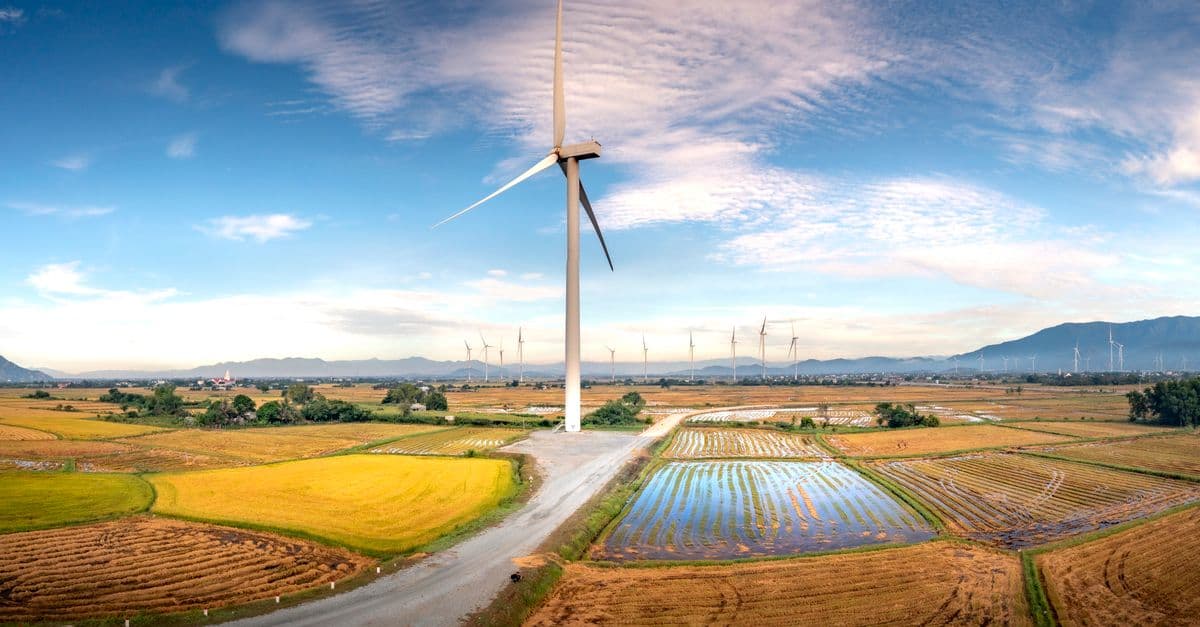
China leads almost every broad measure of food output, but the ranking changes with the metric. Here is who leads by value added, by staple crop tonnage, and by meat and milk, with sources and caveats.
Wheat feeds more people than any other cereal crop and underpins global food security. This ranking uses USDA and FAO data to show which countries grow the most wheat, which ones export it, and why the two lists look so different.
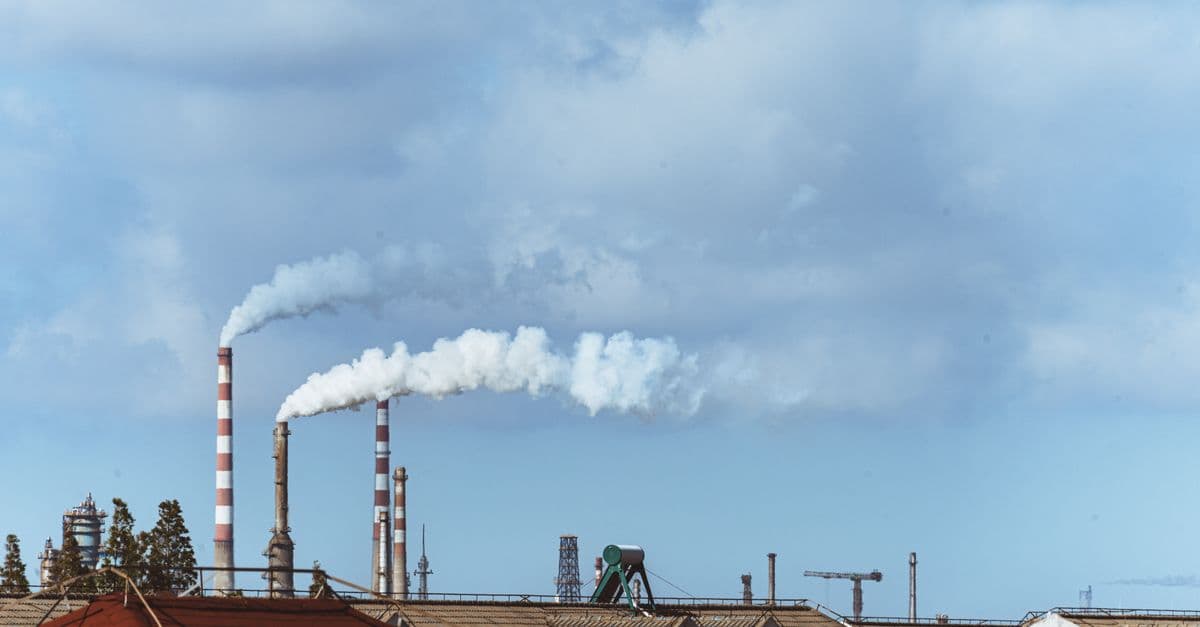
Air quality is one of the most direct indicators of environmental health. This ranking shows which countries and territories breathe the cleanest air, which suffer the worst pollution, and why small islands keep beating industrial giants on the numbers.
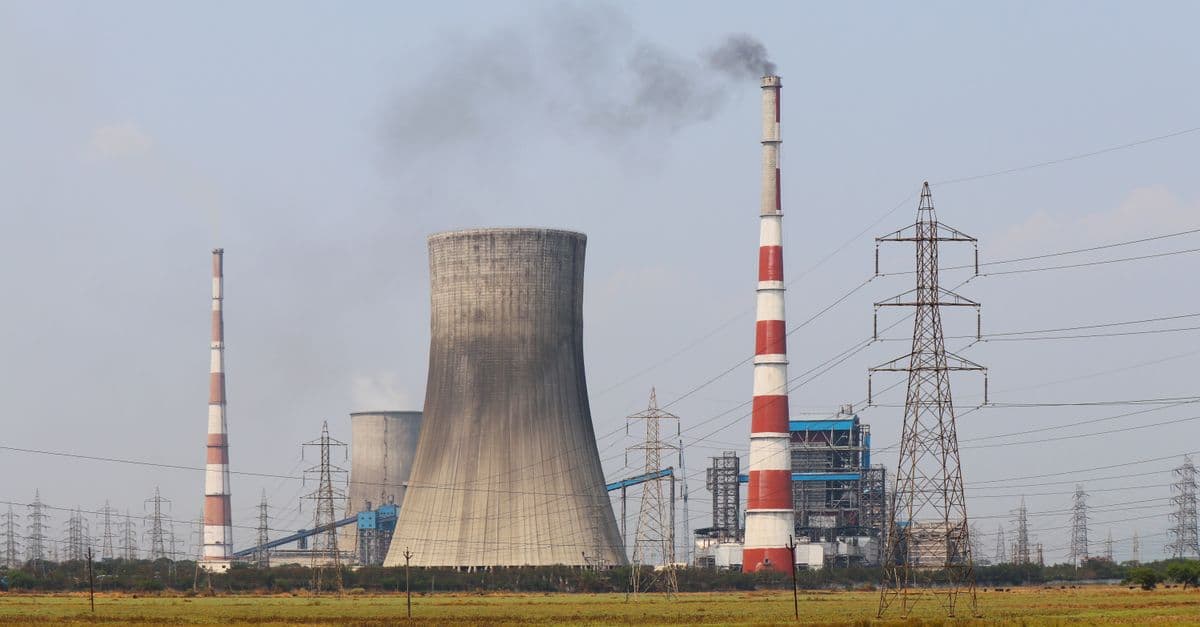
Which countries emit the most carbon dioxide depends on how you count. This ranking uses Global Carbon Project data for 2024 and compares annual territorial emissions, per-person emissions, emissions embedded in trade, and cumulative emissions since the industrial revolution.
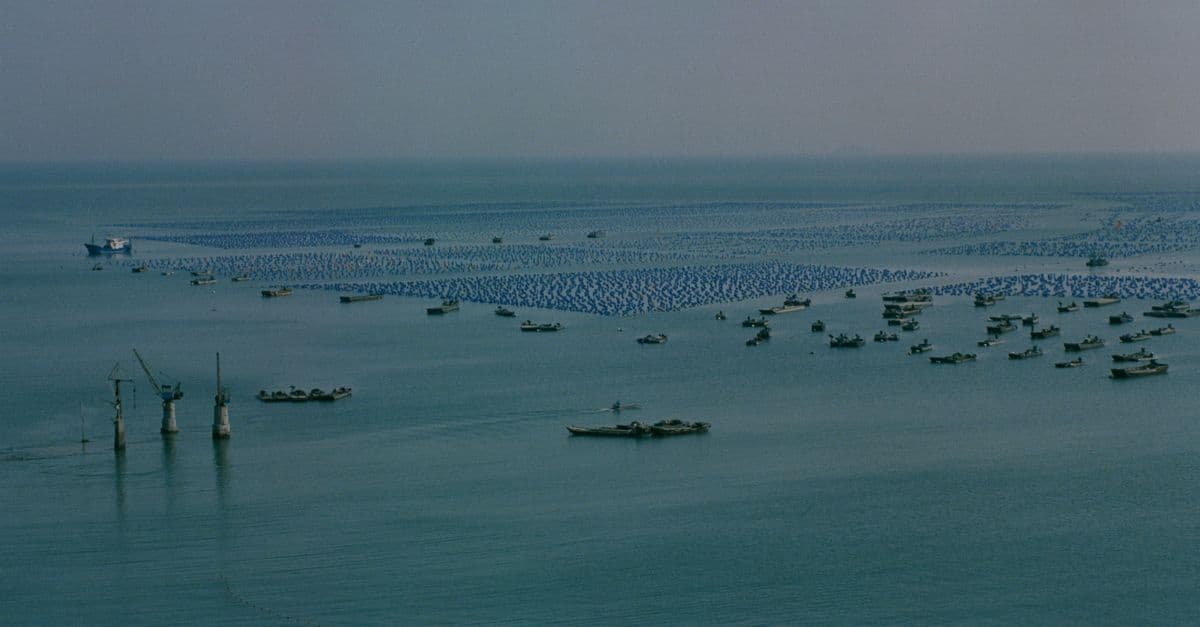
The ocean covers 71% of Earth's surface, and a coastal state controls the resources in the first 200 nautical miles off its shores. This ranking shows which nations hold the most maritime territory, why published figures disagree, and what an exclusive economic zone does and does not allow.
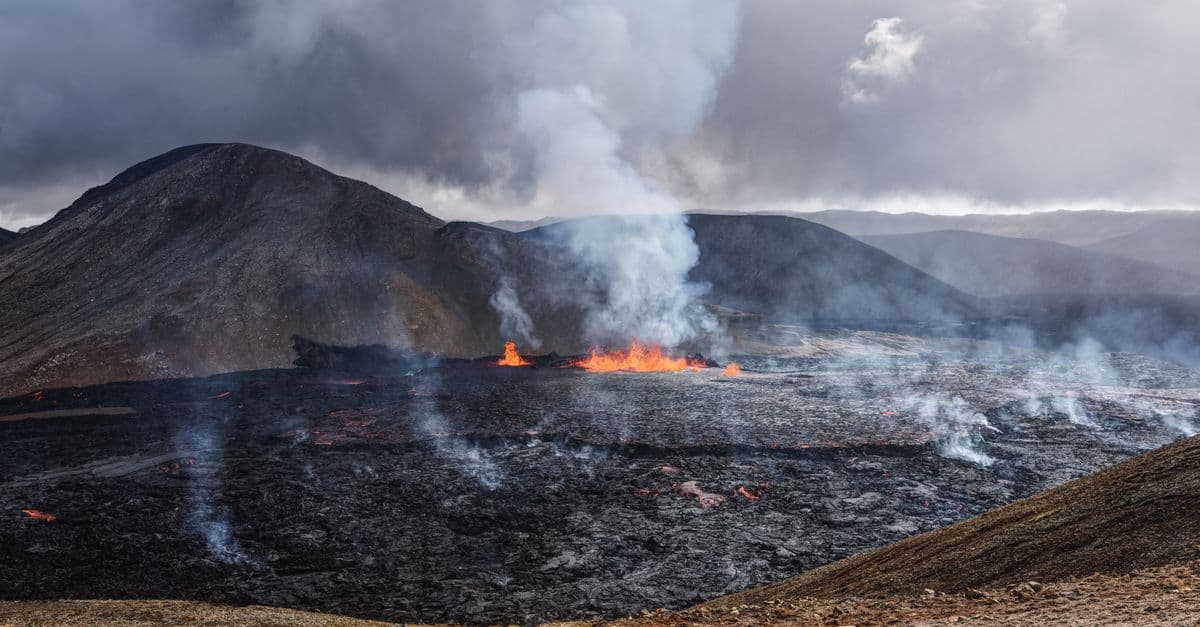
Which countries host the most active volcanoes depends on how you define active. This ranking compares the Smithsonian's Holocene counts with recent-eruption counts, and explains why the United States, Japan, Indonesia, Russia, and Chile keep swapping places.