Type 2 Diabetes: The Biology Behind the Epidemic

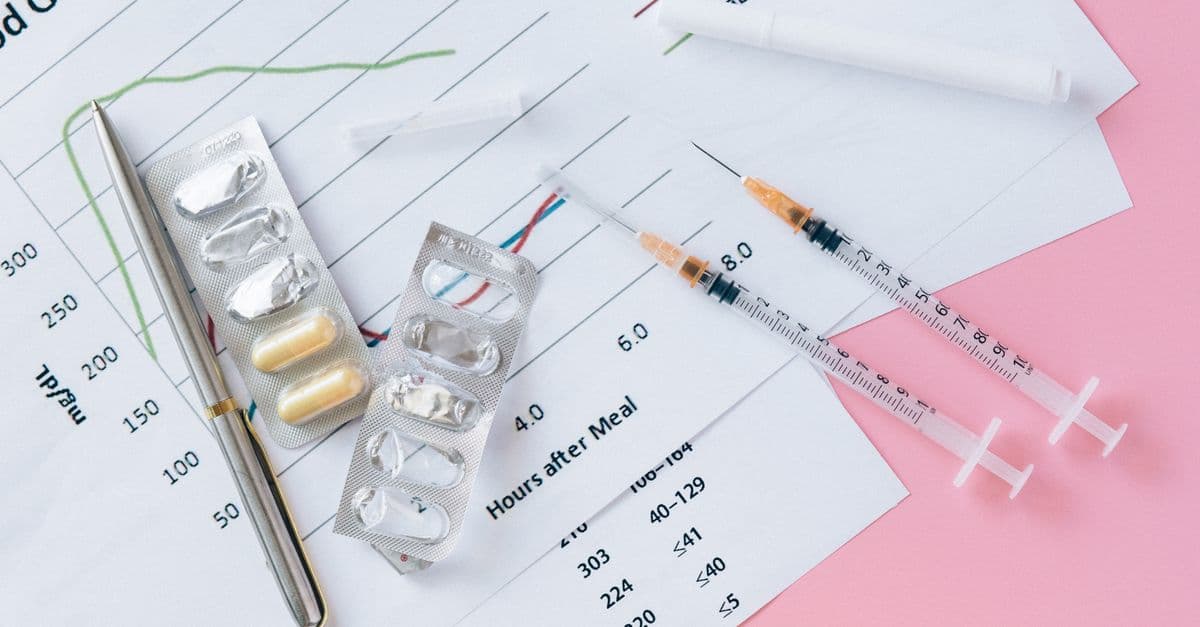
Photo: Nataliya Vaitkevich / Pexels
Type 2 diabetes is often described as a sugar problem, but the biology starts well before blood sugar rises. Tissues stop responding well to insulin, the pancreas compensates by making more, and for years nothing shows up on a standard test. When the compensation fails, glucose climbs. The World Health Organization estimated that about 830 million people lived with diabetes in 2022, more than 95% of them with type 2, and the mechanisms below explain why some people can reverse it and others cannot.
Educational content, not medical advice. This article describes general, well-established findings from published research and public health agencies. Talk to a doctor before changing any medication, treatment, or routine; every person's situation differs.
How common is type 2 diabetes?
The numbers depend on how and where they are counted, so it helps to see them side by side.
| Measure | Figure | Source |
|---|---|---|
| People living with diabetes worldwide, 2022 | About 830 million, up from 200 million in 1990 | WHO |
| Share of adults aged 18 and older with diabetes, 2022 | 14%, up from 7% in 1990 | WHO |
| Share of diabetes that is type 2 | More than 95% | WHO |
| Deaths directly caused by diabetes, 2021 | 1.6 million, plus 530,000 from diabetes-related kidney disease | WHO |
| Adults aged 30 and older with diabetes not taking medication, 2022 | 59% | WHO |
| People in the United States with diagnosed or undiagnosed diabetes, 2023 | About 40.1 million (12.0% of the population) | CDC |
| U.S. adults with diabetes who are undiagnosed | 27.6%, about 11.0 million | CDC |
| U.S. adults with prediabetes | About 115.2 million | CDC |
Sources: WHO diabetes fact sheet, November 14, 2024 and CDC diabetes data. WHO's figure counts people who report or are measured as having diabetes, so it differs from other estimates built on different definitions and age ranges.
WHO lists being overweight, not getting enough exercise, and genetics among the contributing factors to type 2 diabetes, and calls it often preventable. For a country-by-country comparison, see countries with the most diabetes. The rest of this article explains why the disease behaves the way it does.
How insulin normally works
After a meal, rising blood glucose prompts pancreatic beta cells, clustered in the islets of Langerhans, to release insulin. Insulin binds a receptor on the surface of muscle, fat, and liver cells and starts a signaling chain inside them. In muscle and fat, that chain ends with glucose transporters (called GLUT4) moving to the cell surface so glucose can enter. In the liver, it tells the organ to stop producing glucose and to store it as glycogen. A more detailed walk-through of that signaling cascade is in insulin and diabetes explained, and the broader choreography of storing and releasing fuel is in how the body stores and releases glucose.
Muscle matters more than most people expect. A review by DeFronzo and Tripathy puts the muscle share at about 80% of glucose uptake under insulin-clamp conditions, a lab method that holds insulin high and blood glucose steady. During an oral glucose tolerance test, the splanchnic bed (the gut and liver) takes up a significant 30 to 40% (DeFronzo and Tripathy, Diabetes Care 2009). The same paper describes muscle insulin resistance as considered the initiating defect, evident decades before beta cell failure and overt hyperglycemia.
Think of insulin as a doorman at several buildings. When he calls out, muscle opens its doors and glucose pours in, while the liver closes its own loading dock. Type 2 diabetes begins when the buildings stop listening.
How insulin resistance develops
Insulin resistance means the same amount of insulin produces a weaker glucose-lowering effect. Several overlapping mechanisms are involved, and researchers still debate their order and relative weight.
Fat in the wrong places
One leading explanation concerns where fat is stored. Picture a warehouse with fixed shelf space. When the shelves, the body's fat tissue, are full, boxes of fatty acids start piling up in the aisles, meaning the liver and muscle. Samuel and Shulman argue that insulin resistance develops when nutrient storage pathways are overloaded by chronic energy surplus, and that fat accumulating in liver and skeletal muscle disrupts insulin signaling (Samuel and Shulman, J Clin Invest 2016). In their model, muscle insulin resistance appears first and diverts glucose to the liver, which increases the liver's fat production. Later, immune cells called macrophages infiltrate fat tissue, increase fat breakdown, and raise liver triglyceride synthesis and glucose production.
At the molecular level, one proposed link is a lipid called diacylglycerol (DAG). In a 2016 study, researchers found that DAG activates an enzyme called PKCε, which then phosphorylates (adds a phosphate to) a specific spot, Thr1160, on the insulin receptor, severely reducing its kinase activity. Mice engineered so they could not be phosphorylated at the equivalent spot were protected from liver insulin resistance on a high-fat diet (Petersen et al., J Clin Invest 2016). That is a precise mechanism in mice and cell experiments, and how fully it generalizes to people is still being worked out.
Inflammation
The second thread is inflammation. A review in Nature Reviews Immunology names adipose tissue as the site with the most apparent immune changes in obesity and type 2 diabetes, with altered cytokine and chemokine levels, increased cell death, and tissue fibrosis, and notes that early trials of interleukin-1 antagonists support a role for inflammation (Donath and Shoelson, 2011). Inflammatory signaling and fat accumulation feed each other: fatty tissue produces inflammatory signals, those signals blunt insulin action, and the resulting high glucose and insulin favor more fat storage.
Mitochondria and lipid by-products
A third thread involves mitochondria, the cell's energy plants (see how mitochondria became cell powerhouses). When fatty acids are burned incompletely, lipid by-products such as diacylglycerol, ceramide, and acylcarnitine may accumulate. Petersen and Shulman's review examines the evidence for and against each of these as mediators of insulin resistance (Physiological Reviews 2018). The words "for and against" are the honest summary: there is evidence for several candidates, and no single one has settled the question.
The liver keeps producing glucose
Normally insulin tells the liver to stop making glucose after a meal. In type 2 diabetes that signal fails, and the liver continues releasing glucose between meals and overnight. That is why a raised fasting glucose is often what first prompts a diagnosis. The liver's role is explored more broadly in how the liver works.
When the pancreas can no longer compensate
Early in the disease, beta cells respond to resistance by making more insulin. For a while that holds blood glucose near normal, and the only clue is a high insulin level. The pancreas is like a person shouting louder in a room that is getting noisier: it works for a time, and then the voice gives out.
What does "gives out" mean in tissue terms? In a 2003 autopsy study, relative beta cell volume was 63% lower in obese people with type 2 diabetes, 41% lower in lean people with type 2 diabetes, and 40% lower in obese people with impaired fasting glucose, compared with nondiabetic controls (Butler et al., Diabetes 2003). The study also reported increased beta cell apoptosis, a form of programmed cell death. Two points stand out. Beta cell loss is substantial by the time diabetes is diagnosed, and it has already begun in people with impaired fasting glucose. And lean people can get type 2 diabetes too, so excess weight is a major risk factor, not a requirement.
Researchers have proposed several reasons beta cells fail:
- Overwork and stress. Cells under constant demand to make and fold insulin can accumulate stress in their protein-making machinery.
- Amyloid. Beta cells co-release islet amyloid polypeptide (IAPP, also called amylin) with insulin. In type 2 diabetes, IAPP forms amyloid deposits, and a review in Endocrine Reviews proposes that toxic IAPP oligomers inside cells, rather than the visible extracellular amyloid, may drive beta cell loss (Endocrine Reviews 2008).
- Glucolipotoxicity. Chronically high glucose and fatty acids together are thought to be more damaging to beta cells than either alone.
- Loss of identity. Some beta cells may not die but dedifferentiate, losing the features that make them insulin-producing cells. In one lab model, treating human beta cells and islets with the growth factor FGF2 reduced beta cell markers and activated markers of less specialized cells, and the effect was reversible after washout (Diedisheim et al., Molecular Metabolism 2018). That supports the idea that some loss of function may be reversible, although it is a cell model and not proof in patients.
The twin cycle: why the disease can be reversed
If fat in the liver and pancreas helps cause the disease, removing that fat should help. Roy Taylor at Newcastle University proposed the twin cycle hypothesis to explain how the two organs could drive each other. In the liver, excess energy increases liver fat, which worsens liver insulin resistance, which increases glucose output and prompts more insulin, which promotes still more liver fat. Fat exported from the liver then reaches the pancreas, where it is thought to impair beta cell function. See Taylor, Diabetes Care 2013 for the review.
A small study tested the prediction directly. Eleven people with type 2 diabetes ate about 600 kilocalories a day for eight weeks. Liver fat fell from 12.8% to 2.9%, pancreatic fat fell from 8.0% to 6.2%, and fasting glucose normalized within a week, from 9.2 to 5.9 millimoles per liter. First-phase insulin response, the early burst of insulin after a glucose challenge, rose from 0.19 to 0.46 (controls were at 0.62) (Lim et al., Diabetologia 2011). The numbers suggest that at least in some people with relatively recent disease, beta cell function can recover when fat is removed from liver and pancreas. The study was small and short, so it generated a hypothesis for larger trials rather than ending the debate.
What the remission trials show
The Diabetes Remission Clinical Trial (DiRECT) tested a structured weight-management program delivered in primary care in the United Kingdom. At 12 months, 68 of 149 participants in the intervention group (46%) were in remission compared with 6 of 149 controls (4%). The odds ratio was 19.7 (Lean et al., Lancet 2018).
The result was strongly linked to how much weight people lost.
| Weight change at 12 months | Participants in remission |
|---|---|
| Gained weight | 0 of 76 (0%) |
| Maintained, lost 0 to 5 kg | 6 of 89 (7%) |
| Lost 5 to 10 kg | 19 of 56 (34%) |
| Lost 10 to 15 kg | 16 of 28 (57%) |
| Lost 15 kg or more | 31 of 36 (86%) |
Source: Lean et al., Lancet 2018, whole study population.
Follow-up showed that remission is possible to keep but hard. At 24 months, 53 of 149 intervention participants (36%) were in remission versus 5 of 149 controls (3%) (Lean et al., Lancet Diabetes and Endocrinology 2019). At five years, the report gave remission as 27% in the original intervention group versus 4% in controls, while a subgroup of 85 extension participants who received continued support lost an average of 6.1 kg and 11 of them (13%) were in remission (Lean et al., Lancet Diabetes and Endocrinology 2024). Different denominators make these numbers easy to confuse, so it is worth reading which group each refers to.
Surgery tells a related story. In a randomized trial with five-year follow-up, 19 of 38 patients (50%) who had bariatric surgery maintained diabetes remission, compared with none of 15 patients on medical treatment (per-protocol analysis) (Mingrone et al., Lancet 2015).
Two cautions apply. Remission is not a cure, because the underlying risk remains and diabetes can return, as the five-year figures show. And these are programs with intensive support. How well the results transfer to ordinary life is a separate question that trials like these cannot answer on their own, a point explored for randomized trials in why randomized trials are powerful.
Why people differ: genes, body fat, and lean type 2 diabetes
If excess fat were the only cause, every person with obesity would have type 2 diabetes and no lean person would. Neither is true. A large genetic analysis in Nature, titled "Genetic drivers of heterogeneity in type 2 diabetes pathophysiology," reflects the current view that type 2 diabetes is a collection of related paths to the same blood glucose reading, not a single mechanism (Suzuki et al., Nature 2024).
That fits what Butler's autopsy study showed in lean patients, who had a 41% beta cell deficit with little excess fat to blame. A person's capacity to store fat safely, to make and release insulin, and to resist inflammation all vary, and the combination decides at what weight a given person tips over. This is one reason weight alone is a poor predictor of who will develop the disease, and it complicates any blanket statement about cause.
Diagnosing type 2 diabetes and prediabetes
Diagnosis rests on blood glucose measures. The thresholds below come from the American Diabetes Association, as summarized by the National Institute of Diabetes and Digestive and Kidney Diseases (NIDDK).
| Test | Normal | Prediabetes | Diabetes |
|---|---|---|---|
| A1C (average glucose over about three months) | Below 5.7% | 5.7% to 6.4% | 6.5% or above |
| Fasting plasma glucose | 99 mg/dL or below | 100 to 125 mg/dL | 126 mg/dL or above |
| Two-hour oral glucose tolerance test | 139 mg/dL or below | 140 to 199 mg/dL | 200 mg/dL or above |
Source: NIDDK, Tests and diagnosis. Doctors usually use a second test to confirm a diabetes diagnosis, and a random plasma glucose of 200 mg/dL or above in a person with symptoms also counts.
A1C reflects glucose attached to hemoglobin in red blood cells, which is why it tracks roughly the past few months. Conditions that change red blood cell lifespan or hemoglobin structure can make A1C less reliable, which is one reason clinicians sometimes use other tests.
Prediabetes is a window, not a sentence
The Diabetes Prevention Program randomized 3,234 adults with elevated fasting and post-load glucose to placebo, metformin, or an intensive lifestyle program with goals of at least 7% weight loss and at least 150 minutes of physical activity per week. Over an average follow-up of 2.8 years, the lifestyle program reduced the incidence of type 2 diabetes by 58% and metformin by 31%, compared with placebo (Knowler et al., NEJM 2002). Given the beta cell data above, it makes sense that earlier intervention would have more to work with, although the DPP itself does not test that mechanism.
For related reading on the role of eating patterns, see what the science says about intermittent fasting and whether sugar is really that bad for you.
Diabetes types compared
| Feature | Type 1 | Type 2 | MODY | Gestational |
|---|---|---|---|---|
| Core problem | Autoimmune destruction of beta cells | Insulin resistance plus beta cell failure | Single-gene defect in beta cell function | Pregnancy-related insulin resistance |
| Usual onset | Often childhood or adolescence | Often adult, increasingly younger | Often young adulthood or earlier | During pregnancy |
| Insulin needed | Always | Often later, if at all | Variable | Sometimes |
| Share of all diabetes | Small | More than 95% (WHO) | Rare | Pregnancy only |
Type 1 and type 2 are confused often. In type 1 the immune system destroys beta cells, so insulin is required from the start. In type 2 beta cells remain but are overwhelmed, which is why treatment can begin with lifestyle changes and tablets. For a fuller look at the autoimmune side, see insulin and diabetes explained.
How high glucose damages the body
Persistently high glucose harms small and large blood vessels and nerves. Brownlee's 2001 Nature review described four main molecular pathways linking high glucose to vascular injury and proposed that they converge on one process: overproduction of superoxide, a reactive oxygen molecule, by the mitochondrial electron-transport chain (Brownlee, Nature 2001). The pathways are usually listed as formation of advanced glycation end-products (sugar-damaged proteins), the polyol pathway, protein kinase C activation, and the hexosamine pathway.
Think of it as slow corrosion. Glucose attaches itself to proteins, stiffens vessel walls, and triggers inflammation. The result is damage to the retina (retinopathy), the kidney (nephropathy), and nerves (neuropathy), and acceleration of atherosclerosis.
The cardiovascular numbers are large. A meta-analysis of 102 prospective studies covering 698,782 people found that diabetes roughly doubled the hazard of coronary heart disease (hazard ratio 2.00) and raised the hazard of ischemic stroke to 2.27 (Emerging Risk Factors Collaboration, Lancet 2010). WHO estimates that high blood glucose caused around 11% of cardiovascular deaths, and that diabetes-related kidney disease caused 530,000 deaths in 2021.
Treatments matched to the biology
Modern treatment follows the mechanisms described above. Each approach targets a different step.
| Approach | What it targets | Key evidence cited here |
|---|---|---|
| Weight loss and lifestyle | Fat in liver and pancreas, insulin resistance | DiRECT remission rates; DPP 58% reduction in incidence |
| Metformin | Liver glucose output; mitochondrial and signaling effects | DPP 31% reduction in incidence |
| SGLT2 inhibitors | Kidney glucose reabsorption | EMPA-REG OUTCOME |
| GLP-1 receptor agonists | Insulin release after meals, appetite, weight | STEP 1; SELECT |
| Insulin | Replaces missing insulin when beta cell reserve is low | Standard of care |
| Bariatric surgery | Large, sustained weight loss | Five-year randomized trial, 50% remission |
Metformin
Metformin is widely used as first-line medication. How it works is more complex than it once seemed. Reviews describe effects on liver glucose production, on mitochondrial function and oxidative stress, and on signaling pathways including AMPK and mTORC1 (Redox Biology 2020). Rather than a single target, it appears to have several.
SGLT2 inhibitors
These drugs, such as empagliflozin, block a kidney transporter so that more glucose leaves in the urine. In the EMPA-REG OUTCOME trial of 7,020 treated patients with type 2 diabetes (median follow-up 3.1 years), the primary composite cardiovascular outcome occurred in 10.5% on empagliflozin and 12.1% on placebo (hazard ratio 0.86). Cardiovascular death was 3.7% versus 5.9% (a 38% relative reduction), heart-failure hospitalization 2.7% versus 4.1% (35%), and all-cause death 5.7% versus 8.3% (32%) (Zinman et al., NEJM 2015). Researchers are still working out how much of this benefit comes from lowering glucose and how much from other effects of the drug.
GLP-1 receptor agonists
GLP-1 is a gut hormone that raises insulin release after meals, slows stomach emptying, and reduces appetite. Drugs that mimic it, such as semaglutide, are covered in how GLP-1 drugs like Ozempic and Wegovy work. In the STEP 1 trial of 1,961 adults with overweight or obesity but without diabetes, mean weight change at week 68 was minus 14.9% with semaglutide versus minus 2.4% with placebo (Wilding et al., NEJM 2021). In SELECT, which enrolled 17,604 adults with obesity but without diabetes, the composite of cardiovascular death, nonfatal heart attack, or nonfatal stroke occurred in 6.5% on semaglutide versus 8.0% on placebo (hazard ratio 0.80) (Lincoff et al., NEJM 2023). Both trials enrolled people without diabetes, so their numbers do not directly describe results in people with type 2 diabetes.
Insulin and surgery
When beta cell reserve is too low for tablets or other injectables to control glucose, insulin is added. That is a consequence of the biology and not a failure of effort, since beta cell loss can be substantial by diagnosis. Bariatric surgery sits at the far end of the weight-loss spectrum, with the five-year trial result cited above.
The metabolic cluster around diabetes, including blood pressure, blood lipids, and fatty liver, is covered in obesity and metabolic syndrome. Exercise adds a separate lever, since working muscle takes up glucose; see the science of exercise.
What people get wrong about type 2 diabetes
"It is caused by eating sugar." Sugar intake can contribute through excess energy and weight, but the disease is defined by insulin resistance and beta cell failure, which can occur in different combinations. WHO lists overweight, low physical activity, and genetics among the contributing factors.
"Only overweight people get it." The autopsy data show a 41% beta cell deficit in lean patients. Weight is a major risk factor but not the whole story.
"Remission means cured." Remission means glucose is below the diagnostic threshold without glucose-lowering medication. In DiRECT, remission rates fell between year one and year five, so the risk does not disappear.
"Prediabetes is not a real condition." Prediabetes marks glucose levels above normal and below the diabetes thresholds, and in the DPP, a lifestyle program in people with it reduced progression to diabetes by 58%.
"Needing insulin means the patient failed." Beta cell mass and function decline in many people with the disease, so insulin can be a natural step. The 63% and 41% beta cell deficits reported by Butler make that point concrete.
Open questions
Several questions remain unsettled. Why do some people store excess fat in the liver and pancreas at modest body weights, while others tolerate more? Which of the proposed lipid mediators matter most in people, as opposed to mice? Can beta cells that have dedifferentiated be coaxed back in a human patient? And how can remission, which has been shown in carefully supported programs, be sustained at population scale? The answers will probably come from combining genetics, imaging of liver and pancreatic fat, and long randomized trials, and they may show that type 2 diabetes is better described as several diseases than one.
Frequently asked questions
Q: What is the difference between type 1 and type 2 diabetes? A: Type 1 is an autoimmune condition in which the immune system destroys the insulin-producing beta cells, so insulin is needed from the start. Type 2 involves resistance to insulin plus beta cells that eventually cannot keep up. WHO says more than 95% of people with diabetes have type 2.
Q: Can type 2 diabetes be reversed? A: Remission is possible for some people. In the DiRECT trial, 46% of the intervention group was in remission at 12 months versus 4% of controls, and 86% of those who lost 15 kg or more were. At five years, 27% of the original intervention group was reported in remission versus 4% of controls. Remission is not the same as cure.
Q: Why does excess body fat lead to insulin resistance? A: One leading model holds that when fat tissue reaches its storage limit, fat accumulates in the liver and muscle, where lipid by-products such as diacylglycerol disrupt insulin signaling. Inflammation in fat tissue adds to the problem. These mechanisms are best documented in laboratory and animal work, and their relative importance in people is still debated.
Q: What does A1C measure? A: A1C reflects how much glucose has attached to hemoglobin in red blood cells, which tracks average blood glucose over roughly the past three months. A value of 6.5% or above is one of the diagnostic criteria for diabetes, and doctors usually confirm it with a second test.
Q: What is prediabetes and why does it matter? A: Prediabetes means glucose is above normal but below the diabetes threshold: A1C 5.7% to 6.4%, fasting glucose 100 to 125 mg/dL, or a two-hour glucose tolerance test of 140 to 199 mg/dL. In the Diabetes Prevention Program, an intensive lifestyle program cut the rate of new type 2 diabetes by 58% over an average of 2.8 years, compared with 31% for metformin.
Q: Do SGLT2 inhibitors and GLP-1 drugs help beyond lowering blood sugar? A: In EMPA-REG OUTCOME, empagliflozin reduced cardiovascular death by 38% in relative terms in people with type 2 diabetes. In SELECT, semaglutide lowered major cardiovascular events (hazard ratio 0.80) in adults with obesity but without diabetes. The mechanisms are still being studied.
Q: Why can lean people develop type 2 diabetes? A: Beta cell function and fat storage vary between people. In an autopsy study, lean people with type 2 diabetes had 41% less beta cell volume than controls. Genetics, fat distribution, and inflammation all contribute, so body weight does not predict risk perfectly.
The takeaway
Type 2 diabetes is the end point of a long negotiation between tissues that resist insulin and beta cells that try to compensate. For years the pancreas shouts louder and the numbers look normal. By the time glucose crosses the diagnostic line, a large share of beta cell volume may already be gone, and fat has probably been accumulating in the liver and pancreas. The encouraging half of the story is that this process is not a one-way street for everyone. When enough weight comes off, a meaningful share of people in carefully supported programs return to normal glucose without drugs, and the DPP shows that earlier action prevents many cases. The sobering half is that remission rates fall over time and that the biology differs from person to person. The practical message from the research is that earlier is better, that mechanism-based treatment works, and that the disease should be understood as more than a sugar problem.
Sources
- World Health Organization, Diabetes fact sheet (November 14, 2024).
- Centers for Disease Control and Prevention, National diabetes statistics (2023 data).
- National Institute of Diabetes and Digestive and Kidney Diseases, Tests and diagnosis.
- DeFronzo RA, Tripathy D. Skeletal muscle insulin resistance is the primary defect in type 2 diabetes. Diabetes Care 2009. PMID 19875544.
- Samuel VT, Shulman GI. The pathogenesis of insulin resistance: integrating signaling pathways and substrate flux. J Clin Invest 2016. PMID 26727229.
- Petersen MC, et al. Insulin receptor Thr1160 phosphorylation mediates lipid-induced hepatic insulin resistance. J Clin Invest 2016. PMID 27760050.
- Petersen MC, Shulman GI. Mechanisms of insulin action and insulin resistance. Physiol Rev 2018. PMID 30067154.
- Donath MY, Shoelson SE. Type 2 diabetes as an inflammatory disease. Nat Rev Immunol 2011. PMID 21233852.
- Butler AE, et al. Beta-cell deficit and increased beta-cell apoptosis in humans with type 2 diabetes. Diabetes 2003. PMID 12502499.
- Islet amyloid in type 2 diabetes, and the toxic oligomer hypothesis. Endocr Rev 2008. PMID 18314421.
- Diedisheim M, et al. Modeling human pancreatic beta cell dedifferentiation. Mol Metab 2018. PMID 29472102.
- Taylor R. Type 2 diabetes: etiology and reversibility. Diabetes Care 2013. PMID 23520370.
- Lim EL, et al. Reversal of type 2 diabetes: normalisation of beta cell function in association with decreased pancreas and liver triacylglycerol. Diabetologia 2011. PMID 21656330.
- Lean MEJ, et al. DiRECT, Lancet 2018. PMID 29221645; 2-year results, Lancet Diabetes Endocrinol 2019. PMID 30852132; 5-year follow-up, Lancet Diabetes Endocrinol 2024. PMID 38423026.
- Mingrone G, et al. Bariatric-metabolic surgery versus conventional medical treatment in obese patients with type 2 diabetes: 5 year follow-up. Lancet 2015. PMID 26369473.
- Knowler WC, et al. Reduction in the incidence of type 2 diabetes with lifestyle intervention or metformin. NEJM 2002. PMID 11832527.
- Suzuki K, et al. Genetic drivers of heterogeneity in type 2 diabetes pathophysiology. Nature 2024. PMID 38374256.
- Brownlee M. Biochemistry and molecular cell biology of diabetic complications. Nature 2001. PMID 11742414.
- Emerging Risk Factors Collaboration. Diabetes mellitus, fasting blood glucose concentration, and risk of vascular disease. Lancet 2010. PMID 20609967.
- Zinman B, et al. Empagliflozin, cardiovascular outcomes, and mortality in type 2 diabetes. NEJM 2015. PMID 26378978.
- Wilding JPH, et al. Once-weekly semaglutide in adults with overweight or obesity (STEP 1). NEJM 2021. PMID 33567185.
- Lincoff AM, et al. Semaglutide and cardiovascular outcomes in obesity without diabetes (SELECT). NEJM 2023. PMID 37952131.
- Mechanisms of action of metformin in type 2 diabetes: effects on mitochondria and leukocyte-endothelium interactions. Redox Biol 2020. PMID 32535544.
Read next:
Follow new articles
Add SciHub101 to your feed reader to see new science and technology stories.
About the Author
SciHub101 is an independent science and technology publication founded and edited by Buğra Sözeri, a software engineer and app developer based in Türkiye. AI tools assist with drafting and research. Source documentation in the existing archive is uneven, and articles are being reviewed and corrected. The Editorial Team byline identifies editorial responsibility; it does not certify specialist or independent human review. Where we compare products, anything built by our own team is labelled as such — see the editorial guidelines and About page for how corrections and disclosures work.
Related Articles

The Biology of IBS: How the Gut-Brain Axis Actually Works
IBS involves visceral hypersensitivity, gut motility changes, and gut-brain signaling. Explore the biology behind IBS — not a diagnosis guide.
Cardiovascular Disease & Atherosclerosis: The Biology
How atherosclerosis causes heart attacks and strokes: plaque formation, LDL causality, inflammation, statins, PCSK9 drugs, and heart failure biology.
The Biology of Obesity and Metabolic Syndrome
Obesity is a chronic disease shaped by hormones, brain, and environment. See how leptin, insulin resistance, and visceral fat drive metabolic syndrome.
How GLP-1 Drugs Work: Ozempic, Wegovy & Mounjaro
How GLP-1 drugs like Ozempic, Wegovy, and Mounjaro work: gut-hormone biology, trial results on weight and heart risk, side effects, and open questions.
Sex Hormones Explained — Testosterone and Estrogen
How testosterone, estrogen, and progesterone shape the body, the menstrual cycle, puberty, and menopause — and the science of hormone therapy.
Insulin and Diabetes Explained: Biology, Types, Treatment
How insulin controls blood glucose, why type 1 and type 2 diabetes differ, and how treatment moved from animal extracts to pumps, drugs, and stem cells.