Algorithmic Trading & Neural Networks — How AI Makes Billions Per Second
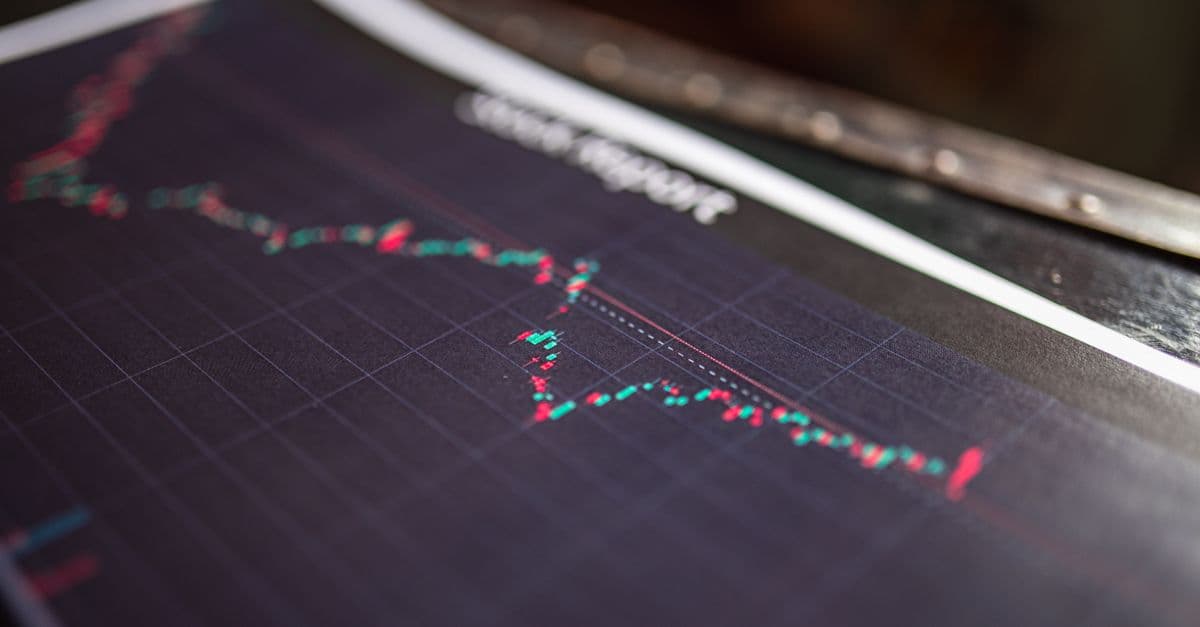
Photo: RDNE Stock project / Pexels
On a normal trading day, the overwhelming majority of orders sent to US stock exchanges are generated, priced and routed by software. No human decides that a particular order for 200 shares should rest at a particular price on a particular exchange for 40 milliseconds and then be cancelled. A program does. Some of those programs are simple rule sets written decades ago. A growing share of the decisions inside them, however, are informed by machine learning models, including neural networks that read the live order book and estimate where the price is likely to tick next.
Educational only — not financial advice. Investing involves risk of loss; past performance does not guarantee future results. Consult a licensed financial advisor before making investment decisions.
This article explains what algorithmic trading actually is, where neural networks fit inside it, what peer-reviewed research says about how well they work, and why regulators worry about the speed and opacity they add to markets. It deliberately avoids the marketing claims that surround the subject. The honest picture is more interesting: the edge is real but thin, it decays as soon as others find it, and the biggest documented failures of automated trading have come from ordinary software bugs and feedback loops rather than from rogue superintelligent models.
Key takeaways
- Algorithmic trading covers everything from simple execution schedules to fully automated market making; high-frequency trading (HFT) is only one subset.
- A 2015 SEC economist's working paper, cited by the Congressional Research Service, estimated HFT at roughly 55% of US equity volume and about 40% in Europe.
- Neural networks are mainly used for short-horizon forecasting from order-book data, for cross-sectional return prediction, and for optimising how large orders are executed.
- Academic studies (Krauss, Do and Huck 2017; Gu, Kelly and Xiu 2020; Sirignano and Cont 2019) find genuine predictive signal, but also that returns shrink over time and are highly sensitive to trading costs.
- The May 6, 2010 Flash Crash and Knight Capital's 2012 software failure, which cost the firm more than $460 million, are the defining case studies in automated-trading risk.
- US rules such as SEC Rule 15c3-5 and market-wide circuit breakers exist specifically to contain these risks.
Foundation: what is algorithmic trading?
Algorithmic trading means using a computer program to make some or all of the decisions involved in a trade: whether to trade, what to trade, how much, at what price, on which venue and over what time window. The term is broad, and it helps to separate the main families.
Execution algorithms
The oldest and most common use is not prediction at all. A pension fund that wants to buy two million shares cannot simply send one giant order; it would push the price up against itself. Execution algorithms slice the parent order into thousands of child orders and release them over time. Classic schedules include VWAP (volume-weighted average price, which trades in proportion to the market's usual intraday volume curve) and TWAP (time-weighted average price, which trades evenly through the day). The goal is to minimise market impact, the price movement your own trading causes.
Rule-based strategies
These follow explicit, human-written logic: "if the 50-day moving average crosses above the 200-day, buy." They are transparent and easy to audit, and for the same reason any edge they once had tends to be competed away quickly.
Statistical arbitrage
Statistical arbitrage looks for temporary mispricings between related securities and bets they will close. Pairs trading is the textbook version: two historically co-moving stocks drift apart, so the strategy buys the laggard and sells the leader. These strategies rely on many small, roughly independent bets, which is why they are natural candidates for machine learning.
Market making and high-frequency trading
Market makers continuously post bids and offers and earn the spread between them, taking on inventory risk in exchange. Modern electronic market making is almost entirely automated and extremely latency-sensitive. HFT is not a strategy in itself but a style: very short holding periods, very high message rates and heavy investment in speed. The Congressional Research Service notes that a 2012 CFTC advisory subcommittee's working definition of HFT explicitly includes "proximity and co-location services," meaning servers placed physically inside or next to exchange data centres.
Machine-learning-driven strategies
Finally, there are strategies in which a learned model, rather than a human rule, produces the forecast or the decision. This is where neural networks enter. The shift matters for oversight: a rule-based system can be explained line by line, while a neural network's output emerges from many thousands or millions of fitted parameters and is much harder to interpret.
Where neural networks fit
If neural networks are new to you, our explainer on how neural networks work covers layers, weights and training. In trading, they are typically applied to three distinct problems.
1. Short-horizon forecasting from the order book
The limit order book is the live list of all resting buy and sell orders on an exchange, organised by price. At any instant it shows how much demand is waiting at each price below the market and how much supply is waiting above it. Every new order, cancellation and trade changes it. For a model, this is a dense, fast-moving, high-dimensional time series.
Researchers feed snapshots of the book (prices and sizes at the top several levels on each side), plus recent trade flow, into a network and ask it to predict whether the next price change will be up or down. The most cited large-scale study of this kind is by Justin Sirignano and Rama Cont, published as "Universal features of price formation in financial markets." Using a very large dataset of quotes and transactions for US equities, they trained a deep learning model and reported three notable findings: a single "universal" model trained on pooled data from many stocks outperformed models trained on individual stocks; it worked reasonably well even on stocks it had never seen in training; and its out-of-sample accuracy stayed fairly stable over time. Longer histories of price and order flow improved forecasts, which the authors read as evidence of path-dependence in how prices form. (arXiv:1803.06917)
Two caveats are important. First, predicting the direction of the next tick slightly better than chance is not the same as making money: the spread and fees may cost more than the signal is worth. Second, these models are only useful to firms that can act within the time window the forecast covers, which brings latency back into the picture.
2. Cross-sectional return prediction
A slower class of models predicts which stocks will outperform others over the next month, using dozens or hundreds of firm characteristics (valuation ratios, momentum, volatility, liquidity and so on). Here the most influential paper is "Empirical Asset Pricing via Machine Learning" by Shihao Gu, Bryan Kelly and Dacheng Xiu, published in the Review of Financial Studies in 2020. They compared linear regressions, penalised regressions, tree methods and neural networks on decades of US stock data. Neural networks and trees performed best, and the authors traced their advantage to capturing nonlinear interactions between predictors. Strikingly, all methods agreed on which signals mattered most: variants of momentum, liquidity and volatility.
3. Execution and reinforcement learning
The third application treats execution as a sequential decision problem. An agent observes the remaining quantity, time left and current market state, chooses how much to trade now, and is rewarded for low total cost. This fits the reinforcement learning framework closely, and it is the same family of techniques covered in our piece on reinforcement learning for portfolio optimisation. Academic work in this area typically benchmarks agents against VWAP and TWAP in simulated or historical markets. Published improvements vary widely by study and setup, and results from simulations do not automatically transfer to live markets, where your own orders change other participants' behaviour.
Model architectures compared
| Architecture | Typical input | Typical use in trading | Strengths | Known weaknesses |
|---|---|---|---|---|
| Feed-forward network (MLP) | Snapshot of features (firm characteristics, book levels) | Cross-sectional return ranking | Simple, fast, captures nonlinear interactions | Ignores time ordering unless features encode it |
| Convolutional network (CNN) | Order-book "images" (price levels by time) | Next-tick direction | Learns local spatial patterns across price levels | Needs lots of data; patterns may be venue-specific |
| LSTM / recurrent network | Sequences of prices, volumes, order flow | Short-horizon forecasting | Explicit memory across time steps | Slow to train; prone to overfitting noisy series |
| Transformer | Long sequences, sometimes text plus prices | Research on longer contexts, news + price fusion | Parallel training, attention over long histories | Data-hungry; evidence in finance still emerging |
| Reinforcement learning agent | Market state + own inventory | Order execution, market making | Optimises a decision, not just a forecast | Simulation-to-reality gap; reward design is hard |
| Gradient-boosted trees (not a neural net) | Tabular features | Often the benchmark to beat | Robust, interpretable feature importance | Less natural for raw sequence data |
The last row matters because in many published comparisons, tree ensembles are as good as or better than neural networks on tabular financial data. The choice of model is an empirical question, not a status symbol.
LSTMs and time series in practice
Long Short-Term Memory networks were designed to keep information across long sequences without the vanishing-gradient problem of plain recurrent networks. That makes them a natural first choice for price series, and they appear in hundreds of trading papers. For general background on the problem they are solving, see our explainer on how time series forecasting works.
One of the most widely cited empirical tests is "Deep neural networks, gradient-boosted trees, random forests: Statistical arbitrage on the S&P 500" by Christopher Krauss, Xuan Anh Do and Nicolas Huck, published in the European Journal of Operational Research (vol. 259, 2017). The authors trained models on lagged returns of S&P 500 constituents, with survivorship bias removed, and traded the stocks each model ranked highest and lowest. A follow-up by Fischer and Krauss (2018) applied LSTMs to the same problem. The broad lessons from this line of work are consistent:
- Signal exists before costs. Models produce statistically significant returns in back-tests.
- Profitability decays. Krauss and colleagues report that profits were declining in the later years of their 1992–2015 sample, consistent with markets becoming more efficient as these techniques spread.
- Costs matter a great deal. Their headline figure, returns above 0.45% per day for their best ensemble, is stated before transaction costs; daily rebalancing strategies trade constantly, so realistic costs can erase much of such an edge.
That pattern, a real but fragile edge, is the central fact about machine learning in trading.
Why the edge is so hard to keep
Several structural forces work against any trading model, neural or otherwise.
Non-stationarity. Financial markets are not physical systems with fixed laws. The relationships a model learns from 2015–2019 data may not hold in 2020, when pandemic volatility triggered market-wide circuit breakers four times in March, or in 2022, when interest rates rose sharply. Models need constant retraining, and retraining on a short window increases overfitting risk.
Low signal-to-noise ratio. In image recognition, a cat is unambiguously a cat. In returns, the predictable component is a tiny fraction of the total variance. Flexible models like deep networks can easily memorise noise, so out-of-sample performance usually falls well short of in-sample performance.
Back-test overfitting. If a researcher tries thousands of model configurations and reports the best, some will look excellent by luck alone. This "multiple testing" problem is well documented in finance research, and it means that any single impressive back-test should be treated sceptically.
Crowding. When many firms trade similar signals, the signal gets priced in faster, and the positions become correlated. When those firms all need to exit at once, the losses compound.
Costs and capacity. A strategy that earns a small amount per trade may work at $10 million and fail at $1 billion, because larger orders move prices more. Liquidity, discussed in our guide to why liquidity matters in markets, sets a hard ceiling on how much money any signal can absorb.
The mechanics of speed: latency and market microstructure
Speed matters most in market making and in what economists call latency arbitrage. US equities trade on more than a dozen exchanges and many off-exchange venues. When the price of a stock moves on one venue, quotes on the others are briefly stale. A firm that sees the move first and trades against the stale quotes earns a small, almost riskless profit; the slower participant whose quote was "picked off" bears the loss.
Eric Budish, Peter Cramton and John Shim analysed this in "The High-Frequency Trading Arms Race," published in the Quarterly Journal of Economics in 2015. Using millisecond-level data, they showed that price correlations between closely related instruments, which look tight at human timescales, break down at very short horizons. That breakdown creates constant arbitrage opportunities available only to the fastest trader, which in turn drives an expensive race for speed. They argued that the race is socially wasteful and proposed replacing the continuous order book with frequent batch auctions held at short discrete intervals, so that competition shifts from speed to price.
For a deeper look at the engineering side of that race, see our companion article on high-frequency trading and the nanosecond arms race.
Smart order routing
Every broker has to decide where to send each order among many venues. Smart order routers weigh displayed prices, fees and rebates, the probability of getting filled and the risk that other traders will detect the order and move away. Machine learning models are increasingly used to predict fill probabilities and short-term price impact for each routing choice. The benefit is measured in fractions of a cent per share, which only adds up to meaningful sums at very large volumes.
Sentiment and alternative data
Some firms supplement price data with text and other "alternative" data: news headlines, company filings, earnings-call transcripts, and datasets such as aggregated card transactions or satellite imagery. Natural language processing models score the tone of text and feed it into forecasts. We cover this specific technique in sentiment analysis for stocks. Alternative data is expensive, often noisy, and raises its own legal questions about how it was collected.
Case studies: when automated trading goes wrong
The Flash Crash of May 6, 2010
The joint SEC–CFTC staff report on the events of May 6, 2010 remains the best primary account of what can happen when automated systems interact under stress. (SEC/CFTC report, September 2010)
According to the report, a large fundamental trader (a mutual fund complex) began an automated program to sell 75,000 E-Mini S&P 500 futures contracts, valued at about $4.1 billion, as a hedge. The algorithm was set to target a percentage of trading volume without regard to price or time. As prices fell and volume rose, it sold faster. High-frequency traders initially bought contracts, then quickly resold them to each other, generating a "hot potato" of volume that the selling algorithm read as liquidity. Between 2:41 p.m. and 2:45 p.m. the E-Mini fell by more than 5% and the SPY exchange-traded fund by over 6%, and in the 20 minutes between 2:40 p.m. and 3:00 p.m., over 20,000 trades across more than 300 securities executed at prices 60% or more away from their 2:40 p.m. values. Some stocks traded at a penny because of "stub quotes," placeholder orders that market makers posted at absurd prices, never expecting them to fill. Exchanges later cancelled many of those trades.
The episode also had a legal epilogue. In November 2016, a London-based trader, Navinder Sarao, pleaded guilty in US federal court to wire fraud and spoofing. According to the US Department of Justice, he admitted using an automated program to place large numbers of orders he did not intend to execute; the CFTC's order found that the program's orders on the day of the Flash Crash were modified more than 81,000 times. Regulators have been careful to describe his conduct as one contributing factor in market conditions that day, not the sole cause.
Knight Capital, August 1, 2012
Knight Capital was one of the largest US equity market makers. On the morning of August 1, 2012, a botched software deployment connected to a new NYSE program reactivated dormant code in one of its order routers. According to the SEC's later order, in roughly the first 45 minutes of trading the router sent more than 4 million orders while trying to fill just 212 customer orders, building unwanted positions worth billions of dollars. Knight lost more than $460 million and had to be rescued. In October 2013, the SEC fined the firm $12 million in its first enforcement action under the market access rule (Rule 15c3-5), finding that its controls were inadequate.
No neural network was involved. That is precisely the lesson: in production trading, plumbing, deployment discipline and kill switches matter at least as much as model sophistication.
August 24, 2015
On the morning of August 24, 2015, the Dow Jones Industrial Average fell more than 1,000 points shortly after the open, and SEC Chair Mary Jo White later noted that some exchange-traded products traded at sharp discounts to their net asset values while Limit Up–Limit Down pauses fired in many securities, most of them ETPs. The Congressional Research Service cites the day as one of the events behind regulators' concern about the link between some aggressive HFT strategies and market fragility, while noting that it did not establish HFT as the cause. (CRS Report R44443) Borrowed money can magnify swings like these; see margin trading and leverage explained.
How common is algorithmic trading?
Precise figures are hard to pin down because "algorithmic" and "high-frequency" have no single legal definition, and much activity is self-classified. The table below gathers figures that have a named source.
| Measure | Figure | Source and year |
|---|---|---|
| HFT share of US equity trading volume | ~55% | Austin Gerig, SEC DERA working paper (2015), cited in CRS Report R44443 (2016) |
| HFT share of European equity volume | ~40% | CRS Report R44443 (2016) |
| Size of the sell program on May 6, 2010 | 75,000 E-Mini contracts (~$4.1 billion) | SEC–CFTC joint staff report (2010) |
| Trades executed 60% or more away from 2:40 p.m. prices, May 6, 2010 | >20,000 trades in >300 securities | SEC–CFTC joint staff report (2010) |
| Orders sent by Knight Capital's faulty router | >4 million in ~45 minutes | SEC enforcement order (2013) |
| Knight Capital trading loss | >$460 million | SEC enforcement order (2013) |
| CME/ICE average order entry time | under 1 millisecond | Exchange statements cited in CRS R44443 (2016) |
Older claims that circulate online, such as precise percentages of trades "executed by neural networks," generally have no traceable primary source and are best ignored.
The regulatory landscape
United States
Rule 15c3-5 (the market access rule). Adopted by the SEC on November 3, 2010, it requires broker-dealers with direct market access, including those who provide "sponsored access" to clients, to maintain pre-trade risk controls that block orders breaching credit or capital limits or that appear erroneous, and to restrict access to trading systems to authorised people. Controls must be under the broker-dealer's direct and exclusive control, reviewed regularly, and certified annually by the chief executive. (SEC rule page) Note that this is an Exchange Act rule, not a Dodd-Frank provision as is sometimes claimed.
Circuit breakers. Market-wide circuit breakers are keyed to the S&P 500: a 7% fall from the prior close halts trading for 15 minutes, a 13% fall triggers another 15-minute halt, and a 20% fall closes the market for the rest of the day. Level 1 was triggered on four days in March 2020. Single stocks are governed separately by the Limit Up–Limit Down mechanism, which pauses trading when a stock moves outside a price band.
Anti-manipulation law. Spoofing, placing orders you intend to cancel in order to move the price, was explicitly prohibited in US futures markets by the Dodd-Frank Act of 2010 and is prosecuted as fraud in other contexts, as the Sarao case shows. Algorithms that manipulate are treated exactly as human manipulators are.
Ongoing review. In August 2020, SEC staff published a report on algorithmic trading in US capital markets, required by Section 502 of the Economic Growth, Regulatory Relief, and Consumer Protection Act of 2018. Its summary found that algorithmic trading has improved many measures of market quality and liquidity in normal conditions, while some types may worsen periods of stress.
European Union
The EU's MiFID II framework, applied from January 2018, imposes explicit requirements on firms engaged in algorithmic trading: testing of algorithms before deployment, pre-trade controls, kill-switch capability, and notification of regulators. Firms engaged in HFT must keep time-stamped records of orders. These rules are more prescriptive than the US approach, which relies more on broker-level controls and exchange rules.
Fairness, efficiency and systemic risk
The debate over algorithmic trading is not settled, and both sides have evidence.
Arguments that it helps. Bid-ask spreads for liquid stocks narrowed dramatically as trading became electronic, which lowers costs for ordinary investors buying through index funds and brokerage accounts. The 2020 SEC staff report concluded that algorithmic trading improved many measures of liquidity in normal conditions. Automated market makers also quote continuously in thousands of securities that would otherwise have sparse human coverage.
Arguments that it harms. Budish, Cramton and Shim argue that the speed race transfers money from slower investors to the fastest firms without improving price discovery. Liquidity supplied by algorithms can vanish when it is most needed, as on May 6, 2010. And the opacity of learned models makes it harder for firms themselves, let alone regulators, to predict how a strategy will behave in an unprecedented situation.
Concentration. A relatively small number of firms account for a large share of electronic market making. If several of them withdrew simultaneously during a shock, liquidity could thin quickly. This is a risk regulators monitor, but it is difficult to quantify from public data.
Common misconceptions
"AI trading bots reliably beat the market." The academic record shows modest, decaying, cost-sensitive edges, mostly captured by firms with very low costs and large scale. Products marketed to individuals with promises of consistent returns deserve deep scepticism; the US SEC and FINRA regularly warn about fraudulent "AI" investment schemes. Our article on crypto trading bots looks at this claim in the crypto market specifically.
"Neural networks caused the Flash Crash." The SEC–CFTC report describes a volume-targeting execution algorithm, HFT inventory dynamics, liquidity withdrawal and stub quotes. It does not attribute the event to neural networks.
"Faster is always better for markets." Speed lowers some costs but also fuels an arms race whose social value economists dispute.
"A great back-test proves a strategy works." Back-tests are vulnerable to overfitting, look-ahead bias, survivorship bias and unrealistic cost assumptions. Many published strategies weaken after publication.
The future: transformers, foundation models and oversight
Transformer architectures, the same family behind large language models, are being tested on financial time series and on combinations of text and prices. Their attention mechanism can, in principle, weigh distant events in a long history. As of 2026, the published evidence that they consistently beat simpler models on financial data is still mixed, and their appetite for data is a poor fit for a domain where the useful history is short and keeps changing.
The more consequential change may be in oversight. Regulators increasingly expect firms to explain, test and document their models, to monitor them for drift, and to show that controls can stop an algorithm before it harms the market. Model risk management, long standard in banking, is spreading to trading.
For readers who want the broader conceptual foundation, our introduction to what machine learning is and our explainer on how the stock market works are good starting points.
FAQ
Q: Is algorithmic trading legal? A: Yes. Using software to make and route trading decisions is legal in the US and EU, subject to rules such as SEC Rule 15c3-5 and MiFID II. Manipulative conduct, such as spoofing, is illegal whether a human or an algorithm does it.
Q: Do neural networks actually beat the market? A: Studies such as Gu, Kelly and Xiu (2020) and Krauss, Do and Huck (2017) find real predictive signal in back-tests, but returns tend to fade over time and are very sensitive to trading costs. Persistent profits are concentrated among firms with large scale, low costs and constant research.
Q: What caused the 2010 Flash Crash? A: The SEC–CFTC staff report describes a large automated sell program in E-Mini futures that interacted with high-frequency traders and evaporating liquidity, pushing some stocks to absurd prices within minutes. A trader later admitted to spoofing that day, which regulators treat as a contributing factor.
Q: What is the difference between algorithmic trading and high-frequency trading? A: Algorithmic trading is any trading in which software makes decisions. High-frequency trading is a subset characterised by very short holding periods, very high order rates and investment in low latency, such as co-located servers.
Q: Could algorithms crash the market again? A: Disorderly episodes remain possible. Since 2010, regulators have added Limit Up–Limit Down bands, revised market-wide circuit breakers and pre-trade risk controls, which are designed to slow or halt trading before errors spread, but they cannot eliminate every failure mode.
Q: Why are tree-based models often used instead of neural networks? A: On tabular financial data, gradient-boosted trees and random forests are frequently competitive with neural networks, cheaper to train and easier to interpret, so many studies use them as the benchmark to beat.
Conclusion
Neural networks have become one useful tool among many in algorithmic trading: for reading order books, ranking stocks and executing large orders with less impact. The research shows that they can find patterns humans miss, but it also shows those patterns are faint, crowded and short-lived. The largest documented disasters in automated trading came from feedback loops and software errors, which is why so much regulation targets controls, testing and circuit breakers rather than the models themselves. For individual investors, the practical takeaway is understanding, not imitation: much of the evidence suggests that trying to out-trade professional algorithms is very hard, which is part of why many people instead rely on low-cost approaches such as those described in how index funds track markets.
Read next:
Sources
- SEC and CFTC staff, Findings Regarding the Market Events of May 6, 2010 (2010): https://www.sec.gov/news/studies/2010/marketevents-report.pdf
- SEC, Risk Management Controls for Brokers or Dealers with Market Access (Rule 15c3-5): https://www.sec.gov/rules-regulations/2011/06/risk-management-controls-brokers-or-dealers-market-access
- Sirignano, J. and Cont, R., "Universal features of price formation in financial markets": https://arxiv.org/abs/1803.06917
- Congressional Research Service, High Frequency Trading: Overview of Recent Developments, R44443 (2016): https://www.everycrsreport.com/reports/R44443.html
Follow new articles
Add SciHub101 to your feed reader to see new science and technology stories.
About the Author
SciHub101 is an independent science and technology publication founded and edited by Buğra Sözeri, a software engineer and app developer based in Türkiye. AI tools assist with drafting and research. Source documentation in the existing archive is uneven, and articles are being reviewed and corrected. The Editorial Team byline identifies editorial responsibility; it does not certify specialist or independent human review. Where we compare products, anything built by our own team is labelled as such — see the editorial guidelines and About page for how corrections and disclosures work.
Related Articles
Deep Learning vs. Black-Scholes: How Neural Networks Are Repricing Derivatives
Deep learning models now price options faster and more accurately than classic formulas, reshaping how Wall Street trades trillions in derivatives.

Fraud Detection & Anomaly Learning — How AI Catches Financial Crime
AI fraud detection scores each payment in milliseconds, but fraud is rare, criminals adapt, and scams that customers approve themselves slip past transaction models. Here is how the machinery works and where it breaks.

Crypto Trading Bots and Machine Learning: Separating Hype from Reality
Machine learning crypto bots promise alpha in chaotic markets, but most retail traders lose money. Here's what actually works — and what doesn't.

High-Frequency Trading and Neural Networks: The Nanosecond Arms Race
High-frequency trading firms compete on delays measured in millionths of a second. Neural networks are the newest tool in that race, and the evidence on what they add is more modest than the legend.

The History of Artificial Intelligence: A Complete Timeline
From Turing's 1950 paper to GPT-4, trace the breakthroughs, winters, and renaissance that shaped modern AI.

AI Training vs. Inference: What Actually Happens When AI Learns and Thinks
Training and inference are two fundamentally different computational processes. Understanding the distinction explains most of how AI systems work and cost.