What Is a Pulsar Timing Array? How Millisecond Pulsars Detect Gravitational Waves
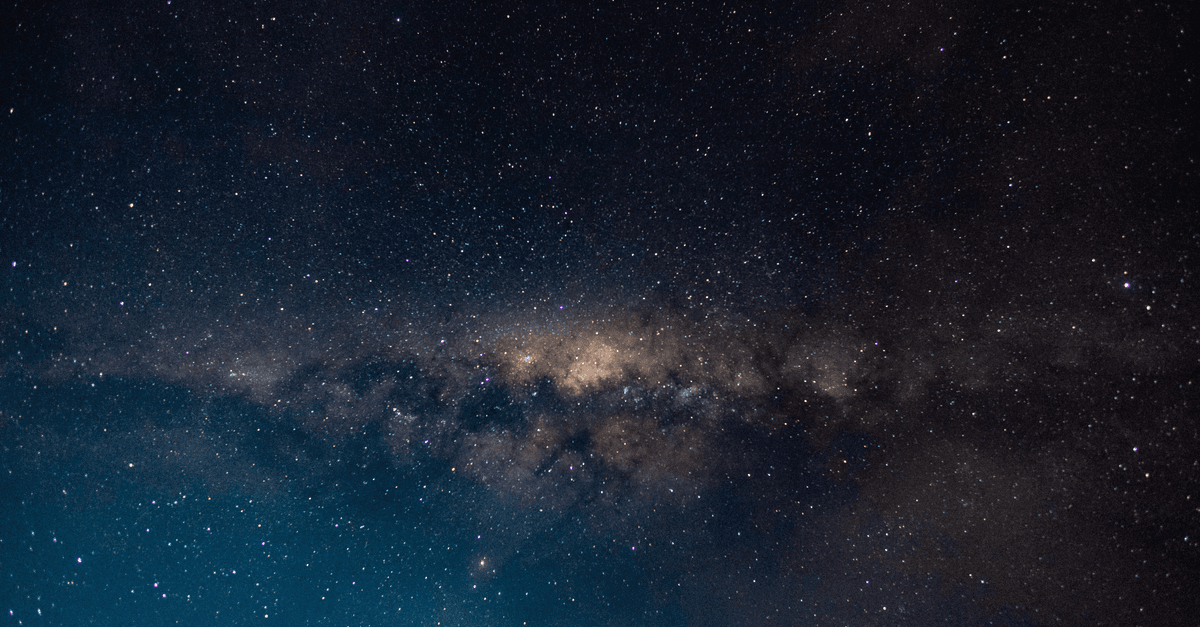
Photo: Ndumiso Mvelase / Pexels
A pulsar timing array is a gravitational wave detector built from the sky itself. Radio astronomers time the pulses of dozens of rapidly spinning neutron stars, called millisecond pulsars, to a precision of fractions of a microsecond for years on end, and look for tiny delays that appear in many pulsars at once. At the end of June 2023, four collaborations reported such a pattern, evidence for a "hum" of gravitational waves with periods of years. This article explains how the technique works, how strong the evidence is, and what could be making the signal.
The basic idea: a galaxy-sized ruler
Ground-based detectors such as LIGO measure how a passing gravitational wave stretches a 4-kilometer arm by a tiny fraction. A pulsar timing array uses a longer arm: the distance between Earth and a pulsar, typically thousands of light-years. A gravitational wave crossing that path slightly changes how long each radio pulse takes to arrive, and astronomers watch for that change.
The concept dates to the late 1970s, when Mikhail Sazhin and Steven Detweiler proposed using pulsars this way. In 1983, Ronald Hellings and George Downs showed that a background of gravitational waves would leave a distinctive pattern, one that depends only on the angle between pairs of pulsars on the sky (Pulsar timing array). That pattern, now called the Hellings-Downs curve, is what modern searches look for.
Think of a calm pond with several corks floating at different spots. A single cork bobbing could be wind, a fish, or a passing duck. If every cork bobs in a specific, predictable relationship to its neighbors, you can be confident that waves are crossing the whole pond. A pulsar timing array does the same with a galaxy of "corks," and the relationship between them is the signature of gravitational waves rather than local noise.
Why millisecond pulsars make good clocks
Pulsars were discovered in 1967 by Jocelyn Bell Burnell, who noticed a regular radio pulse in her chart recordings; the story is told in the article on the Bell Burnell pulsar discovery. A pulsar is a supernova. About 20 km wide but containing more mass than the Sun.">neutron star, the collapsed core of a massive star, with a strong magnetic field that beams radio waves from its poles. As the star spins, the beam sweeps across Earth like a lighthouse, and we see a pulse each rotation.
Ordinary pulsars spin about once a second and slow down as they lose energy. Millisecond pulsars (MSPs) are different. They are old neutron stars that were "recycled": matter from a companion star in a close binary spiraled in and spun them up. MSPs have rotation periods under about 10 milliseconds, and the fastest known, PSR J1748-2446ad, spins 716 times per second (Millisecond pulsar). Their spin is so steady that averaged over decades, their timing is comparable to atomic-clock time standards. For a close look at why that stability is possible, see how pulsars keep such accurate time.
One of the best-studied MSPs, PSR J0437-4715, spins every 5.757 milliseconds and lies about 156 parsecs (510 light-years) away. Its long-term timing stability is comparable to the best atomic clocks (PSR J0437-4715). Clocks like that can reveal changes in arrival time of tens of nanoseconds, small enough to matter.
What gets in the way
A pulsar is not a perfect clock, and a good part of pulsar timing is the art of removing everything that is not a gravitational wave. The main complications are these:
- Interstellar dispersion. The thin plasma between stars delays low-frequency radio waves more than high-frequency ones. The delay changes as the pulsar, the Earth, and the plasma move, so arrays observe at several frequencies (NANOGrav's data span 327 MHz to 3 GHz) to measure and subtract it (Agazie et al., 2023).
- Red noise. Some pulsars show slow, random wandering in their spin. In the NANOGrav 15-year data set, 23 pulsars show detectable red noise.
- Binary effects. Many MSPs orbit a companion. The orbital motion and the companion's gravity change pulse arrival times and have to be modeled.
- Radio instrument effects. Clock errors, telescope behavior, and the ionized solar wind all leave signatures that must be handled.
After a careful model of the pulsar's spin, position, motion, orbit, and propagation delays is fitted, what remains are the timing residuals: the difference between when each pulse arrived and when the model said it should. A gravitational wave would hide in those residuals.
How a gravitational wave shifts pulse arrival times
A gravitational wave is a ripple of spacetime that stretches space in one direction while squeezing it in the perpendicular direction. When one crosses the line between a pulsar and Earth, the light-travel time for pulses changes slightly. The timing residual is of order the wave's strain (its fractional stretch, h) divided by the angular frequency of the wave.
A rough calculation shows the scale. A wave with a frequency of 10 nanohertz has a period of about 3.2 years and a wavelength of about 3 light-years. If its strain is 10-15, the residual it produces is roughly h/(2πf), about 16 nanoseconds. That is within reach of the best pulsars, and it matches the "tens of nanoseconds" scale quoted for the effect (Pulsar timing array). This is an order-of-magnitude estimate; real analyses model the full signal.
Two consequences follow:
The frequency range is set by the observing campaign. The lowest frequency a PTA can test is about one cycle over the whole data span, so a 15-year dataset reaches down to about 2 nanohertz. The highest is limited by how often the pulsars are timed. NANOGrav observes most sources about once a month. Compare this with LIGO's band of tens to hundreds of hertz, many orders of magnitude higher.
The source types are different. LIGO hears a stellar-mass black hole pair in its last seconds, as in the first gravitational wave detection. PTAs listen for slowly orbiting pairs of black holes millions or billions of times heavier, whose orbits take years.
The Hellings-Downs curve: the fingerprint of a background
A single pulsar's wandering can have a dozen causes. A gravitational wave background has a unique property: it affects all pulsars at once, and the way two pulsars' residuals are correlated depends only on the angle between them in the sky. For an isotropic background of gravitational waves in general relativity, the expected correlation is given by
$$\Gamma(\zeta) = \tfrac{1}{2} + \tfrac{3}{2},x \ln x - \tfrac{x}{4}, \quad x = \frac{1 - \cos\zeta}{2}$$
where ζ is the angle between the pair (Hellings-Downs curve). Values computed from that formula (for two distinct pulsars) are:
| Angular separation | Correlation Γ | What it means |
|---|---|---|
| 0° | +0.50 | Pulsars in the same direction share the wave strongly |
| 30° | +0.21 | Still positively correlated |
| 49° | about 0 | The correlation crosses zero |
| 60° | -0.08 | Slightly anticorrelated |
| 82.5° | -0.15 | The minimum of the curve |
| 90° | -0.14 | Mildly anticorrelated |
| 120° | -0.01 | Nearly back to zero |
| 150° | +0.17 | Positive again |
| 180° | +0.25 | Pulsars on opposite sides of the sky |
The unusual shape arises because gravitational waves are quadrupolar. A wave stretches space along one axis and squeezes it along another, so pulsars in different directions feel opposite effects. A shared clock error would instead correlate every pulsar with every other equally, and a shared error from the solar system ephemeris (the tables of planet positions used to convert arrival times to the Sun's frame) would produce a dipole pattern. Only gravitational waves produce this specific curve.
An analogy helps. Imagine a crowd doing "the wave" in a stadium, not as one block but as a pattern of seats rising and falling. Two people sitting side by side go up and down together. Two people far apart may go in opposite directions. Measuring many pairs, you could tell the shape of a wave from random fidgeting. The Hellings-Downs curve is the stadium wave for spacetime.
What the 2023 results showed
Around June 28 to 29, 2023, the major collaborations released their papers together. Each looked at its own pulsars, but all reported a common low-frequency signal whose correlations were consistent with the Hellings-Downs pattern. They differ in the evidence's strength.
| Collaboration | Pulsars and span | Reported evidence |
|---|---|---|
| NANOGrav (15-year data) | 68 MSPs, up to nearly 16 years; 67 used in the background search | About 3 to 4 sigma for the Hellings-Downs correlations (p about 10-3); amplitude 2.4 (+0.7, -0.6) x 10-15 at a frequency of one cycle per year |
| European PTA with Indian PTA | 25 EPTA pulsars, with Indian PTA data for 10 of them; 24.7-year dataset | About 3 sigma for the 10.3-year subset with modern instruments; amplitude near 2.5 (+/-0.7) x 10-15 |
| Parkes PTA (DR3) | 30 MSPs, about 18 years | About 2 sigma; amplitude 2.04 (+0.25, -0.22) x 10-15 for the standard spectral shape |
| Chinese PTA (FAST) | FAST data, first release | 4.6 sigma at one frequency near 14 nanohertz using a discrete-frequency method |
Sources: NANOGrav and data set; EPTA; PPTA; CPTA.
The numbers are not directly comparable, because the teams used different pulsars, noise models, and statistics. Read together, though, they point the same way: independent telescopes in North America, Europe, Australia, India, and China see a common signal at similar amplitude. That independence matters, because a local instrumental artifact would be unlikely to match across continents.
Evidence, not discovery
None of the announcements used the word "detection." In physics, a discovery claim typically requires 5 sigma, a chance of less than about one in 3.5 million of a statistical fluke. At roughly 2 to 4.6 sigma, the 2023 results were called evidence.
Later work has narrowed the gap but not closed it. The MeerKAT Pulsar Timing Array in South Africa released 4.5 years of data on 83 pulsars and found a correlation at 3 to 3.4 sigma in its most significant model, though the result weakened under other noise assumptions (MeerKAT PTA). A late-2025 analysis combined data from five arrays, 121 pulsars in total, more than any single array's. It found a nonzero signal whose correlations match the Hellings-Downs prediction, with significance still below 5 sigma (Yu and Allen, 2025). A combined International Pulsar Timing Array dataset, IPTA DR3, is the next major step.
What produces the signal?
The leading explanation is a population of supermassive black hole binaries. Nearly every large galaxy hosts a black hole millions to billions of times the Sun's mass at its center. When galaxies merge, their central black holes sink together, form a bound pair, and spiral inward. Each pair radiates gravitational waves, and the overlapping signals of countless pairs across the universe add up to a random, continuous background. Our article on galactic cannibalism describes how the Milky Way's own history of mergers fits that picture.
The expected spectrum of such a background follows a simple power law, with characteristic strain proportional to f-2/3. The NANOGrav analysis used that shape as its baseline, and reported that binary-population models can reproduce both the amplitude and the shape of the observed spectrum. The same paper notes that the amplitude requires either several model parameters at the edges of their expected values or a few that differ notably from standard expectations, and that the signal's origin is not yet definitively established (NANOGrav implications paper).
The final parsec problem
A theoretical wrinkle sits underneath the black hole explanation. Dynamical friction and stellar encounters can bring two black holes to within a few parsecs of each other, but gravitational waves only drain significant energy once they are far closer, a small fraction of a parsec apart. In between, the stars and gas that carried away energy may have been depleted, leaving the pair stuck. Proposed solutions include more stars passing close to the pair, gas inflow from a surrounding disk, and a third black hole that perturbs the orbit (Final parsec problem).
If merging black hole pairs routinely stalled, the background would be expected to be weaker, so a strong background is sometimes read as a hint that binaries do not stall for long. That makes the PTA result a probe of black hole growth. The article on the biggest black holes ever found gives a sense of how massive the candidates can be.
Beyond black holes: new physics
Not everyone is convinced that known astrophysics is the whole story. Researchers compared the NANOGrav signal with models from early-universe physics:
- Cosmic strings, hypothetical thin defects left over from a phase transition.
- Domain walls, sheet-like defects from another kind of early-universe transition.
- First-order phase transitions, in which bubbles of a new phase nucleate and collide.
- Inflationary gravitational waves, produced during the burst of expansion described in the article on cosmic inflation.
In the NANOGrav study, all tested cosmological models except stable cosmic strings of field-theory origin could reproduce the signal. Many fit better than the baseline black hole model, by factors of roughly 10 to 100, but the authors stressed that this depends strongly on assumptions about the black hole population and "should not be regarded as evidence for new physics" (Afzal et al., 2023).
In plain terms: the data allow several explanations, and nothing yet singles one out. The test is to measure the shape of the spectrum, where black holes and cosmological sources differ, and to look for individual loud binaries. A background built from countless binaries is smooth and statistical. A background that includes a few exceptionally massive nearby pairs would show up as bright spots on the sky.
Hunting individual binaries
Resolving a single binary above the background would be the equivalent of LIGO's first merger: a discrete source with a known location. Candidate systems exist at optical wavelengths. The blazar OJ 287 shows a roughly 12-year pattern of double-peaked flares, interpreted by some groups as a smaller black hole punching through the disk of a much larger one, with a primary mass near 18 billion solar masses. That reading is disputed: a predicted outburst in October 2022 was not seen, according to one team, and others interpret the same event differently (OJ 287). Whether these systems appear in PTA data is a question for longer datasets.
Optical surveys of quasars and other active galactic nuclei may also help point arrays toward the nearest, loudest sources.
The telescopes behind the arrays
A PTA is only as good as the radio telescopes that feed it. The main groups and their instruments are:
| Array | Main instruments | Note |
|---|---|---|
| NANOGrav | Green Bank Telescope, Very Large Array, and, until 2020, Arecibo | Dataset covers 2004 onward with three telescopes |
| European PTA (EPTA) | Westerbork, Effelsberg, Lovell, Nançay, and Sardinia telescopes | Long baseline, up to 24.7 years in the 2023 release |
| Parkes PTA (PPTA) | The 64-meter Murriyang telescope in New South Wales, Australia | Southern-sky coverage |
| Indian PTA (InPTA) | The upgraded Giant Metrewave Radio Telescope, 30 dishes of 45 meters near Pune | Low-frequency data help correct for dispersion |
| Chinese PTA (CPTA) | FAST, 500 meters in diameter, with a 300-meter illuminated aperture, in Guizhou | Declared fully operational in January 2020 |
| MeerKAT PTA | MeerKAT array in South Africa | 83 pulsars in its 4.5-year release |
The Arecibo Observatory's 305-meter dish collapsed on December 1, 2020, after a series of cable failures (Arecibo Telescope). It had been one of NANOGrav's telescopes, and its loss is one reason combining data from several arrays matters.
All of these groups cooperate through the International Pulsar Timing Array. Pooling data raises the number of pulsars, covers more of the sky, and, because different telescopes view a pulsar through different instruments, helps separate real signals from instrument-specific noise. The CPTA and FAST are of particular interest, because FAST's collecting area lets it time faint pulsars precisely. For a broader look at the dishes, see our overview of how radio telescopes work.
What comes next
Longer baselines. Sensitivity to a background grows quickly with observing time. Each added year improves both the number of low frequencies probed and the signal-to-noise ratio of the Hellings-Downs measurement.
More pulsars and the Square Kilometre Array. The SKA is under construction in Australia and South Africa. Its sensitivity should let arrays time faint pulsars more precisely than today.
LISA. ESA adopted the Laser Interferometer Space Antenna in January 2024. It will use three spacecraft separated by 2.5 million kilometers to detect gravitational waves at frequencies far below those of ground-based detectors, with a launch planned for 2035 (ESA). LISA's band lies between PTAs and LIGO. Together the three would cover the gravitational wave spectrum from nanohertz to kilohertz, with PTAs sensing the heaviest, slowest binaries. For the ground-based end, see machine learning and LIGO gravitational wave detection.
Other tests of gravity with pulsars
Pulsar timing does more than hunt for waves. Two examples show how far the precision goes.
The Hulse-Taylor binary pulsar, discovered in 1974, loses orbital energy at a rate that matches general relativity's prediction of gravitational wave emission to about 99.8 percent in a 2016 analysis; its orbit shrinks by roughly 76.5 microseconds per year. Hulse and Taylor won the 1993 Nobel Prize in Physics for it (Hulse-Taylor pulsar).
The pulsar PSR J0740+6620 has a mass of 2.08 (+/-0.07) solar masses, measured through the Shapiro delay, the extra time its pulses take to pass through the curved spacetime near its white dwarf companion (PSR J0740+6620). That makes it among the heaviest neutron stars known, which constrains how matter behaves at extreme densities.
Common misconceptions
"Pulsar timing arrays detect individual black hole mergers." Not yet. What has been seen is a statistical background from many binaries, or possibly something else. Resolving a single source is a future goal.
"The 2023 result is a confirmed detection." The teams called it evidence. Single-array significance ranged from about 2 to 4.6 sigma, and the combined analyses remain below the 5 sigma convention.
"The signal proves new physics." The data are consistent with black hole binaries, and the study that found better fits for cosmological models cautioned that the result depends on assumptions about the black hole population.
"A passing wave makes every pulsar shift the same way." It does not. The Hellings-Downs curve includes negative values, so some pairs of pulsars are anticorrelated. A shift that was identical in every pulsar would point to a clock error instead.
Frequently asked questions
Q: What is a pulsar timing array? A: A pulsar timing array is a set of precisely timed millisecond pulsars used as a galaxy-scale gravitational wave detector. Astronomers look for correlated shifts in the pulses' arrival times that follow the Hellings-Downs pattern, which is the signature of a gravitational wave background.
Q: Why use millisecond pulsars rather than ordinary pulsars? A: Millisecond pulsars spin in under about 10 milliseconds and are extraordinarily stable, with timing comparable to atomic clocks over decades. Ordinary pulsars slow down and wander more, which would swamp a signal measured in tens of nanoseconds.
Q: What frequencies do pulsar timing arrays detect? A: They detect nanohertz gravitational waves, with periods of years. A frequency of 10 nanohertz corresponds to a period of about 3.2 years. This is far below LIGO's band and well below the band LISA is planned to cover.
Q: What is the Hellings-Downs curve? A: It is the predicted correlation between timing residuals of two pulsars as a function of the angle between them, for an isotropic gravitational wave background in general relativity. It is +0.5 at zero separation, crosses zero near 49 degrees, reaches about -0.15 near 82.5 degrees, and returns to +0.25 at 180 degrees.
Q: What causes the gravitational wave background? A: The leading candidate is the combined emission of many supermassive black hole binaries. Cosmic strings, phase transitions, and other early-universe processes can also fit the data, but current analyses do not single out any one source.
Q: How strong is the evidence for the background? A: The 2023 results ranged from about 2 sigma (Parkes) to about 4.6 sigma (Chinese PTA at one frequency), with NANOGrav at roughly 3 to 4 sigma. A 2025 five-array analysis of 121 pulsars remained below the 5 sigma convention for a confident detection.
The takeaway
A pulsar timing array turns a weakness into a strength. Gravitational waves with periods of years are far too slow for any laboratory instrument, so astronomers use neutron stars as both the clocks and the arms of the detector, and use the geometry of the sky to tell waves from noise. The Hellings-Downs pattern is the key: noise is local to each pulsar, while a wave is shared, and the angular structure of that sharing is a fingerprint nothing else imitates. The 2023 results show that fingerprint at the level of a strong hint rather than a proof, and by independent routes. Whether it comes from a cosmos full of colliding black holes or from physics in the first moments of the universe will depend on more pulsars, longer baselines, and the careful combination of every array's data.
Related Reading
Follow new articles
Add SciHub101 to your feed reader to see new science and technology stories.
About the Author
SciHub101 is an independent science and technology publication founded and edited by Buğra Sözeri, a software engineer and app developer based in Türkiye. AI tools assist with drafting and research. Source documentation in the existing archive is uneven, and articles are being reviewed and corrected. The Editorial Team byline identifies editorial responsibility; it does not certify specialist or independent human review. Where we compare products, anything built by our own team is labelled as such — see the editorial guidelines and About page for how corrections and disclosures work.
Related Articles

What Is Reionization? The Cosmic Dawn and the First Stars
After the Big Bang's fireball faded, the universe entered a dark age lasting hundreds of millions of years — no stars, no galaxies, just a sea of neutral hydrogen. Then the first stars ignited, and their ultraviolet radiation gradually reionized the cosmos in one of the most dramatic phase transitions in cosmic history.

What Is a Protoplanetary Disk and How Do Planets Form?
Every planet in our solar system grew from a thin disk of gas and dust that surrounded the young Sun 4.6 billion years ago. Modern telescopes now image these disks around other stars in stunning detail, revealing a process far more violent, chaotic, and fast than scientists once imagined.
Stellar vs. Supermassive Black Holes: The Mass Gap Mystery
Black holes come in sizes that span 10 orders of magnitude, from a few solar masses to tens of billions — but the range between roughly 65 and a few hundred solar masses appears nearly empty. A 2020 gravitational wave event punched straight through that forbidden zone, and nobody fully agrees on how.

Neutron Stars Explained: Dense Matter and Cosmic Mergers
Neutron-star interiors remain uncertain. X-ray observations and mergers let researchers test dense-matter models and investigate heavy-element production.

Machine Learning and Gravitational Wave Detection: How AI Listens to the Universe
LIGO's gravitational wave detectors produce a constant roar of noise. Machine learning is the ear that hears the cosmos whispering beneath it.