What Is Spectroscopy? How Light Reveals Everything About the Universe
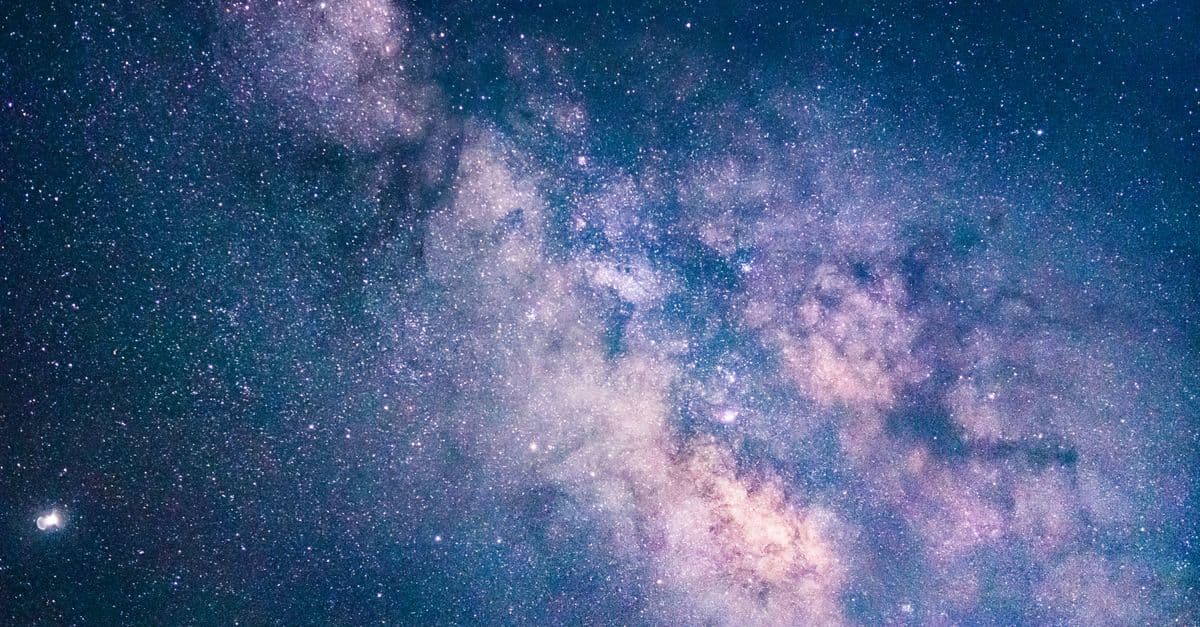
Photo: Felix Mittermeier / Pexels
In his Cours de philosophie positive, published in 1835, the French philosopher Auguste Comte wrote that people would never learn the chemical composition of the stars. Within about three decades, astronomers were doing exactly that. Spectroscopy, the study of how matter emits and absorbs light at specific wavelengths, turned starlight from a pretty glow into a readable document. A spectrograph spreads light into a rainbow, and the dark and bright lines in that rainbow say what the source is made of, how hot it is, and how fast it moves.
If ordinary observation is seeing, spectroscopy is understanding. This article walks through how it works, what the lines mean, and what the technique has revealed from the Sun to the edge of the observable universe.
How a spectrograph turns light into data
White light is a mixture of wavelengths. Visible light runs from about 380 nanometers (violet) to about 700 nanometers (red), and astronomers also work at wavelengths from radio waves to gamma rays. A prism bends different wavelengths by different amounts, and a diffraction grating, the modern workhorse, does the same thing by interference from thousands of fine grooves. Either way, the light fans out into a spectrum.
Think of a bag of mixed marbles dropped down a ramp that sorts them by size. A prism sorts light by wavelength instead. Once the "marbles" are lined up, you can count how many of each kind there are.
A detector then records brightness at each wavelength. The result is a graph: wavelength along the bottom, intensity up the side. Almost everything astronomers say about distant objects comes from reading this graph.
The three kinds of spectra
In the 1850s, Gustav Kirchhoff and Robert Bunsen worked out the rules that connect what a source looks like to the spectrum it produces. Astronomers still use them.
Continuous spectra: temperature on a dial
A hot, dense object such as the interior of a star or a glowing piece of metal emits light at all wavelengths. The shape of that continuous spectrum depends on temperature alone, a relationship described by Max Planck's radiation law from 1900. Hotter objects glow bluer and cooler objects glow redder.
A simple rule, Wien's law, says the peak wavelength in nanometers is about 2,898,000 divided by the temperature in kelvin. For a surface temperature near 5,800 K, the Sun's value, that gives roughly 500 nanometers, in the green part of the spectrum. Measuring where a star's spectrum peaks therefore gives its surface temperature directly.
Absorption spectra: the dark lines
When light from a hot, dense source passes through cooler gas, the atoms in the gas absorb light at specific wavelengths. The spectrum shows dark lines at those wavelengths. William Hyde Wollaston first noted dark features in the solar spectrum in 1802. In 1814, Joseph von Fraunhofer independently rediscovered them, mapped over 570 of them, and labeled the most prominent ones A through K. About 45 years later, Kirchhoff and Bunsen showed that several of these lines match the bright lines emitted by heated elements on Earth, which meant the Sun's atmosphere contained those elements (Wikipedia: Fraunhofer lines).
Emission spectra: the bright lines
A thin, hot gas seen against a dark background emits light only at the same specific wavelengths. This produces bright emission lines. Glowing nebulae, the gas around young stars, and the cores of active galaxies all show emission spectra. The line pattern identifies the gas, and the relative strengths of lines reveal its temperature and density.
| Source type | What you see | Example |
|---|---|---|
| Hot, dense body | Smooth rainbow (continuum) | Glowing metal, the Sun's visible surface |
| Cool gas in front of a hot source | Dark lines on a rainbow | Fraunhofer lines in sunlight |
| Hot, thin gas | Bright lines on a dark background | Emission nebulae |
Why every element has its own fingerprint
The reason atoms leave sharp lines is quantum mechanics. An electron in an atom can occupy only certain energy levels. To jump to a higher level, it must absorb a photon whose energy matches the gap exactly. To drop down, it emits a photon of that same energy. Since each element has its own set of energy levels, it has its own pattern of wavelengths, an identifying barcode that no other element shares. For more on the particle behind this, see our explainer on what a photon is.
Hydrogen shows the logic cleanly. The visible lines of hydrogen, called the Balmer series, come from electrons dropping to the second energy level. The formula is 1/λ = R(1/2² − 1/n²), where R is the Rydberg constant, about 1.097 × 10⁷ per meter, and n is the starting level. For n = 3 the result is a wavelength of about 656 nanometers, a deep red line known as H-alpha.
Laboratory measurements of these wavelengths are the reference. When a star shows a pattern of lines that matches a laboratory element, the element is there, even if the star is trillions of kilometers away.
The key lines in astronomy
| Line | Element | Approximate wavelength | Why it matters |
|---|---|---|---|
| H-alpha | Hydrogen | 656.281 nm | Traces hydrogen gas in stars and nebulae |
| H-beta | Hydrogen | 486.134 nm | Compared with H-alpha to gauge dust reddening |
| H-gamma | Hydrogen | 434.047 nm | Part of the Balmer series |
| Ca II H and K | Ionized calcium | 396.847 and 393.366 nm | Strong in cool stars; a marker of stellar activity |
| Sodium D lines | Sodium | 588.995 and 589.592 nm | Prominent in cool stars and in interstellar gas |
| Magnesium b lines | Magnesium | About 516.7 to 518.4 nm | Sensitive to surface gravity |
Wavelengths from the Fraunhofer lines article on Wikipedia, measured in air.
The element found in the Sun before it was found on Earth
Spectroscopy's most dramatic early success concerned helium. On August 18, 1868, the French astronomer Jules Janssen observed a bright yellow line at 587.49 nanometers in the Sun's chromosphere during a total solar eclipse in Guntur, India. He first assumed it was sodium. On October 20, 1868, the English astronomer Norman Lockyer saw a similar line and called it D3, because it lay near the sodium D lines. Lockyer concluded that it came from an element unknown on Earth and named it helium, from the Greek word for the Sun, helios.
Janssen is often credited jointly with Lockyer, but only Lockyer proposed a new element. Helium was detected on Earth in 1881 by Luigi Palmieri, in gases from Mount Vesuvius, and isolated on March 26, 1895 by the Scottish chemist William Ramsay, who treated the mineral cleveite with acid. Teodor Cleve and Abraham Langlet independently isolated it in Sweden the same year (Wikipedia: Helium). Helium was the first element detected in space before it was found on Earth.
How spectra sorted the stars: the spectral types
Not all stars show the same lines. The pattern depends mostly on temperature, because temperature controls which atoms are ionized and which electron levels are occupied. Astronomers classify stars with the sequence O, B, A, F, G, K, M, from hottest to coolest.
| Class | Effective temperature | Typical features | Examples |
|---|---|---|---|
| O | At least 33,000 K | Weak hydrogen; ionized helium (He II) | 10 Lacertae |
| B | 10,000 to 33,000 K | Neutral helium; moderate hydrogen | Upsilon Orionis |
| A | 7,300 to 10,000 K | Strongest hydrogen lines | Vega, Sirius A |
| F | 6,000 to 7,300 K | Calcium H and K strengthen | 78 Ursae Majoris |
| G | 5,300 to 6,000 K | Strong calcium H and K; neutral metals | The Sun (G2V) |
| K | 3,900 to 5,300 K | Weak hydrogen; neutral metals; titanium oxide bands appear | Epsilon Eridani |
| M | 2,300 to 3,900 K | Strong molecular bands (titanium oxide); hydrogen usually absent | Gliese 581, Betelgeuse |
Source: Wikipedia: Stellar classification. Our article on types of stars covers each class in more detail.
Notice that hydrogen lines are strongest in A stars, not in the hottest or coolest ones. Hydrogen is the most abundant element in nearly every star, but the Balmer lines need atoms with electrons in the second energy level, and only at about 10,000 K are enough atoms in that state. At higher temperatures hydrogen is ionized, and at lower temperatures too few atoms are excited.
The women who read the sky
Angelo Secchi created the first spectral classes in the 1860s and 1870s, and in 1891 Edward Pickering proposed linking Secchi's classes to the modern O class. Harvard's team of "human computers" did the heavy lifting. Williamina Fleming classified most of the spectra in the first edition of the Henry Draper catalogue. Annie Jump Cannon joined the group in 1896. By 1912 she had converted the classes to the modern lettered and numbered form, and the International Astronomical Union adopted her scheme on May 9, 1922. Wikipedia gives her total as about 350,000 stars, though another passage in the same article says 300,000. Either way, she classified a staggering number of stars by eye.
Her recognition came slowly. Cannon received an honorary doctorate from Oxford in 1925, the first woman to receive an honorary doctorate of science from that university, and the Henry Draper Medal in 1931. In 1938 she became the William C. Bond Astronomer at Harvard (Wikipedia: Annie Jump Cannon).
Then came a surprise. In her 1925 doctoral thesis, Cecilia Payne used Meghnad Saha's ionization theory to show that the O-to-M sequence is a temperature sequence, not a composition sequence. Stars differ in their spectra mainly because of how hot they are, not because of what they contain. She concluded that stars are made mostly of hydrogen and helium. The astronomer Henry Norris Russell called the result "spurious" and urged her to drop it, then reached the same conclusion himself in 1929. In 1956 she became Harvard's first woman promoted to full professor in the Faculty of Arts and Sciences (Wikipedia: Cecilia Payne-Gaposchkin). See our profile of Cecilia Payne-Gaposchkin.
An analogy helps. Imagine two cooks following one recipe but baking at different oven temperatures, so one cake comes out pale and the other dark brown. Looking at the cakes, you would be tempted to say the recipes differ. Payne realized that stars were mostly the same recipe baked at different temperatures.
Adding luminosity: the MK system
Temperature is only one dimension. Morgan, Keenan, and Kellman introduced at Yerkes Observatory in 1943 a second label for luminosity class, based on subtle changes in line width and strength that reflect a star's size and surface gravity. It was named the Morgan-Keenan system in 1953. The Sun is G2V, a G2 temperature class and V for main-sequence ("dwarf") star. A giant of the same temperature has narrower lines and a different class number.
Motion in a line: the Doppler shift
If a source moves toward you, its light waves are bunched up and every line shifts toward blue. If it moves away, the waves stretch and the lines shift toward red. This is the Doppler effect, the same reason an ambulance siren drops in pitch as it passes.
For speeds well below the speed of light, the relationship is Δλ/λ = v/c, where Δλ is the shift in wavelength, λ is the wavelength you would see in a lab, v is the velocity along your line of sight, and c is the speed of light.
A worked example: suppose the H-alpha line, which has a laboratory wavelength of 656.281 nanometers, appears in a star's spectrum at 656.481 nanometers. The shift is 0.200 nanometers, and 0.200 divided by 656.281 is about 3.05 × 10⁻⁴. Multiply that by the speed of light, about 299,792 kilometers per second, and the star is receding at about 91 kilometers per second.
Doppler spectroscopy has three major uses:
- Measuring stellar motion. Radial velocities reveal how stars move through the galaxy.
- Weighing binary stars. Stars too close together to separate in a telescope still show periodic shifts as they orbit each other. Those shifts give orbital speeds, and with Kepler's laws they give masses. Stellar mass is the property that determines most of a star's life, so this is a fundamental measurement.
- Finding exoplanets. A planet tugs its star, making it wobble. The wobble is tiny, but a precise spectrograph can detect it. See our guide to how astronomers find exoplanets for how this compares with transit searches.
How precise can it get?
Very. ESO says the HARPS spectrograph can detect stellar motion at about walking pace, 3.5 kilometers per hour, which is about 1 meter per second. ESPRESSO, which saw first light on all four Very Large Telescope units in February 2018, is designed for about 0.35 kilometers per hour, or roughly 10 centimeters per second. Its stated goal is to make very high precision radial-velocity measurements of solar-type stars to search for rocky planets, and it works at a resolving power of about 140,000 in its high-resolution mode (ESO). The conversion to meters per second is arithmetic on ESO's figures.
The expansion of the universe
When Vesto Slipher measured the spectra of spiral nebulae, most were redshifted, meaning they were moving away. In 1929 Edwin Hubble combined such velocities with distance estimates and found that farther galaxies recede faster, the relationship that anchors the expanding universe. Today the work is done at industrial scale. As of April 15, 2026, the Dark Energy Spectroscopic Instrument (DESI) had observed over 47 million galaxies and quasars and over 20 million stars, beating its original target of 34 million, in order to build a three-dimensional map out to 11 billion light-years (DESI). For the human side of this story, read about Edwin Hubble.
A caution: for very distant galaxies the simple formula fails, because the shift is not a motion through space but the stretching of space itself, and redshift is quoted as z = Δλ/λ without converting it into a velocity.
More than speed: what else a spectrum contains
A spectrum is dense with information. Here is a decoder.
| Feature in the spectrum | What it tells you |
|---|---|
| Shape of the continuum | Surface temperature |
| Which lines appear | Composition and ionization state |
| Relative line strengths | Temperature, pressure, and abundances |
| Position shift of lines | Line-of-sight velocity |
| Width of lines | Rotation speed, turbulence, gas pressure |
| Splitting of lines in a magnetic field | Magnetic field strength |
| Ratios of emission lines | Gas temperature, density, ionization source |
Line width. A rapidly spinning star has one edge moving toward us and the other away, so its lines are blurred out. A broader line means faster rotation. Dense, high-pressure atmospheres broaden lines by collisions, which is how giants and dwarfs of the same temperature can be told apart.
Magnetic fields. In 1896, Pieter Zeeman observed that spectral lines split in a magnetic field, and he shared the 1902 Nobel Prize in Physics with Hendrik Lorentz for the work. George Ellery Hale was the first to notice the Zeeman effect in solar spectra, showing that sunspots host strong magnetic fields (Wikipedia: Zeeman effect). The splitting scales with field strength, so a spectrograph doubles as a magnetometer on stars we can never visit.
Chemical abundances. Astronomers fit model atmospheres to the observed line strengths and solve for how much of each element is present. Abundances are usually quoted relative to hydrogen and to the Sun. The standard shorthand [Fe/H] compares iron to hydrogen on a logarithmic scale: 0 means solar iron content, and −2 means one hundredth of solar. Stars with low [Fe/H] are typically old, formed from gas that earlier generations of stars had not yet enriched with heavy elements.
Cosmic clocks. The ratio of alpha elements (oxygen, magnesium, silicon, and others) to iron works as a chemical clock. Core-collapse supernovae make mostly alpha elements quickly, while Type Ia supernovae, which take longer, make mostly iron. Stars born early are rich in alpha elements, and stars born later have more iron relative to them. To see where those elements are forged, read what nucleosynthesis is.
Spectroscopy beyond stars
Exoplanet atmospheres
When a planet crosses in front of its star, a small fraction of starlight filters through the planet's atmosphere. Gases in that atmosphere absorb specific wavelengths, so the apparent size of the planet changes slightly with wavelength. This is transmission spectroscopy. The technique has matured quickly with the James Webb Space Telescope. JWST's observations of the hot Jupiter WASP-39b, about 700 light-years away, produced the first clear evidence for carbon dioxide in an exoplanet atmosphere, announced in August 2022, and the first detection of sulfur dioxide on any planet outside the solar system, pointing to chemistry driven by starlight (Wikipedia: WASP-39b).
The same technique is also a good lesson in caution. JWST data indicated methane and carbon dioxide at roughly 1 percent each on K2-18b, a sub-Neptune about 124 light-years away that orbits a red dwarf, though later observations cast doubt on the carbon dioxide. A 2025 report of dimethyl sulfide, a molecule that on Earth is made by life, was controversial, and no claim of life on K2-18b has been widely accepted (Wikipedia: K2-18b). Faint signals in noisy data are easy to over-read, and different data-processing methods can give different answers. For the detection methods in detail, see how astronomers detect exoplanet atmospheres and biosignatures and our piece on the instrument itself, the James Webb Space Telescope.
Nebulae and ionized gas
Emission nebulae are read through their bright lines. The ratio of lines from the same ion that arise at different energies gives the gas temperature, while ratios of lines sensitive to collisions give density. A famous diagnostic, the BPT diagram, plots [O III] to H-beta against [N II] to H-alpha and separates star-forming regions from gas excited by an active galactic nucleus. The square brackets mark "forbidden" lines, which are so improbable on Earth that they appear only in the extremely thin gas of space.
Quasar absorption and the cosmic web
Light from a distant quasar passes through gas clouds on its way to Earth. Each cloud imprints absorption lines at a wavelength set by its own redshift, creating a dense "forest" of hydrogen lines. The statistics of the forest map how hydrogen is spread through the cosmic web, and lines from heavier elements trace how galaxies enriched their surroundings in different eras.
The cosmic microwave background
Even the oldest light in the universe has a spectrum. NASA's Cosmic Background Explorer measured the microwave background and found that it fits a blackbody curve at about 2.73 K. John Mather and George Smoot shared the 2006 Nobel Prize in Physics for the blackbody form and the tiny temperature variations of this radiation, which the Nobel committee described as the starting point for cosmology as a precision science (Wikipedia: COBE). Any measured departure from a perfect blackbody would reveal energy injected into the early universe, so future experiments aim to look for such distortions.
Instruments: from prisms to integral-field spectrographs
Echelle spectrographs. These use a coarsely ruled grating at a steep angle and a second dispersing element, which stacks many spectral orders on the detector and covers a wide range of wavelengths in high detail. HARPS and ESPRESSO are echelle designs, built to hunt for tiny Doppler shifts.
Integral field units. Instead of one spectrum for a point of light, an integral field unit records a spectrum for every point in a patch of sky, producing a three-dimensional data cube with two spatial dimensions and one of wavelength. The MUSE instrument at the Very Large Telescope covers 465 to 930 nanometers, measures over 4,000 wavelength samples, and splits its field into 24 channels of 48 mini-slits each, 1,152 in total (ESO). Think of a photograph in which every pixel is itself a full spectrum.
Multi-object spectrographs. Fiber-optic systems with robotic positioners point thousands of fibers at individual galaxies at once and feed their light into shared spectrographs. This is how surveys like DESI collect tens of millions of spectra.
Space-based infrared spectrographs. The Earth's atmosphere absorbs and glows at infrared wavelengths, so JWST and other space telescopes can observe features ground telescopes cannot. See how space telescopes see in infrared.
What spectroscopy cannot do easily
Spectroscopy is powerful but not magic. Several limits matter in practice:
- Light is averaged. A spectrum adds up all the light along the line of sight, so separating overlapping sources or layers of gas requires modeling.
- Faint objects need lower resolution. Resolving fine detail takes a lot of light. Faint and distant targets are usually observed with coarser spectrographs.
- Dust reddens light. Interstellar dust removes blue light more than red, so a distant star looks cooler than it is unless the dust is modeled.
- Crowded fields blend spectra. In dense star clusters or galactic centers, spectra from neighboring objects overlap.
- Models carry assumptions. Abundances depend on the atmosphere model. Two teams using different models can get different values from the same data.
Frequently asked questions
Q: What is spectroscopy in simple terms? A: It is the practice of spreading light into its wavelengths and measuring how bright each one is. Because atoms emit and absorb light at fixed wavelengths, the pattern of bright or dark lines identifies the elements present, and shifts or changes in the lines reveal motion, temperature, and more.
Q: How do astronomers know what stars are made of? A: They match the dark absorption lines in starlight to laboratory spectra of known elements. Each element has a unique pattern of wavelengths. Models of the star's atmosphere then convert line strengths into abundances, and Cecilia Payne's 1925 work showed that most stars are mostly hydrogen and helium.
Q: What is the difference between absorption and emission spectra? A: An absorption spectrum has dark lines where cool gas in front of a hotter source removes light at specific wavelengths. An emission spectrum has bright lines from a hot, thin gas glowing on its own. Both lines come from the same atomic energy levels, so they appear at the same wavelengths.
Q: How does spectroscopy detect planets? A: Two ways. Radial-velocity spectroscopy measures tiny periodic Doppler shifts in a star's lines caused by an orbiting planet's gravity. Transmission spectroscopy watches starlight filtering through a planet's atmosphere during a transit and reads which gases absorb specific wavelengths.
Q: What does redshift mean? A: Redshift is the stretching of light toward longer wavelengths, written as z = Δλ/λ. For nearby objects it comes from motion away from us. For distant galaxies it comes mostly from the expansion of space, which is how astronomers measure the expansion of the universe.
Q: Can spectroscopy prove life exists on another planet? A: Not by itself. A spectrum can show gases such as methane, carbon dioxide, or dimethyl sulfide, but nonliving processes can make many of them. Claims such as the 2025 report on K2-18b have been disputed, and no detection of life has been accepted.
The takeaway
Comte thought the composition of stars was beyond human reach because stars were too far away to touch. Spectroscopy showed that they were never too far to read. Light carries the imprint of every atom it met, and a prism or grating makes that imprint legible. The same method now identifies the gases in the air of planets circling other suns and measures the redshifts of tens of millions of galaxies and quasars. Its main discipline is humility: a spectrum is a measurement that needs a model to interpret, and the best results arrive when independent teams reach the same answer from different assumptions.
Sources
- Wikipedia, Fraunhofer lines, Helium, and Stellar classification
- Wikipedia, Annie Jump Cannon and Cecilia Payne-Gaposchkin
- ESO, ESPRESSO and MUSE
- DESI collaboration, Dark Energy Spectroscopic Instrument
- Wikipedia, WASP-39b, K2-18b, Zeeman effect, and Cosmic Background Explorer
Related Reading
Follow new articles
Add SciHub101 to your feed reader to see new science and technology stories.
About the Author
SciHub101 is an independent science and technology publication founded and edited by Buğra Sözeri, a software engineer and app developer based in Türkiye. AI tools assist with drafting and research. Source documentation in the existing archive is uneven, and articles are being reviewed and corrected. The Editorial Team byline identifies editorial responsibility; it does not certify specialist or independent human review. Where we compare products, anything built by our own team is labelled as such — see the editorial guidelines and About page for how corrections and disclosures work.
Related Articles
How Do We Know How Old Stars Are? The Science of Stellar Ages
Determining a star's age is one of astronomy's most difficult problems — stars carry no birth certificates. Astronomers use stellar evolution models, colour-magnitude diagrams of star clusters, radioactive isotope ratios, asteroseismology (listening to stars vibrate), and gyrochronology (how stars spin down with age). The oldest stars in the Milky Way are 13.5 billion years old — almost as old as the universe itself.
What Are Galaxy Clusters? The Largest Gravitationally Bound Structures in the Universe
Galaxy clusters are the largest structures held together by their own gravity: hundreds to thousands of galaxies, a vast reservoir of X-ray-bright gas, and a dark matter halo that outweighs everything else. They also work as natural telescopes, bending and magnifying light from the early universe.
How Do We Detect Exoplanet Atmospheres — and What Are Biosignatures?
Telescopes can read the chemical fingerprints of atmospheres on planets hundreds of light-years away using transmission spectroscopy — splitting light into a spectrum that reveals which molecules are present. Finding oxygen, ozone, or methane in the right combination could indicate life, but interpreting these signals without false positives is enormously complex.
What Are Cataclysmic Variables, Novae, and Dwarf Novae?
Cataclysmic variables are close binary stars in which a white dwarf pulls gas off a companion. The result is outbursts that range from dwarf novae flaring every few weeks to classical novae that brighten by up to a million times. This article explains the physics, the period gap, and the famous systems.
What Are Wolf-Rayet Stars? The Universe's Most Extreme Suns
Wolf-Rayet stars are massive, extremely hot stars that have blown away their outer layers in winds of thousands of kilometers per second. They show us the inside of a star, they seed space with dust and heavy elements, and many will end as supernovae or black holes.
The Zeeman Effect Experiment: How a Magnet Split the Colors of Light
In 1896, Pieter Zeeman placed sodium flame between magnet poles and watched spectral lines split. The experiment revealed the electron's charge-to-mass ratio and earned the 1902 Nobel Prize in Physics.