What Is the Cosmic Microwave Background? The Afterglow of the Big Bang
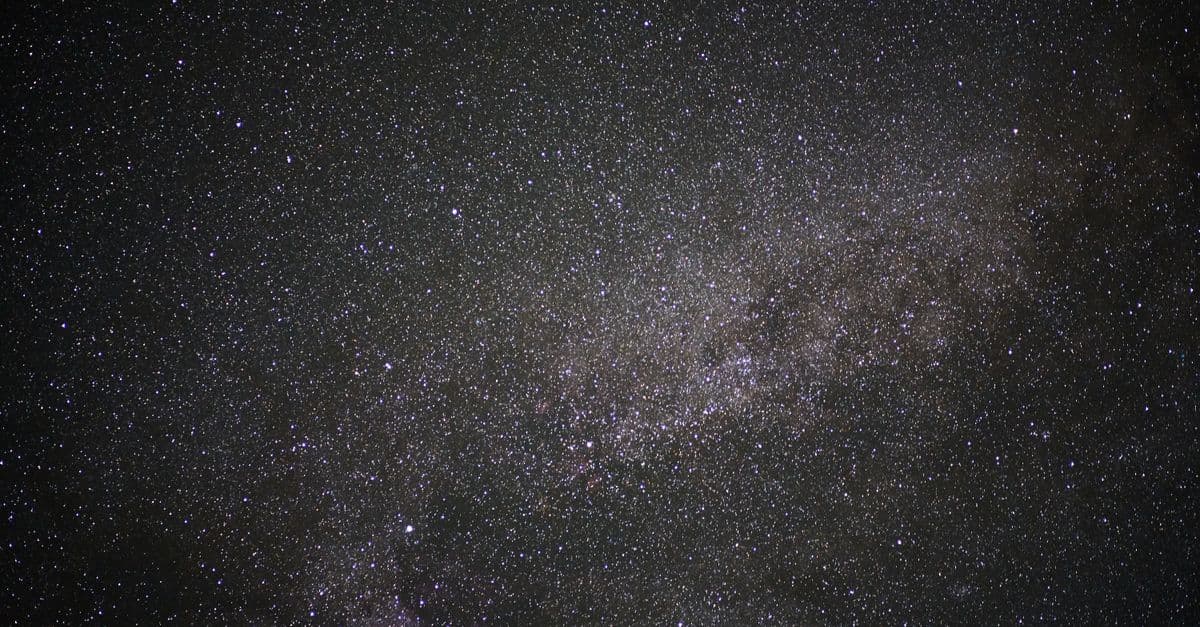
Photo: Chuck Conway / Pexels
In 1964, two radio astronomers at Bell Labs in Holmdel, New Jersey, tried and failed to get rid of a faint hiss in their antenna. It arrived from every direction and would not go away. They had found the cosmic microwave background (CMB), the cooled afterglow of the hot early universe, now measured at about 2.7255 kelvin. Here is what the CMB is, how it was discovered, how satellites mapped it, and what its tiny ripples reveal about the age, shape, and contents of the universe.
What the cosmic microwave background actually is
For its first few hundred thousand years, the universe was a hot, dense plasma of free electrons and nuclei mixed with light. Photons could not travel far in it, because every free electron scattered them within a short distance. Picture trying to see through dense fog: light is present everywhere, but no image can cross it.
The fog lifted when the universe cooled enough for electrons and protons to bind into neutral hydrogen, a step called recombination. The name is misleading, since the particles were combining for the first time, but it stuck. With free electrons gone, light stopped scattering and began to travel in straight lines. ESA puts this moment about 380,000 years after the Big Bang, and the photons released then are the CMB.
Those photons were released at roughly 3,000 kelvin, the glow of a hot lamp filament. They are not at that temperature now because space has expanded since. As the universe grew, the wavelength of every traveling photon stretched with it, much as ink dots on a balloon spread apart when the balloon inflates. The Planck satellite team measured the redshift of that last-scattering moment at 1089.92 plus or minus 0.25, so the wavelengths are about 1,090 times longer than when they were released. A glow near 2,970 kelvin (2.7255 K times 1,090.9) stretched by that factor becomes microwaves at 2.7255 kelvin, a few degrees above absolute zero.
| Quantity | Value | Source |
|---|---|---|
| Temperature today | about 2.7255 K (Fixsen reports 2.7260 ± 0.0013 K from recalibrated data) | Fixsen 2009 |
| Redshift of last scattering | 1089.92 ± 0.25 | Planck 2018 |
| Age at release | about 380,000 years | ESA |
| Photon density | about 411 photons per cubic centimeter | Wikipedia summary of CMB physics |
| Size of temperature ripples | about 1 part in 100,000 | ESA, COBE results |
| Age of the universe | 13.797 ± 0.023 billion years | Planck 2018 |
The photons now reaching your detector are not leftovers from a faraway explosion. They fill the whole sky because the Big Bang happened everywhere at once, and what we see is the shell of matter that released them, a shell that sits at the same distance in every direction. That is why the signal is so uniform.
A discovery that began with pigeon droppings
The history is quirkier than most textbook versions. A review by cosmologist Ruth Durrer notes that Gamow and collaborators had realized in the late 1940s that the Big Bang should leave a background of radiation, though their temperature estimates ranged from 5 kelvin to 50 kelvin and the idea faded. Astronomers had even measured its footprint without recognizing it: the excitation of cyanogen (CN) molecules in interstellar space, observed in 1940 and 1941, corresponded to a sky temperature of about 3 kelvin.
Arno Penzias and Robert Wilson were working with what was then the most sensitive radio receiver in the world, a horn antenna built to study satellite communications, with a helium-cooled reference load. They found a persistent, isotropic noise equivalent to an antenna temperature of about 3.5 kelvin at a wavelength of 7.35 centimeters, and it was larger than anything they expected. They checked the equipment thoroughly and removed what Durrer calls a "white dielectric," pigeon droppings, from the horn. The noise would not go away.
After a phone call, a friend at MIT sent Penzias a preprint by Jim Peebles of Princeton that predicted a cosmic background radiation. Penzias phoned Robert Dicke at Princeton, whose group was building its own detector. Dicke, Peter Roll, and David Wilkinson visited Bell Labs, and the two groups published back-to-back papers in the Astrophysical Journal in 1965. One, by Dicke and colleagues, interpreted the signal as cosmic blackbody radiation; the other, by Penzias and Wilson, reported the measurement under the modest title "A Measurement of Excess Antenna Temperature at 4080 Mc/s." Penzias and Wilson shared the 1978 Nobel Prize in Physics.
The result mattered because it separated two rival pictures of the cosmos. Durrer writes that the steady state model still had a respectable group of followers before the discovery. A universe that was always the same had no reason to be bathed in cooling radiation, while a universe that started hot and dense had to be. For the instrument story in more detail, see our account of the CMB discovery experiment, and for the physicist who first predicted it, George Gamow.
Timeline of the CMB
| Year | Event |
|---|---|
| 1940 to 1941 | Interstellar CN molecules show excitation equal to about 3 K, not yet recognized as the CMB |
| Late 1940s | Gamow and collaborators predict a relic radiation, with estimates from 5 K to 50 K |
| 1964 to 1965 | Penzias and Wilson measure an excess of about 3.5 K at 7.35 cm; paired Astrophysical Journal papers appear in 1965 |
| 1969 | Conklin reports the first sign of a dipole anisotropy |
| 1978 | Penzias and Wilson receive the Nobel Prize in Physics |
| November 18, 1989 | NASA launches COBE |
| April 23, 1992 | COBE's DMR team announces the first detection of primordial temperature ripples |
| June 30, 2001 | NASA launches WMAP |
| 2006 | Mather and Smoot receive the Nobel Prize in Physics for COBE |
| May 2009 | ESA launches Planck, which operates until October 2013 |
| 2018 | Final Planck cosmological parameters published |
Sources: Durrer (2015) review; Wikipedia pages on COBE and the CMB for launch and announcement dates; Planck Collaboration.
A near-perfect blackbody
A blackbody is an idealized object in thermal equilibrium that radiates a spectrum set only by its temperature. The concept goes back to Max Planck's solution to the blackbody radiation puzzle, covered in our article on Max Planck and the invention of quantum theory. Real objects only approximate it. The CMB comes extraordinarily close.
COBE's Far Infrared Absolute Spectrophotometer (FIRAS), led by John Mather, measured the spectrum across a range of wavelengths. In the full-mission analysis by Fixsen and colleagues, the root-mean-square deviation from a perfect blackbody was less than 50 parts per million of the peak brightness, and the temperature came out at 2.728 ± 0.004 K at 95 percent confidence. The same analysis limited distortions: a Compton y parameter below 15 × 10⁻⁶ and a chemical potential below 9 × 10⁻⁵, both at 95 percent confidence.
Those limits are more than a number. A perfect blackbody means the early universe was in thermal equilibrium, so photons and matter were tightly coupled long enough to share one temperature, like coffee in a thermos that has stopped swirling. A large release of energy during the early universe would have distorted the spectrum, and FIRAS saw no such distortion. One COBE overview limits any such energy release to roughly 10⁻⁴ of the CMB's energy for redshifts between about 1,000 and 10 million.
The ripples: how a uniform sky holds a map
If the CMB were perfectly smooth, it would tell us only the temperature. The story is in the ripples. After removing the dipole, discussed below, the sky varies by about one part in 100,000. COBE's Differential Microwave Radiometer (DMR) first detected those fluctuations, announced on April 23, 1992, observing at 31.5, 53, and 90 gigahertz with a sensitivity of about 17 microkelvin per 7-degree field of view in the four-year analysis.
Why do the fluctuations exist? Tiny differences in density in the early plasma, which gravity later amplified into stars, galaxies, and clusters. Cosmologist Wayne Hu's tutorial describes them as reflecting density fluctuations in the early universe, with the power spectrum indexed by a multipole number where a value near 100 corresponds to about one degree. Which spots look warm and which look cool depends on the scale. According to the Sachs-Wolfe effect, the main source of fluctuations at angular scales larger than about ten degrees is gravitational redshift at the last-scattering surface, because photons lose energy climbing out of regions where gravity was stronger. On smaller scales, sound waves in the plasma take over.
Sound waves frozen in the sky
Before recombination, the plasma behaved like a fluid in which gravity pulled matter into denser clumps while radiation pressure pushed back. The result was oscillation, the way a struck bell rings. Hu calls the sharp peak near the one-degree scale acoustic "ringing" from sound waves in the early plasma, a kind of cosmic ultrasound. When recombination ended the coupling, the oscillations were caught mid-cycle. Different angular scales caught the waves at different phases, which is why the power spectrum has a series of peaks and troughs.
Think of photographing a pond in the instant a stone hits it. Every ripple is frozen where it happened to be. The pattern is not random, because the size of the biggest ripple is set by how far sound could travel in the time available. The Planck team's table gives the comoving sound horizon at the end of this epoch as 144.43 ± 0.26 megaparsecs, seen today at an angular scale (θ*) of 1.04110 ± 0.00031 hundredths of a radian, about 0.6 degree. That angle is the ruler the whole analysis depends on.
| Feature in the power spectrum | What it measures | Planck 2018 value |
|---|---|---|
| Angular position of the first peak | Geometry of space | Flat to about 0.4 percent at 95 percent confidence (with BAO) |
| Odd versus even peak heights | Ordinary (baryon) matter density | Ωb h² = 0.02237 ± 0.00015 |
| Higher peaks and damping | Dark matter density | Ωc h² = 0.1200 ± 0.0012 |
| Overall tilt of the ripples | How fluctuation size changes with scale | nₛ = 0.9649 ± 0.0042 |
| Total matter | Fraction of the universe's energy in matter | Ωm = 0.315 ± 0.007 |
The Planck 2018 overview paper notes that 18 peaks in the temperature and polarization power spectra are well constrained, and that Planck measures five of the six free parameters of the standard model to better than 1 percent, with the angular scale θ* measured to 0.03 percent. Derived from those values, the universe is roughly 5 percent ordinary matter, 26 percent dark matter, and 68 to 69 percent dark energy. For what those last two ingredients are, see our explainer on dark matter and dark energy.
Three satellites, three leaps
Ground telescopes and balloons made early progress, but the atmosphere blocks and emits microwaves, so the decisive maps came from space.
| Mission | Dates | Key results |
|---|---|---|
| COBE (NASA) | Launched November 18, 1989 | FIRAS found a near-perfect blackbody; DMR detected primordial anisotropy at 7-degree resolution |
| WMAP (NASA) | Launched June 30, 2001 | Nine-year results shrank the allowed parameter volume by a factor of 68,000 relative to pre-WMAP knowledge; tensor-to-scalar ratio r < 0.13 |
| Planck (ESA) | Launched 2009; scanned until 2013 | Nine frequency bands from 30 to 857 GHz; the standard six-parameter model fits at high and low redshift |
WMAP's nine-year paper reports that its data, alone and combined with other measurements, are "remarkably well fit by a six-parameter" model, and that when combined with high-resolution CMB, BAO, and Hubble constant data, the baryon, cold dark matter, and dark energy densities are each determined to about 1.5 percent. Planck observed wavelengths from 0.3 to 11.1 millimeters, covering more frequency bands at higher sensitivity than WMAP, and ESA says it can distinguish temperature variations of a few millionths of a degree. Different microwave frequencies are essential for a reason we return to below: they let scientists tell the CMB from foreground light.
The antennas behind these maps are cousins of the dishes covered in our article on how radio telescopes work.
The largest ripple is our own motion
The biggest feature in the raw CMB map is not cosmological. One side of the sky is warmer than average by about 3.362 millikelvin, and the opposite side is cooler by the same amount. This is the dipole, and it is a Doppler effect from our own movement through the CMB's rest frame. Wikipedia's summary of the CMB literature gives the amplitude as about 3.3621 ± 0.0010 mK and the Sun's velocity relative to the CMB as 369.82 ± 0.11 kilometers per second, toward the constellation Crater. The Local Group of galaxies moves at 620 ± 15 kilometers per second.
The dipole was the first anisotropy found. Durrer's review credits Conklin in 1969 with the first report, with better measurements by Henry in 1971 and by Corey and Wilkinson in 1976. COBE also measured the annual modulation of the dipole from Earth's orbit around the Sun, a velocity of about 30 kilometers per second. Cosmologists subtract the dipole before looking for ripples, since otherwise it overwhelms them by a factor of about 100. How the matter that left those ripples later gathered into filaments and clusters is the subject of our article on the cosmic web.
Polarization and the hunt for primordial gravitational waves
The CMB is also slightly polarized: the electric field of its photons has a preferred direction that varies across the sky. Scattering of photons off electrons around the time of last scattering creates it. Polarization patterns come in two types, called E-modes and B-modes after the geometry of the pattern.
E-modes were first seen in 2002 by the Degree Angular Scale Interferometer (DASI), and are about ten times weaker than the temperature signal, according to Wikipedia's CMB summary. They come from the same density fluctuations that produce the temperature ripples. B-modes are rarer. They can be produced by gravitational lensing, which was detected with the South Pole Telescope in 2013, or, in theory, by gravitational waves from cosmic inflation, the brief burst of ultra-fast expansion that may have preceded the hot Big Bang. A detection of those primordial B-modes would be strong evidence for inflation. For the theory itself, see our article on cosmic inflation, and for the waves, gravitational waves explained.
The field has already had a false alarm. In 2014 the BICEP2 experiment reported a B-mode signal and interpreted it as a primordial signature. A joint analysis of BICEP2, the Keck Array, and Planck, published in 2015, found strong evidence for polarized dust emission in the observed region and no statistically significant evidence for inflationary gravitational waves, with an upper limit of r < 0.12. Dust in our own Galaxy, not the early universe, had produced much of the signal.
The best limit now comes from BICEP/Keck data through the 2018 observing season: the tensor-to-scalar ratio r, which compares gravitational-wave ripples to density ripples, is below 0.036 at 95 percent confidence. Planck's own inflation paper found the spectral index nₛ = 0.9649 ± 0.0042 and no evidence for a scale dependence, with slow-roll inflation models with a concave potential increasingly favored. The largest planned U.S. experiment was cancelled. On July 9, 2025, the Department of Energy and the National Science Foundation announced that they "can no longer support the CMB-S4 Project," which was dedicated to detecting primordial gravitational waves, and the project is being wound down.
The Hubble tension: a crack in the model
The CMB predicts how fast the universe is expanding today, but only if the standard model is right. Planck's 2018 analysis gives a Hubble constant of 67.4 ± 0.5 kilometers per second per megaparsec. Measurements of nearby galaxies, which use Cepheid variable stars and Type Ia supernovae as rungs on a distance ladder, give a higher number. The SH0ES team's 2022 result is 73.04 ± 1.04, which they describe as a 5-sigma difference from the Planck-based prediction, and say they have found no indication so far that measurement errors explain it.
| Measurement | H₀ (km/s/Mpc) | Method |
|---|---|---|
| Planck 2018 | 67.4 ± 0.5 | CMB, standard model |
| SH0ES (Riess et al.) | 73.04 ± 1.04 | Cepheids and Type Ia supernovae |
| ACT DR6 with Planck, lensing, and DESI DR1 BAO | 68.22 ± 0.36 | CMB with galaxy surveys |
| ACT combined with DESI DR2 | 68.43 ± 0.27 | CMB with galaxy surveys |
| Freedman et al. (2024), tip of the red giant branch, HST and JWST | 70.39 ± 1.22 (stat) ± 1.33 (sys) ± 0.70 (SN) | Distance ladder with different calibrators |
Two things stand out in the table. Newer CMB-based analyses from the Atacama Cosmology Telescope agree with Planck, so the low number does not come from a single instrument. And the distance-ladder results are not unanimous either: the Freedman team's analysis, which uses different stars as calibrators, finds a value in between and concludes that its results are consistent with the standard model. The answer might be a hidden error in one method, or new physics in the early or late universe. It is unresolved, which is why it is one of the most active questions in cosmology. For the broader measurement of cosmic age and expansion, see how old the universe is and how we know.
Anomalies and the Cold Spot
A few features of the CMB do not fit comfortably with random chance. Planck's 2018 isotropy paper confirms several "anomalies" on large angular scales in temperature, but finds that the temperature statistics are consistent with the Gaussian predictions of the standard model and, in its polarization analysis, claims no unambiguous detection of cosmological non-Gaussianity.
The best known is the Cold Spot, a region in the constellation Eridanus about 5 degrees in radius that is roughly 70 microkelvin colder than average, against a typical variation of about 18 microkelvin. It appeared in the first year of WMAP data, and Planck saw it at similar significance in 2013, which ruled out a WMAP-specific error. Statisticians disagree about how unusual it is: using three years of WMAP data, the chance of a deviation that large in simulations was about 1.85 percent.
Explanations range from ordinary to wild. The ordinary one is a supervoid, a huge underdense region that would cool CMB photons passing through it through the late-time integrated Sachs-Wolfe effect. A 2015 study by Szapudi and colleagues found a supervoid with a radius of 220 ± 50 h⁻¹ megaparsecs, centered at redshift 0.22 ± 0.03, with a matter density about 14 percent below average, and called it a plausible cause. The link is contested: a 2017 study found evidence against it, and in 2021 the Dark Energy Survey reported further evidence for a correlation between the supervoid and the Cold Spot. The wildest ideas, such as a collision with another bubble universe, are speculative, and our article on multiverse theory explains why physicists treat them cautiously.
Cleaning the signal: foregrounds
The CMB does not reach a telescope clean. Between us and the last-scattering surface lie the Milky Way's own microwave emission, distant galaxies, gravitational lensing by large-scale structure, and hot gas in galaxy clusters that scatters CMB photons. Planck's nine frequency bands from 30 to 857 GHz exist because these contaminants have different spectra from the CMB's blackbody, so comparing frequencies lets analysts separate them. The Planck overview paper lists the "multi-component sky" as one of its subjects, alongside the cosmological results.
This cleaning is also why the BICEP2 story ended as it did: a single frequency cannot tell cosmic polarization from dust, and a combination of frequencies can.
What people get wrong about the CMB
"The CMB comes from a point where the Big Bang happened." It comes from everywhere. The Big Bang was not an explosion in space but an expansion of space, and the light released at recombination has been traveling in every direction since, so each observer sees a sphere of last scattering centered on themselves.
"The CMB is the first light." It is the oldest light we can see directly. Before recombination the plasma was opaque. Later stages are visible through other signals: the abundance of light elements, discussed in our explainer on nucleosynthesis, and the end of the dark ages when the first stars switched on, covered in reionization and the cosmic dawn. The Planck team places the midpoint of reionization at redshift 7.67 ± 0.73. For the whole story, see how the Big Bang actually happened.
"Steady state was killed by one number." The CMB did not defeat the rival model by a single measurement. The discovery made the Big Bang model the clear favorite, and over the following years the blackbody form of the spectrum, which FIRAS later confirmed to high precision, cemented it.
"The CMB is a snapshot of the whole universe." It is a snapshot of the matter that was within reach of our current sky at last scattering. Other observers anywhere in the universe see their own sphere. The pattern is statistically the same, which is a prediction of the standard model rather than an assumption.
FAQ
Q: What is the cosmic microwave background in simple terms? A: It is the oldest light we can observe, released about 380,000 years after the Big Bang when the universe cooled enough for atoms to form and light could travel freely. Cosmic expansion has stretched that light into microwaves at about 2.7255 kelvin.
Q: Who discovered the CMB? A: Arno Penzias and Robert Wilson at Bell Labs found it in 1964 and 1965 as an unexplained excess of about 3.5 K in their antenna, and Robert Dicke's Princeton group supplied the interpretation in a companion paper. Penzias and Wilson shared the 1978 Nobel Prize in Physics.
Q: Why is it called "microwave" background? A: Cosmic expansion has stretched the original light by a factor of about 1,090, moving its peak from near-infrared wavelengths into the microwave band, millimeters to centimeters long, where Planck and other telescopes observe it.
Q: How do scientists know the universe's age from the CMB? A: They fit the pattern of temperature and polarization ripples with a six-parameter model of the universe. The Planck 2018 analysis gives 13.797 ± 0.023 billion years. The age depends on the model being right, which is one reason the Hubble tension matters.
Q: What do the ripples in the CMB mean? A: They are tiny differences, about one part in 100,000, that trace density variations in the early plasma. Gravity amplified those variations into galaxies and clusters, and the pattern of the ripples encodes the geometry and contents of the universe.
Q: What is the Hubble tension? A: The CMB-based value of the Hubble constant, 67.4 ± 0.5 km/s/Mpc, is lower than the 73.04 ± 1.04 reported by the SH0ES distance-ladder team, a difference described as 5 sigma. Other analyses fall in between, and the cause is unknown.
Q: Did BICEP2 detect gravitational waves from inflation? A: No. A 2015 joint analysis with Planck found that polarized dust in the Milky Way accounted for the signal. The current upper limit on the tensor-to-scalar ratio is r < 0.036 at 95 percent confidence.
The takeaway
The CMB is a rare kind of evidence: a single measurement that tests many ideas at once. Its temperature and spectrum confirm that the early universe was hot and in equilibrium. Its ripples, read as frozen sound waves, give the age of the universe and the share of ordinary matter, dark matter, and dark energy to within a percent or two. Its polarization still holds the possibility of a trace of inflation, and its largest disagreement, the Hubble tension, may be pointing toward physics the standard model does not include. The afterglow is old, but it is still the best-studied light in science.
Sources
- Planck Collaboration, "Planck 2018 results. VI. Cosmological parameters" (arXiv:1807.06209)
- Planck Collaboration, "Planck 2018 results. I. Overview and the cosmological legacy of Planck" (arXiv:1807.06205)
- Planck Collaboration, "Planck 2018 results. X. Constraints on inflation" (arXiv:1807.06211)
- Planck Collaboration, "Planck 2018 results. VII. Isotropy and statistics of the CMB" (arXiv:1906.02552)
- Durrer, R., "The Cosmic Microwave Background: The history of its experimental investigation and its significance for cosmology" (arXiv:1506.01907)
- Fixsen et al., "The Cosmic Microwave Background Spectrum from the Full COBE/FIRAS Data Set" (arXiv:astro-ph/9605054)
- Fixsen, "The Temperature of the Cosmic Microwave Background" (arXiv:0911.1955)
- Hinshaw et al., "Nine-Year WMAP Observations: Cosmological Parameter Results" (arXiv:1212.5226)
- BICEP2/Keck and Planck Collaborations, joint analysis (arXiv:1502.00612)
- BICEP/Keck Collaboration, constraints on primordial gravitational waves (arXiv:2110.00483)
- Riess et al., "A Comprehensive Measurement of the Local Value of the Hubble Constant" (arXiv:2112.04510)
- Freedman et al., "Status Report on the Chicago-Carnegie Hubble Program" (arXiv:2408.06153)
- Atacama Cosmology Telescope DR6 results (arXiv:2503.14452)
- Szapudi et al., "Detection of a supervoid aligned with the cold spot of the CMB" (arXiv:1405.1566)
- ESA, "Planck and the cosmic microwave background"
- NASA, COBE mission page
- COBE Observations and Results (arXiv:astro-ph/9902027, ar5iv version)
- CMB-S4 project status
- Wayne Hu, CMB tutorial, University of Chicago
- Wikipedia, Cosmic microwave background, Cosmic Background Explorer, and CMB cold spot (for launch dates and summary values)
Related Reading
Follow new articles
Add SciHub101 to your feed reader to see new science and technology stories.
About the Author
SciHub101 is an independent science and technology publication founded and edited by Buğra Sözeri, a software engineer and app developer based in Türkiye. AI tools assist with drafting and research. Source documentation in the existing archive is uneven, and articles are being reviewed and corrected. The Editorial Team byline identifies editorial responsibility; it does not certify specialist or independent human review. Where we compare products, anything built by our own team is labelled as such — see the editorial guidelines and About page for how corrections and disclosures work.
Related Articles
What Happens When the Sun Dies? Earth's Fate in 5 Billion Years
The Sun will exhaust its hydrogen fuel in approximately 5 billion years, expanding into a red giant large enough to engulf Mercury and Venus — and possibly Earth. It will then shed its outer layers as a planetary nebula, leaving behind a white dwarf that will cool for trillions of years. Humanity has approximately 1 billion years before rising solar luminosity makes Earth uninhabitable.
How Do Black Holes Form? Every Pathway, From Stars to Seeds
Black holes form through several distinct pathways: massive stars collapsing after fusion ends, neutron star mergers that exceed the mass limit, direct collapse of gas clouds in the early universe, and possibly primordial black holes from density fluctuations just after the Big Bang. Supermassive black holes remain partly mysterious in origin, but likely grew through a mix of heavy seeds, mergers, and accretion.
What Is Cosmic Inflation? The Universe's Fastest Expansion
Cosmic inflation is a proposed burst of exponential expansion in the first fraction of a second after the Big Bang, stretching space by a factor of at least about 10²⁶. It explains why the universe is flat and uniform and where galaxies came from. Its best-known direct test, a 2014 claim by BICEP2, turned out to be dust.
The Big Bang Explained — Origin of the Universe
The Big Bang explained: evidence from Hubble's law, the CMB, and primordial element abundances, plus the timeline of cosmic history and the universe's fate.
How the Big Bang Actually Happened: What Science Really Says
The Big Bang wasn't an explosion in space — it was an expansion of space itself. And the evidence for it is overwhelming.
How Old Is the Universe — And How Do We Actually Know?
The universe is 13.8 billion years old. But how do we know? Three independent methods — the cosmic microwave background, the oldest stars, and Hubble's constant — converge on the same answer. Here's the evidence.