What Is the Solar Cycle? Sunspots and the Sun's Magnetic Heartbeat
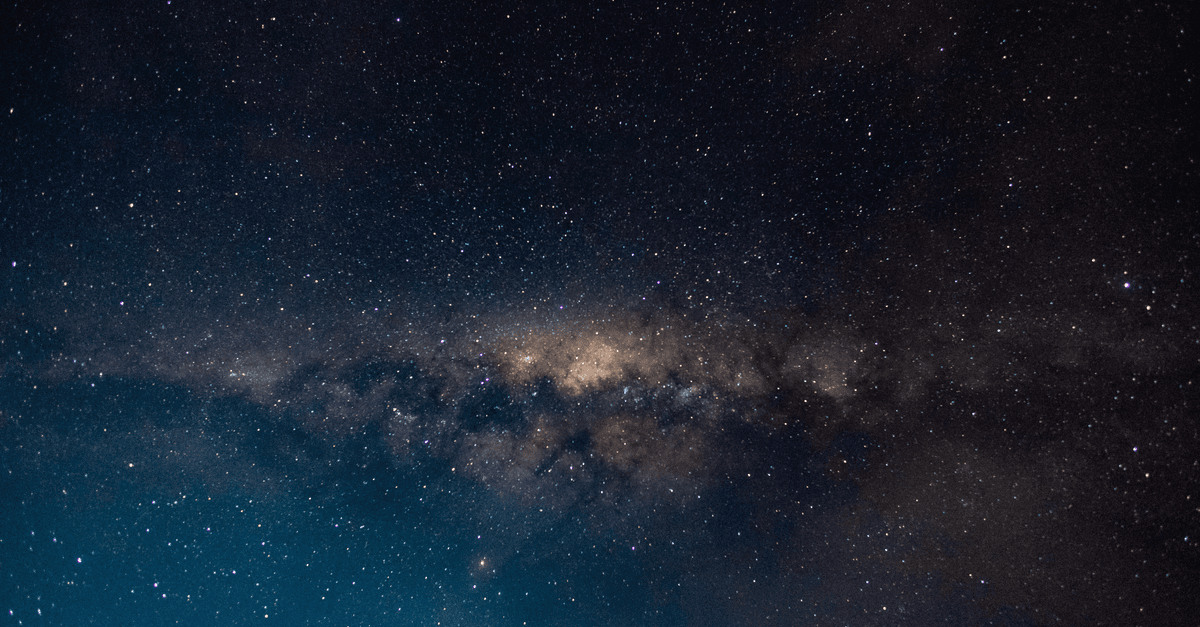
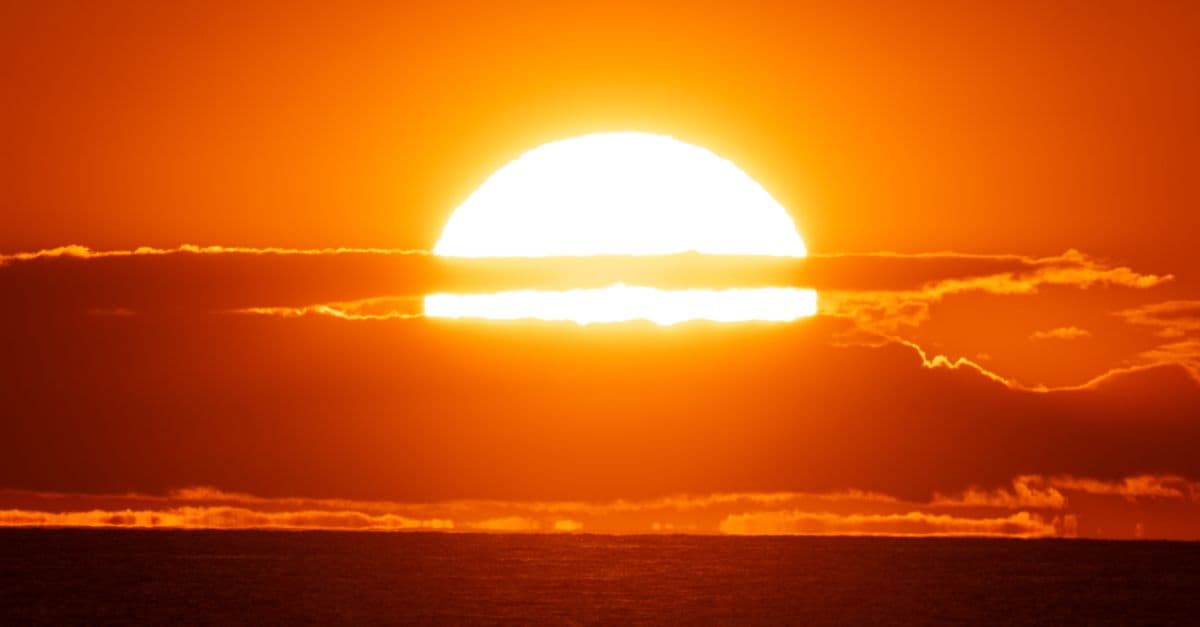
Photo: Ndumiso Mvelase / Pexels
The solar cycle is the Sun's roughly 11-year swing between quiet and stormy, measured by how many dark sunspots appear on its surface. At minimum the disk can be blank for days. At maximum, dozens of spots crowd it and the Sun throws flares and clouds of plasma toward Earth often enough to light up auroras, disturb radio signals, and drag satellites out of orbit. Behind the pattern sits a magnetic engine that flips the Sun's poles every cycle. Cycle 25, the current one, peaked in October 2024 and outran every official forecast.
How the solar cycle is counted
Astronomers measure the cycle with the sunspot number, a weighted count of sunspots and sunspot groups seen on the visible disk. The count is deliberately simple, because it has to be comparable across centuries, from Galileo-era hand drawings to modern space telescopes. The monthly numbers are then smoothed over 13 months so that the rise and fall of the cycle stands out from day-to-day noise.
Rudolf Wolf numbered the cycles in 1852, and by his convention Cycle 1 began in February 1755. Cycle lengths have ranged from 9 to 14 years, and the average for 1699 to 2008 was about 11 years (11.04 years in one standard analysis). The Sun is not a clock, so any single cycle can run noticeably long or short. Samuel Heinrich Schwabe, a German amateur astronomer, spotted the periodicity in 1843 after 17 years of daily observations, and Christian Horrebow had suggested the pattern in 1775 from his own sunspot records (Wikipedia: Solar cycle).
| Cycle | Start | End | Length | Smoothed peak (sunspot number) |
|---|---|---|---|---|
| 23 | May 1996 | January 2008 | 11.6 years | 120.8 (March 2000) |
| 24 | January 2008 | December 2019 | 11.0 years | Weaker than Cycle 23 |
| 25 | December 2019 | Not yet ended | Not yet known | About 161 (October 2024) |
Sources: Wikipedia: Solar cycle for Cycles 23 and 24; Wikipedia: Solar Cycle 25, citing SILSO, for Cycle 25.
The last row is the interesting one. In December 2019, the Solar Cycle 25 Prediction Panel expected a smoothed peak of about 115 around July 2025, give or take eight months. SILSO, the international sunspot index maintained in Belgium, recorded a smoothed maximum of about 161 in October 2024, and the unsmoothed daily maximum of 216 came in August 2024 (Wikipedia: Solar Cycle 25). The details of that surprise are in Solar Maximum 2025.
What sunspots are
A sunspot is a patch of the Sun's visible surface, the photosphere, where a concentrated magnetic field has pushed up through it. The field in a sunspot is thousands of times stronger than Earth's magnetic field (NASA Marshall Solar Physics). That field is the reason the spot is dark, and the reason it matters.
Why a magnetic field makes a dark spot
Heat reaches the Sun's surface by convection: hot plasma rises from below, cools at the surface, and sinks again, like water boiling in a pot. A strong magnetic field resists this motion, because moving a conducting plasma across magnetic field lines takes work. Where the field is strongest, convection is choked off and less heat arrives at the surface. The region cools to roughly 3,000 to 4,500 K in the darkest part, compared with about 5,780 K for the surrounding photosphere (Wikipedia: Sunspot).
The spot is not truly dark. At 4,000 K it would glow brightly on its own, and it only looks black by contrast with its brighter surroundings. A good comparison is a dim bulb next to a floodlight: the bulb is lit, but your eye reports it as a hole. In the same way, a magnetic "cork" in the Sun's boiling surface does not stop the Sun from shining, it just reduces the heat flowing through one patch.
A sunspot has two parts. The umbra is the dark center, where the field is strongest and points nearly straight up. The penumbra is the lighter, fibrous ring around it, where the field fans out and tilts toward the horizontal. Sunspots range from about 16 kilometers across to 160,000 kilometers, and a small spot, called a pore, must be roughly 3,500 kilometers across before it grows a penumbra. Individual spots last from days to a few months, and groups of them can persist for weeks.
The long record of sunspots
People saw sunspots long before telescopes. Chinese records mention a deliberate observation by the astronomer Gan De in 364 BCE. The telescope changed the picture, and telescopic sunspot observations began in 1610 and 1611. Galileo's careful tracking showed spots drifting across the disk, which demonstrated that the Sun rotates and that spots belong to its surface rather than being small planets passing in front of it (Galileo's life and work).
The link to magnetism came in 1908, when George Ellery Hale and his collaborators showed that sunspots are magnetized. He did it by measuring how the field splits spectral lines, an effect described in The Zeeman Effect Experiment. That discovery turned sunspots from a curiosity into a probe of the Sun's interior.
Never look at the Sun directly, with or without a telescope. Safe viewing needs a certified solar filter or a projection method.
The 11-year rhythm and the 22-year magnetic cycle
Sunspots do not appear at random across the Sun. They follow a set of regularities, each named for the astronomer who first stated it. Together they are the best evidence that a single large-scale magnetic process, not local accidents, produces the cycle.
| Rule | What it says | Why it matters |
|---|---|---|
| Schwabe cycle (1843) | Sunspot numbers rise and fall with a period near 11 years | The basic rhythm |
| Hale's law (1919) | Sunspot pairs in the northern and southern hemispheres have opposite magnetic orientations, and both flip in the next cycle | Shows the true magnetic cycle is about 22 years |
| Spörer's law (butterfly diagram) | Spots form at higher latitudes early in the cycle and drift toward the equator as it advances | Traces a wave of magnetic flux moving through the Sun |
| Joy's law | The two members of a sunspot pair are tilted relative to the equator | Evidence of twisting forces inside the Sun |
| Waldmeier effect | Cycles that rise faster tend to reach higher peaks | Helps with early forecasts |
Sources: Wikipedia: Solar cycle for the laws and dates; NASA Marshall Solar Physics for the link between Joy's and Hale's laws and the twisting of rising field tubes.
Why 22 years, not 11
Hale's law means each sunspot cycle is a mirror image of the one before. In one cycle, the leading spot of each pair in the northern hemisphere has, say, north-seeking polarity; in the next cycle it has south-seeking polarity. The Sun's global magnetic field flips its sign around each solar maximum, so the north and south magnetic poles swap roughly every 11 years, as NASA and NOAA describe it. Only after two flips does the field return to where it started, so the complete magnetic cycle is about 22 years, with sunspot number rising and falling twice.
The sunspot number does not care which polarity is up, so it shows only the 11-year rhythm. Magnetic measurements show the longer one. That is why solar physicists often say the real cycle is the 22-year Hale cycle, and the 11-year Schwabe cycle is its visible shadow.
The solar dynamo: where the cycle comes from
The Sun's magnetic field is not a fixed relic. It reverses on a regular schedule, which means it is being regenerated continuously by a process called the solar dynamo. The detailed mechanism is still an active research topic, but the broad outline is well established (Wikipedia: Solar dynamo).
Step 1: Winding up the field
The Sun rotates faster at the equator than at the poles, with a rotation period of about 25 days at the equator and about 34 to 35 days near the poles. Plasma is an electrical conductor, so magnetic field lines are carried along with the gas. Imagine a north-south field line threaded through the Sun. The equator drags its part ahead of the rest, so the line is stretched and wrapped around the Sun like thread on a spool.
NASA's Marshall Space Flight Center estimates that this differential rotation can wrap a north-south field line once around the Sun in about eight months. Each wrap strengthens the east-west component of the field, which is why this step is called the omega effect. The winding is thought to happen mostly in a thin shear layer at the base of the convection zone, known as the tachocline, where the rotation rate changes rapidly with depth (NASA Marshall). Think of twisting a rubber band: each turn stores more energy, and the stored energy has to go somewhere.
Step 2: Rising tubes and the birth of sunspots
Where the wound-up field becomes strong enough, bundles of it, called flux tubes, rise through the convection zone because the magnetic pressure makes them lighter than their surroundings. Where a tube pierces the surface, it makes a sunspot pair, with the two spots at the two ends of an arch of field. Rotation twists the rising tubes, which tilts the pair (Joy's law) and orients the polarities according to Hale's law.
Step 3: Resetting the field and flipping the poles
After a sunspot group fades, its field spreads out and is carried by the surface flows. Because of the tilt, more of the following-polarity flux drifts toward the poles than the leading-polarity flux, and over a few years it cancels the old polar field and rebuilds it with the opposite sign. That is the polar reversal, and it supplies the north-south field that the next cycle will wind up again. Twisting and tilting of the field is called the alpha effect, and models that lean on the tilt of decaying sunspot pairs to rebuild the polar field are called Babcock-Leighton models.
The transport of that flux is where the Sun's circulation comes in. Material near the surface flows from the equator toward the poles at about 20 meters per second, and a return flow deep inside, at about 1 to 2 meters per second, carries material back toward the equator. NASA notes that the slow return flow would carry material from mid-latitudes to the equator in about 11 years.
Worked example: why the conveyor belt takes about a decade
The arithmetic is simple enough to check. Take a path from latitude 45 degrees to the equator at a depth where the radius is about 85% of the Sun's, near the base of the convection zone. The Sun's radius is about 696,000 kilometers, so the arc length is about 0.785 radians × 0.85 × 696,000 km, or roughly 465,000 kilometers. At a return speed of 1.5 meters per second, which is 1.5 × 10⁻³ kilometers per second, the trip takes about 3.1 × 10⁸ seconds, or close to 10 years. That is the right order of magnitude for the cycle length, which is why the circulation is a leading candidate for setting the clock. It is also why researchers suspect that variations in the flow speed explain why some cycles are strong and some weak, a suggestion that is not settled.
What the dynamo cannot yet do
Models in this family reproduce the 11-year rhythm, the butterfly diagram, and the polarity flips, and they can be used for forecasting. They cannot yet explain exactly what sets the cycle's strength from one cycle to the next, and the fact that Cycle 25 beat the 2019 forecasts by a wide margin is a reminder. The Sun's interior flows that the models need can be probed through helioseismology, which uses sound waves traveling through the Sun in the way seismology uses earthquake waves.
Flares and coronal mass ejections
Sunspot groups are the sites where stored magnetic energy gets released in two ways that are often confused: solar flares and coronal mass ejections (CMEs). A flare is a sudden flash of radiation, produced when tangled magnetic field lines in the corona reconnect and release stored energy. A CME is a huge bubble of magnetized plasma that the Sun hurls into space. Flares are the muzzle flash; CMEs are the bullet.
Flares: classified by X-ray brightness
Flares are rated by their peak soft X-ray flux as measured by the GOES satellites. Each class is ten times the one before it, and the number after the letter is a multiplier within the class.
| Class | Peak flux (watts per square meter) | Typical effects |
|---|---|---|
| A | below 10⁻⁷ | None |
| B | 10⁻⁷ to 10⁻⁶ | None |
| C | 10⁻⁶ to 10⁻⁵ | Minor |
| M | 10⁻⁵ to 10⁻⁴ | Brief radio blackouts at the poles, minor radiation storms |
| X | above 10⁻⁴ | Strong radio blackouts, possible radiation storms |
Source: Wikipedia: Solar flare, citing the GOES classification.
Flares range from several per day near solar maximum to fewer than one per week near minimum. Over a typical cycle there are about 1,200 M-class flares and only 2 to 3 flares of X10 or stronger. The largest flare measured by instruments occurred on November 4, 2003. It saturated the GOES detectors, so its class is approximate: it was first estimated at X28, and later revised to about X45 on the basis of its effects on Earth's ionosphere. The Carrington event of 1859, which lacks any X-ray measurement, has been estimated at around X45, plus or minus 5, from the magnetic disturbances recorded on ground magnetometers (Wikipedia: Solar flare). A flare's light arrives at Earth in about eight minutes, which is the time it takes light to cross 150 million kilometers (1.496 × 10⁸ km divided by 299,792 km/s is 499 seconds).
CMEs: slower, but they carry the punch
CMEs are far more variable. Coronagraph measurements put their speeds between 20 and 3,200 kilometers per second, with an average near 489 kilometers per second. They occur about 0.2 times per day near solar minimum and about 3.5 times per day near maximum. A typical CME takes one to five days to reach Earth (Wikipedia: Coronal mass ejection).
The numbers follow from distance and speed. At 489 kilometers per second, a CME needs 1.496 × 10⁸ km ÷ 489 km/s, or about 3.06 × 10⁵ seconds, which is 3.5 days. A very fast one at 3,000 kilometers per second makes the trip in about 14 hours. The Carrington event's storm effects arrived about 18 hours after the flare, which implies an average speed near 2,300 kilometers per second, several times the typical CME speed.
Whether a CME produces a strong geomagnetic storm depends on its magnetic orientation. If its field points opposite to Earth's field at the front of the magnetosphere, the two reconnect and energy pours in. If it points the same way, most of the energy slides past. That is why two CMEs of similar speed can have very different effects, and why forecasters watch the field measured by spacecraft upstream, about an hour before arrival.
Cycle 25: forecast versus reality
Cycle 25 began in December 2019, with a smoothed sunspot minimum of 1.8. The prediction panel expected a cycle much like the weak Cycle 24, with a smoothed peak near 115. Observations from 2020 to 2022 already ran well above that forecast, and the smoothed maximum reached about 161 in October 2024. The Sun also completed its polar field reversal in 2023, the sign that the field had switched sign near the height of the cycle.
On October 15, 2024, NASA, NOAA, and the international Solar Cycle Prediction Panel announced that the Sun had reached the solar maximum period of the cycle. The announcement came with a caveat from NOAA's Elsayed Talaat: it "doesn't mean that this is the peak of solar activity we'll see this solar cycle," because the peak month cannot be identified until activity has declined for a while (NASA). The most powerful flare of the cycle at that time was an X9.0 on October 3, 2024.
The storm of May 2024
The most dramatic episode of the cycle came in May 2024. Sunspot region AR 3664 (NOAA 13664) produced a series of X-class flares and coronal mass ejections aimed at Earth, and the resulting geomagnetic storm, from May 10 to 13, was rated G5 ("Extreme"), the highest level. It was the most powerful storm to hit Earth since March 1989, and auroras were seen at unusually low latitudes, including the Florida Keys, the Yucatán, Hawaii, Sardinia, and northern Queensland.
The storm degraded high-frequency radio and sharply reduced the accuracy of the GPS used by farm tractors, which forced some farmers to pause planting. Starlink satellites stayed operational, though the service was degraded. By contrast with 1989, Canadian utilities reported no outages (Wikipedia: May 2024 solar storms). The auroras they produced are explained in Aurora Explained.
What happens after the peak
After the peak, the Sun enters a declining phase that leads to minimum. That does not mean the danger passes: large flares and storms can still occur in the declining phase. An X5.16 flare on November 11, 2025 produced a radiation storm and a fast CME, and was the strongest flare of that year. SILSO has said that another maximum is possible but unlikely to exceed October 2024's level (Wikipedia: Solar Cycle 25). Nobody can yet say how strong Cycle 26 will be.
What the cycle does to Earth
The solar cycle matters because it changes the environment around Earth. The effects fall into a few groups.
Satellites and orbital drag. A geomagnetic storm heats Earth's upper atmosphere and expands it, so the air at satellite altitudes becomes denser and drags on spacecraft. On February 3, 2022, SpaceX launched 49 Starlink satellites into low orbit, a minor geomagnetic storm raised drag, and 38 of them failed to reach their operating orbit and re-entered. A study published in Space Weather attributed the loss to high drag and reduced satellite stability (CIRES). The basic physics of orbits, and why drag matters, is in How Satellites Orbit Earth.
Power grids. The storm of March 13, 1989 caused a nine-hour outage of Hydro-Québec's transmission system. The James Bay network went down in under 90 seconds, after two CMEs on March 10 and 12 (Wikipedia: March 1989 geomagnetic storm). Utilities now watch space weather forecasts the way they watch weather forecasts. The extreme end of the range is covered in Solar Storms and the Carrington Event.
Radio and navigation. Flares ionize the upper atmosphere on the sunlit side of Earth and can black out high-frequency radio for minutes to hours. Strong geomagnetic storms degrade GPS accuracy, as the May 2024 farming reports showed.
Radiation. Energetic particles from flares and CME shocks pose a risk to astronauts and to electronics on spacecraft. Earth's own protective radiation belts are described in The Van Allen Belts.
Brightness. The Sun is slightly brighter at solar maximum, by about 0.1%. The sunspot cycle changes the solar constant by about 1.3 watts per square meter out of an average near 1,366 (Wikipedia: Sunspot). Bright regions called faculae, which accompany sunspots, outweigh the dimming from the spots themselves. For scale, a Sun that was 10% dimmer would be a very different world, as What If the Sun Was 10% Dimmer? explores.
The Maunder Minimum and other grand minima
The cycle is not guaranteed to continue at its usual strength. Between about 1645 and 1715, sunspots became exceedingly rare, an interval now called the Maunder Minimum. Gustav Spörer first noted it in 1887 and 1889, and Edward Walter Maunder published on it in 1890 and 1894. His wife, Annie Russell Maunder, also contributed to the work, though her role went unrecognized for years. John Eddy popularized the term in a 1976 Science paper.
| Episode | Approximate dates | Key facts |
|---|---|---|
| Spörer Minimum | 1450 to 1540 | Low solar activity inferred from isotope records |
| Maunder Minimum | 1645 to 1715 | Fewer than 50 sunspots in the 28 years from 1672 to 1699, against 40,000 to 50,000 in a similar span today |
| Dalton Minimum | 1790 to 1820 | Less marked than the Maunder |
Source: Wikipedia: Maunder Minimum.
Even in the minimum, the cycle did not vanish: enough spots appeared to identify cycle maxima around 1676 to 1677, 1684, 1695, 1705, and 1718. Other evidence confirms the low activity. Carbon-14 and beryllium-10 in tree rings and ice cores, which depend on cosmic-ray flux and therefore on solar activity, both point to a weak Sun, and eyewitness accounts of eclipses in 1652, 1706, and 1715 describe a faint, unstructured corona. Paintings of the 1706 eclipse by Maria Clara Eimmart, rediscovered in 2012, agree with Eddy's reading.
Did the Maunder Minimum cause the Little Ice Age?
The Maunder Minimum overlapped with the Little Ice Age, a cool period in Europe. Whether the two are causally linked is still being evaluated. The cooling began before the Maunder Minimum, and northern-hemisphere temperatures during the minimum were not significantly different from the previous 80 years. The leading hypothesis for the Little Ice Age is volcanic activity (Wikipedia: Maunder Minimum).
The takeaway is calibrated: the solar cycle plausibly nudges regional weather, and a grand minimum is a real possibility some day, but the solar changes involved are small compared with other climate drivers. Over a full cycle the Sun's total output changes by only about 0.1%.
The coronal heating puzzle
The corona, the Sun's outer atmosphere, is at about a million degrees or more, while the surface below it is only about 5,800 K. This looks backward, since moving away from a heat source should mean cooling. It is often described as breaking the laws of thermodynamics, but it does not. Heat flowing from cool to hot would break them. What happens instead is that magnetic energy, not heat, carries power up from the surface and dumps it in the corona.
Two ideas compete to explain how. Wave heating holds that motions at the surface shake magnetic field lines and launch Alfvén waves (waves that travel along field lines) which dissipate in the corona. Nanoflare heating, proposed by Eugene Parker in the 1980s, holds that countless tiny reconnection events add up to the heating. A 2023 study by Mason and colleagues analyzed the frequency of flares of different sizes and found that nanoflares are not frequent enough to heat the corona to millions of degrees alone, so waves must play an important role (AAS Nova). The likeliest answer is that both contribute, in proportions that remain debated.
Two spacecraft are closing in on the question. In December 2024, NASA's Parker Solar Probe passed 6,167,590 kilometers (3,832,362 miles) from the Sun at 192 kilometers per second, the closest approach by any spacecraft (Guinness World Records). The mission is covered in Parker Solar Probe: Touching the Sun. ESA's Solar Orbiter imaged small "campfires" in May 2020 from about 77 million kilometers away, miniature flares a million or billion times smaller than ordinary ones that may help heat the corona (ESA).
Common confusions
"The cycle runs on an exact 11-year clock." It does not. Cycles have ranged from 9 to 14 years, and their strengths vary widely. The 11-year figure is an average.
"More sunspots mean a much hotter Sun." The Sun brightens by only about 0.1% at maximum, and the spots themselves are dimmer than their surroundings. The overall brightening comes from bright faculae.
"Solar maximum is the day of the biggest storm." A maximum is a multi-year period, the peak month is identified only afterward, and big flares can occur at any time in the cycle. Significant storms still occur in the declining phase, which is why forecasters keep watching after the peak.
"A flare and a CME are the same thing." A flare is a flash of radiation that reaches Earth in eight minutes. A CME is a cloud of plasma that takes a day or more. They often occur together, but one can happen without the other.
"Sunspots are holes." They are cooler regions, which still glow at several thousand kelvins, and they are produced by magnetic fields that block heat flow.
"The solar cycle explains modern climate change." The cycle's brightness change is about 0.1% and repeats every 11 years or so, which cannot account for a sustained warming trend. Even a grand minimum would change the Sun's output by only a small fraction of that.
Frequently asked questions
Q: How long is the solar cycle? A: The sunspot cycle averages about 11 years, with individual cycles lasting between 9 and 14 years. Because the Sun's magnetic poles flip each cycle, the full magnetic cycle is about 22 years.
Q: Where are we in the solar cycle now? A: Solar Cycle 25 began in December 2019 and reached its smoothed maximum in October 2024, according to SILSO, at about 161. It has since moved past that peak into the declining phase, though large flares and storms can still occur.
Q: What causes the solar cycle? A: A magnetic dynamo. Differential rotation winds the Sun's magnetic field into strong east-west bands, rising loops of that field make sunspot pairs, and the decay of those pairs rebuilds the polar field with reversed polarity. Circulation of material through the Sun is thought to set the timing.
Q: Why do sunspots look dark? A: Their strong magnetic fields block the upward flow of hot plasma, so they are cooler, about 3,000 to 4,500 K, than the surrounding surface at about 5,780 K. They are still bright in absolute terms, and look dark only by contrast.
Q: Can the solar cycle affect Earth's climate? A: Slightly. The Sun's total output changes by about 0.1% across a cycle. The Maunder Minimum overlapped with the Little Ice Age, but volcanic activity is considered the leading cause of that cool period, and a causal link to the Sun is still under evaluation.
Q: What is a solar flare, and how is it different from a CME? A: A flare is a burst of radiation that reaches Earth in about eight minutes. A coronal mass ejection is a cloud of magnetized plasma that takes one to five days to arrive and is the main driver of geomagnetic storms.
Q: When will the next solar minimum happen? A: The date is not yet known. Solar minimum is identified only afterward, once smoothed sunspot numbers have bottomed out and begun to rise, and past cycles have varied from 9 to 14 years in length.
The takeaway
The solar cycle is a magnetic process, with sunspots as its visible trace. The Sun winds its own field with its rotation, lets bundles of it rise as sunspots, and rebuilds and reverses the poles from the debris, all on a timescale probably set by the slow circulation inside it. The pattern is regular enough to forecast and irregular enough that Cycle 25 beat the experts by a wide margin. What it controls on Earth is mostly the near-space environment: satellites, radio, grids, and auroras. The cycle's lessons for the climate are smaller than they are often made out to be, and the lessons for technology are larger.
Related Reading
Follow new articles
Add SciHub101 to your feed reader to see new science and technology stories.
About the Author
SciHub101 is an independent science and technology publication founded and edited by Buğra Sözeri, a software engineer and app developer based in Türkiye. AI tools assist with drafting and research. Source documentation in the existing archive is uneven, and articles are being reviewed and corrected. The Editorial Team byline identifies editorial responsibility; it does not certify specialist or independent human review. Where we compare products, anything built by our own team is labelled as such — see the editorial guidelines and About page for how corrections and disclosures work.
Related Articles
What Is Tidal Locking? Why We Only See One Side of the Moon
Tidal locking occurs when a body's rotation period equals its orbital period, so one hemisphere permanently faces its partner. The Moon is locked to Earth, which is why we always see the same face, and the same effect probably shapes planets around red dwarf stars.
What Is Interstellar Dust and Why Does It Matter?
Interstellar dust grains, typically far thinner than a human hair, dim starlight, build molecular hydrogen, shield star-forming clouds, carry the isotopic signatures of dead stars, and supply the solids from which planets grow.
Solar Maximum 2025: How Solar Cycle 25 Outran Every Prediction
In May 2024, auroras appeared over Florida, the Yucatán Peninsula, and Puerto Rico. Northern lights were photographed from latitudes that had not seen them in decades — triggered by the strongest geomagnetic storm since March 1989. The storm was rated G5, the maximum on NOAA's five-point geomagnetic disturbance scale. Solar Cycle 25, which government forecasters had predicted would be 'average,' had quietly become one of the most active solar cycles in a century — and the official models did not see it coming until it was already happening.
How the Sun Works — Nuclear Fusion Powered Star
How the Sun works: proton-proton fusion in the core, layers from radiative zone to corona, solar wind, sunspots, and the Sun's far future.
What Are the Van Allen Belts? Earth's Trapped Radiation
The Van Allen belts are zones where Earth's magnetic field traps radiation. How Explorer 1 found them, how they work, and how Apollo and Artemis crossed them.