How Do We Measure Cosmic Distances? The Distance Ladder Explained
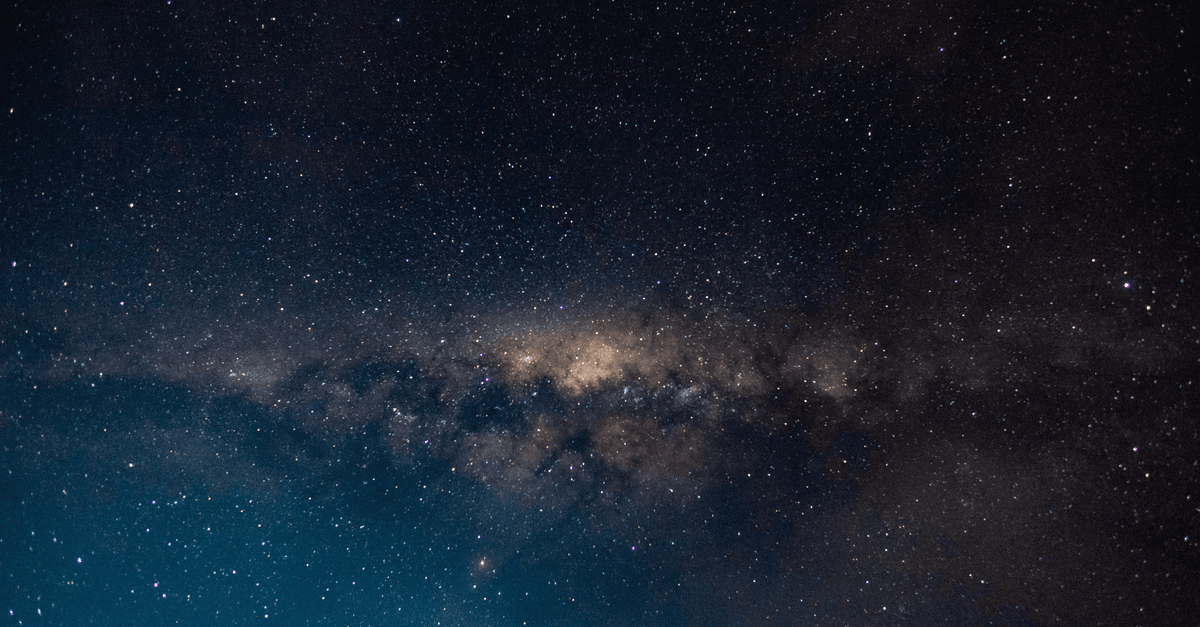
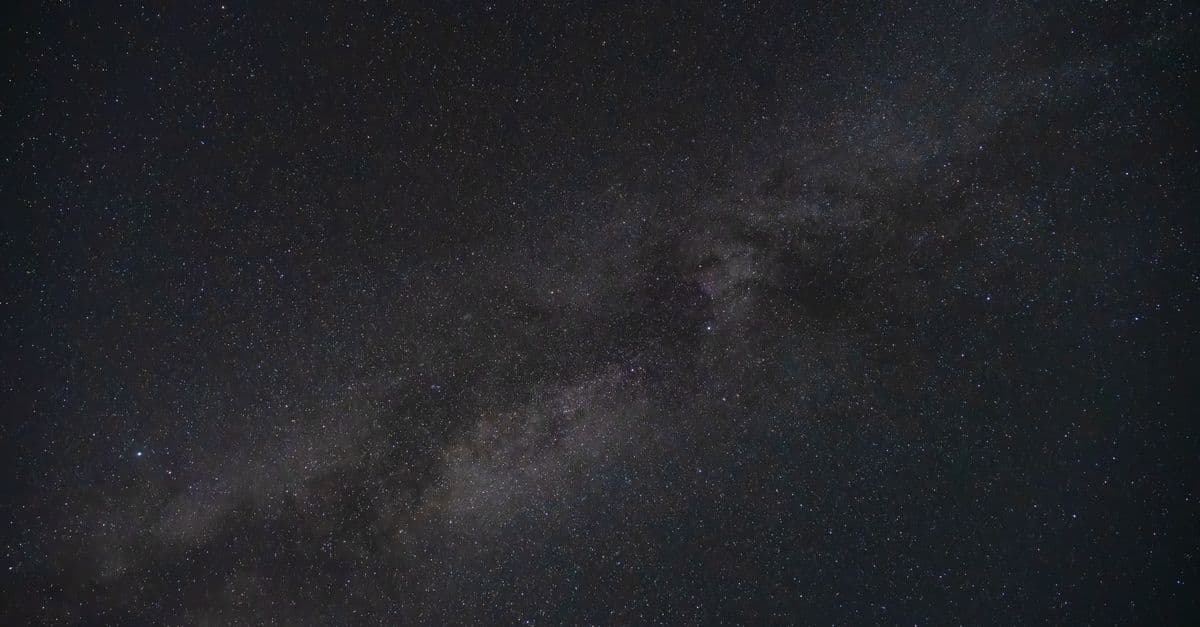
Photo: Ndumiso Mvelase / Pexels
No tape measure reaches the Andromeda Galaxy, and no radar pulse bounces off a distant quasar. Astronomers measure cosmic distances by chaining methods together, each one calibrated against the one below it: radar for the Solar System, parallax for nearby stars, pulsating stars for neighboring galaxies, and exploding white dwarfs for the far universe. That chain is the cosmic distance ladder. Its top rungs now feed a live dispute about how fast the universe is expanding, so the details of each rung matter more than they used to.
Why no single ruler reaches across the universe
Every distance method has a working range, and each one runs out for a physical reason. Geometry works only while the angles involved are big enough to measure. Brightness-based methods work only while the object is bright enough to pick out and its intrinsic luminosity is known. Methods built on the expansion of space work only once galaxies are far enough that their motion through space is small next to the expansion itself.
The ladder is the engineering answer. Think of surveying a mountain range with a single tape measure, then using that measured baseline to triangulate a peak, then using the peak as a landmark to place a second range beyond it. Each step is only as good as the step before. A calibration error at the bottom is inherited by everything above it, which is why astronomers spend so much effort on the lowest rungs and on independent checks that skip rungs entirely.
The ideas behind the ladder are old. Eratosthenes used shadows at two cities to size the Earth, and that same logic of baselines and angles survives in modern parallax; the Eratosthenes experiment is the template. What changed is scale: the modern ladder covers roughly 15 orders of magnitude in distance, from the Earth-Sun gap (1 AU) to galaxies whose light has traveled for more than 10 billion years.
| Rung | Method | Works to roughly | Calibrated by |
|---|---|---|---|
| 1 | Radar ranging, orbital mechanics | The Solar System | Light travel time |
| 2 | Trigonometric parallax | Several kiloparsecs (Gaia) | The astronomical unit |
| 3 | Main-sequence fitting | Star clusters in the Milky Way and Magellanic Clouds | Parallax of nearby stars |
| 4 | RR Lyrae and Cepheid variables | Local Group and nearby galaxies | Parallax, eclipsing binaries, masers |
| 5 | Tip of the red giant branch, carbon stars | Tens of megaparsecs | Parallax, masers, eclipsing binaries |
| 6 | Surface brightness fluctuations | About 100 Mpc | Cepheids and the red giant tip |
| 7 | Type Ia supernovae | Beyond redshift 2 | Cepheids or red giant tip in host galaxies |
| 8 | Redshift and the Hubble flow | The observable universe | The calibrated Hubble constant |
Ranges are approximate; each method is discussed below with sources.
Rung 1: Radar and the length of the astronomical unit
The base of the ladder is the astronomical unit (AU), the average Earth-Sun distance. The International Astronomical Union fixed it in 2012 as exactly 149,597,870,700 meters, so the AU is now a defined length rather than a measured quantity (Astronomical unit).
Getting there took centuries. Edmond Halley advocated using transits of Venus across the Sun, and observers including James Cook and Charles Green watched the transits of 1761 and 1769 from stations around the world; the combined results gave a solar parallax of about 8.6 arcseconds. Radar changed the game in the early 1960s. Bounce a radio pulse off Venus, time the round trip, multiply by the speed of light, and halve it. Kepler's third law then gives the size of every planet's orbit in AU, so one radar measurement of one planet scales the entire Solar System.
This rung is almost trivially secure, which is the point. Everything above it is a ratio built on a length that is now known exactly.
Rung 2: Stellar parallax, the geometry of the nearest stars
Hold a finger at arm's length and close one eye, then the other. The finger seems to jump against the background. That shift is parallax, and astronomers use the same trick with the whole Earth orbit as the baseline. Over six months the Earth moves 2 AU across, and a nearby star appears to trace a tiny ellipse against the far-off stars behind it.
The distance in parsecs is simply the reciprocal of the parallax angle in arcseconds:
$$d = \frac{1}{p}$$
A parsec is defined so that a star with a parallax of one arcsecond sits at one parsec: 3.26 light-years. The nearest star system, Proxima Centauri, has a parallax of 0.7685 arcseconds, which gives a distance of 1.301 parsecs, or 4.24 light-years (Stellar parallax).
The first stellar distance
For centuries astronomers looked for parallax and failed, because the angles are so small. Thomas Henderson, Friedrich von Struve, and Friedrich Bessel each secured measurements in the 1830s. Bessel's, published in 1838, was for the star 61 Cygni. He found a parallax of about 0.314 arcseconds, a distance of roughly 10.4 light-years. Modern values put 61 Cygni near 11.4 light-years, so his first reliable distance to any star beyond the Sun was off by about a light-year (61 Cygni).
From Hipparcos to Gaia
The atmosphere blurs starlight, which limits ground-based parallax to nearby stars. Space solved that. ESA's Hipparcos satellite operated from August 1989 to March 1993 and produced a catalogue of 118,218 stars (ESA Hipparcos). Its successor, Gaia, launched in December 2013 and is far more sensitive. Gaia Data Release 3 lists positions and brightness for about 1.8 billion sources, and parallaxes and proper motions for roughly 1.5 billion of them (Gaia Collaboration, 2022).
Parallax errors do not shrink with distance in absolute terms, but the fractional error grows: a parallax of 0.001 arcsecond (one milliarcsecond) means a star at 1,000 parsecs, and a measurement uncertain by 0.1 milliarcsecond is then a 10 percent distance error. That is why parallax is trusted for stars within a few kiloparsecs and why the rungs above it are needed.
Rung 3: Star clusters and the distance modulus
Parallax gives distances to individual stars, but astronomers want a bigger target: a star cluster whose members all sit at nearly the same distance. If you plot the color and brightness of every star in a cluster, you get a color-magnitude diagram, and the stars burning hydrogen form a clean diagonal band called the main sequence. The same band for nearby stars with measured parallaxes has known absolute brightnesses. Slide the cluster's band up or down until it overlays the calibrated one, and the offset tells you the distance.
That offset is the distance modulus, the difference between apparent magnitude m and absolute magnitude M:
$$\mu = m - M = 5\log_{10}\left(\frac{d}{10\ \text{pc}}\right)$$
The formula is a logarithmic way of saying that light dims with the square of distance. A worked example: the Large Magellanic Cloud (LMC), a satellite galaxy of the Milky Way, is at 49.59 kiloparsecs. Then d/10 pc = 4,959, the base-10 logarithm is 3.695, and the distance modulus is about 18.48 magnitudes. Everything in the LMC looks 18.48 magnitudes fainter than it would from 10 parsecs away, a dimming by a factor of about 25 million.
Main-sequence fitting is also how astronomers date and weigh globular clusters, the ancient star balls that surround the Milky Way and serve as anchor points for older, brighter distance indicators. Metallicity (the share of elements heavier than helium) shifts the main sequence slightly, so these fits need careful corrections.
Rung 4: Pulsating stars as standard candles
A standard candle is any object whose true luminosity is known well enough that its apparent brightness reveals its distance. A 100-watt bulb that looks one-quarter as bright is twice as far away. The trouble is finding bulbs that announce their own wattage. Pulsating stars do exactly that.
RR Lyrae stars
RR Lyrae stars are old, relatively low-mass stars that pulsate with periods of roughly half a day. They sit on the horizontal branch, a stable stage of stellar evolution, and their intrinsic brightness varies little with period, which makes them dependable markers inside the Milky Way halo, in globular clusters, and in nearby dwarf galaxies. They are modest in luminosity, so they are useful out to the Local Group but not far beyond.
Cepheids and the Leavitt law
Classical Cepheids are younger, much brighter supergiants that swell and shrink on timescales from days to months. In 1908, Henrietta Leavitt published a catalogue of 1,777 variable stars in the Magellanic Clouds and noted that the brighter ones had longer periods; her 1912 paper on 25 Cepheids in the Small Magellanic Cloud laid out a simple relation between brightness and period (Henrietta Swan Leavitt). Because the stars in each cloud are all at about the same distance, their apparent brightness differences reflected true differences. The period-luminosity relation, now called the Leavitt law, was born, and Henrietta Leavitt's life and work are worth reading in full.
The physics is the point. Measure a Cepheid's period with a patient series of photographs, read its true luminosity from the Leavitt law, compare that to how bright it looks, and the distance falls out. A Cepheid with a 10-day period has an absolute visual magnitude near -4, a few thousand times the Sun's visual output. Put one in a galaxy 20 megaparsecs away, where the distance modulus is about 31.5, and it appears around 27th magnitude, more than 100 million times fainter than the faintest star visible to the naked eye. Only space telescopes can do that photometry.
The Andromeda moment
Cepheids rewrote cosmology. Edwin Hubble found Cepheids in photographs of Andromeda taken with the 100-inch Hooker telescope at Mount Wilson, and in 1925 the result settled the old debate about whether such "nebulae" lived inside the Milky Way. Using Leavitt's law, he showed Andromeda lay far outside it. His distance was too small: in the early 1950s astronomers realized there are two kinds of Cepheid with different brightness-period relations, which roughly doubled the distance to the modern value near 765 kiloparsecs, or 2.5 million light-years (Andromeda Galaxy). The story of Edwin Hubble's career shows how much of astronomy rests on this one calibration.
How the Cepheid calibration chain works
For the Leavitt law to give distances rather than just ratios, someone must pin down its absolute zero point. The calibration uses several independent anchors:
- Milky Way parallaxes. Gaia measures geometric parallaxes for Cepheids in our own galaxy.
- The LMC. A 2019 study of 20 detached eclipsing binary systems in the LMC, which yields geometric distances from orbital geometry and stellar sizes, put the LMC at 49.59 kiloparsecs with a statistical error of 0.09 and a systematic error of 0.54, precise to 1 percent (Pietrzyński et al., 2019).
- NGC 4258. The galaxy hosts water masers (microwave lasers produced by gas) in a disk orbiting its central black hole. Tracking their motion gives a geometric distance of 7.576 megaparsecs, with a statistical error of 0.082 and a systematic error of 0.076 megaparsecs (Reid, Pesce, and Riess, 2019).
Three different geometric methods, none dependent on any other, give the Leavitt law its zero point. That redundancy is what lets astronomers argue the base of the ladder is sound.
Limits of Cepheids
Cepheids are bright but rare, and they live in young, star-forming regions. That brings problems. In distant galaxies, crowding blends a Cepheid's light with neighbors, biasing its apparent brightness. Interstellar dust dims and reddens it. Chemical composition tweaks the period-luminosity relation slightly. These are the systematic errors a good deal of the current debate is about, and the 2024 James Webb Space Telescope (JWST) results tackled crowding head-on, as covered below.
Rung 5: Red giants and carbon stars as brightness markers
Cepheids are absent from old stellar populations, including the elliptical galaxies that host many supernovae. Two other markers work there.
The tip of the red giant branch (TRGB) exploits a quirk of stellar physics. A low-mass star that has finished burning hydrogen swells into a red giant with a degenerate helium core, a core held up by quantum pressure rather than heat. When that core reaches about half a solar mass, helium fusion ignites suddenly in a "helium flash." Because the flash always happens at nearly the same core mass, red giants stop brightening at nearly the same luminosity, an absolute I-band magnitude of roughly -4. In a resolved galaxy, the red giant population ends in a sharp edge, and that edge's apparent brightness gives the distance.
The J-region asymptotic giant branch (JAGB) method uses carbon-rich evolved stars whose near-infrared brightness clusters in a narrow range, a third independent marker.
All three methods (Cepheids, TRGB, JAGB) draw on different stars and different physics. In 2024, a team led by Wendy Freedman used JWST to compare them. Their TRGB measurement, with 24 Type Ia supernova calibrators, gave H0 = 70.39 ± 1.22 (statistical) ± 1.33 (systematic) ± 0.70 (supernova scatter). Their JWST-only JAGB measurement gave 67.80 ± 2.17 ± 1.64, and the paper found that distances based on the SH0ES Cepheid scale agree with the TRGB and JAGB distances at just over the 1 percent level (Freedman et al., 2024). Those numbers sit between the two camps, which is why the same data are read differently by different teams.
Rung 6: Surface brightness fluctuations
Beyond a few tens of megaparsecs, even Hubble and Webb cannot split a galaxy into individual stars. Surface brightness fluctuations use that blur. A nearby elliptical galaxy has a grainy look in an image, because each pixel contains a small number of stars and a single bright red giant makes it noticeably brighter than its neighbor. A far-away galaxy looks smooth, because each pixel averages over more stars. The size of the graininess scales with distance, and the method works best for old elliptical galaxies and the bulges of lenticular galaxies, which have simple, dust-poor structures. It is calibrated against galaxies whose distances come from Cepheids or the red giant tip, and it reaches roughly 100 megaparsecs (Surface brightness fluctuation).
Rung 7: Type Ia supernovae
A Type Ia supernova happens when a carbon-oxygen white dwarf, fed by a companion or merging with another white dwarf, nears the Chandrasekhar mass of about 1.44 solar masses and ignites in a runaway thermonuclear explosion (Type Ia supernova). Because the trigger is a fixed mass limit, peak brightness is fairly consistent: a typical absolute visual magnitude of about -19.3, roughly 5 billion times the Sun. For a deeper look at how stars blow up, see our overview of supernova types.
"Fairly consistent" is not "identical." In 1993, Mark Phillips showed that the brighter explosions fade more slowly after peak. Correct for that decline rate (and for color), and Type Ia supernovae yield relative distances good to about 7 percent each. With a few dozen well-measured events in galaxies that also host Cepheids or TRGB stars, astronomers calibrate the supernova brightness, then apply it to events deep into the Hubble flow.
Why supernovae dominate the top of the ladder
They are bright enough to see across huge distances. The Pantheon+ compilation contains 1,701 light curves from 1,550 distinct Type Ia supernovae, with redshifts from 0.001 to 2.26 (Brout et al., 2022). At the high end, the light we see left those explosions more than 10 billion years ago.
The discovery that changed cosmology
Supernova brightness was also the route to dark energy. In 1998 two competing teams, one led by Saul Perlmutter and the other by Brian Schmidt and Adam Riess, reported that distant supernovae were dimmer than a decelerating universe predicted, meaning the expansion was speeding up. The three shared the 2011 Nobel Prize in Physics (Nobel Prize, 2011). Our explainer on dark energy and the accelerating universe covers that story.
Rung 8: Redshift, the Hubble flow, and the Hubble constant
The last rung changes the question. Once you have distances to a few hundred supernovae in the smooth expansion, you can compare each distance to the galaxy's redshift, the stretching of its light that reveals how fast it recedes. The slope of the line is the Hubble constant, H0, in kilometers per second per megaparsec.
Georges Lemaître derived the relation in 1927, and Hubble published his version in 1929, using distance estimates for a few dozen galaxies, some of them from Cepheids. The value he got was about 500 km/s/Mpc, roughly seven times too high because of errors in his distance calibration (Hubble's law). For the original data and its limits, see Hubble's 1929 redshift observation and our explainer on Hubble's law and the expanding universe.
Two practical points matter.
Nearby galaxies cheat. Galaxies also move through space, pulled by their neighbors. These "peculiar velocities" scatter nearby data, and the Hubble flow only emerges at distances where recession dominates. That is why supernovae, which reach far, do the final job even though Cepheids do the calibration.
Small errors scale up. A galaxy at 100 megaparsecs recedes at about 7,300 km/s if H0 is 73 and 6,740 km/s if H0 is 67.4. An 8 percent difference in H0 is an 8 percent difference in every distance computed from redshift, which is why the quarrel over this number touches all of cosmology.
A ruler from the early universe: the CMB and baryon acoustic oscillations
All the methods above are "bottom-up": start near, work outward. There is also a "top-down" route that uses the early universe as a ruler.
Before about 379,000 years after the Big Bang, matter and light were locked in a hot plasma, and sound waves traveled through it. When the plasma cooled into atoms, the waves froze in place, leaving a preferred separation, the sound horizon, which is roughly 150 megaparsecs across today. Galaxies show a slight excess of pairs at that separation, a pattern called baryon acoustic oscillations (BAO) first reported by the Sloan Digital Sky Survey and the 2dF Galaxy Redshift Survey in 2005 (Baryon acoustic oscillations). The same scale is imprinted in the temperature pattern of the cosmic microwave background, the afterglow of the early universe.
The size of a ruler is known in physical units from theory, and its apparent size on the sky gives the distance. Feed the Planck satellite's 2018 CMB measurements into the standard six-parameter ΛCDM model (a flat universe with dark energy and cold dark matter) and the result is H0 = 67.4 ± 0.5 km/s/Mpc (Planck 2018 results).
The Hubble tension, in numbers
The two approaches should agree, and they do not.
| Measurement | Year | H0 (km/s/Mpc) | Approach |
|---|---|---|---|
| Planck CMB with ΛCDM | 2018 | 67.4 ± 0.5 | Early universe (top-down) |
| Freedman et al., JAGB (JWST) | 2024 | 67.80 ± 2.17 (stat) ± 1.64 (sys) | Distance ladder, carbon stars |
| Freedman et al., TRGB (HST and JWST) | 2024 | 70.39 ± 1.22 (stat) ± 1.33 (sys) ± 0.70 (SN) | Distance ladder, red giant tip |
| GW170817 standard siren | 2017 | 70.0 (+12.0, -8.0) | Gravitational waves, no ladder |
| SH0ES Cepheids and 42 supernovae | 2022 | 73.04 ± 1.04 | Distance ladder, Cepheids |
| H0LiCOW six lensed quasars | 2020 | 73.3 (+1.7, -1.8) | Lensing time delays |
The SH0ES result differs from the Planck prediction at 5 sigma (Riess et al., 2022). Five sigma is the threshold particle physicists use for discovery, which is why the gap is taken seriously.
What the JWST check found
A natural worry was that Hubble's near-infrared photometry of Cepheids was contaminated by crowding. In 2024, SH0ES observed more than 1,000 Cepheids with JWST in NGC 4258 and five supernova hosts. JWST's sharper vision found no significant difference from the HST distances, a formal difference of -0.01 ± 0.03 magnitudes. The paper rejected unrecognized, distance-dependent crowding as the cause of the tension at 8.2 sigma (Riess et al., 2024).
That settled one specific objection. It did not end the debate. The Freedman team concluded that its results are consistent with standard ΛCDM, without new physics. The two groups use different calibrations, sample choices, and error treatments, and they stand about 3 km/s/Mpc apart. Our companion piece on the Hubble constant tension covers the proposed fixes in detail.
Checks that skip the ladder
Because the dispute could hide in some rung, researchers try routes that avoid it.
Gravitational wave standard sirens. A merging neutron-star pair emits gravitational waves whose strength depends on distance in a way theory predicts. The waves give distance directly, and the optical afterglow gives the host galaxy's redshift. The first event, GW170817, yielded H0 = 70.0 with an uncertainty of +12 and -8 km/s/Mpc (LIGO, Virgo, et al., 2017). Consistent with both camps, far too imprecise to choose. For background on the waves themselves, see gravitational waves explained.
Lensed quasars. When a galaxy's gravity splits the image of a background quasar, brightness changes arrive at different times in each image because the light paths differ in length. Those time delays encode distance. Six lensed quasars analyzed by the H0LiCOW team gave H0 = 73.3 (+1.7, -1.8) km/s/Mpc, a result in 3.1 sigma tension with Planck on its own (Wong et al., 2020). The method leans on models of the lens galaxy's mass, which is its main systematic risk.
Common misconceptions about measuring distances
"Astronomers just assume how bright things are." Not quite. Standard candles are calibrated against geometry. Parallax, eclipsing binaries, and masers are direct geometric measurements; the brightness rungs sit on top.
"The Hubble tension proves the Big Bang is wrong." No. The tension is between two measurements of the expansion rate, one from the early universe's imprint and one from local objects. It might point to new physics, or to an unrecognized error. The Big Bang model's core evidence, including the CMB itself, is unaffected.
"A bigger telescope automatically fixes it." JWST improved photometry a lot, but the dispute turns on calibration choices, sample selection, and how errors combine. Better data narrow the questions rather than eliminating them.
"Light-years are the natural unit." Professionals favor parsecs and megaparsecs because the parallax formula is d = 1/p with no extra constant. One parsec is about 3.26 light-years, and a megaparsec is about 3.26 million. For a sense of how these distances stack up against the whole cosmos, see how big the universe is.
Frequently asked questions
Q: How do astronomers measure the distance to the nearest stars? A: They use trigonometric parallax. As Earth orbits the Sun, a nearby star seems to shift against distant background stars. The star's distance in parsecs is the reciprocal of the shift in arcseconds. Proxima Centauri's parallax of 0.7685 arcseconds gives 1.301 parsecs, about 4.24 light-years.
Q: What is a standard candle? A: A standard candle is an object whose true luminosity is known from physics or calibration, so that its apparent brightness gives its distance. Cepheid variables, RR Lyrae stars, and Type Ia supernovae are the main examples. Each is calibrated against geometric distances.
Q: Why are Cepheid variables so important for measuring the universe? A: Their pulsation period tracks their luminosity, as Henrietta Leavitt found in the early 1900s. They are bright enough to see in galaxies tens of megaparsecs away, and they occur in the same galaxies as Type Ia supernovae, so they calibrate the supernovae.
Q: What is the Hubble tension? A: It is the mismatch between the expansion rate predicted from the early universe and the one measured locally. The Planck CMB analysis gives 67.4 ± 0.5 km/s/Mpc, while the SH0ES Cepheid and supernova ladder gives 73.04 ± 1.04, a difference of 5 sigma. The cause is unknown.
Q: How far can the distance ladder reach? A: Parallax works to several kiloparsecs, Cepheids and the red giant tip to tens of megaparsecs, and Type Ia supernovae to redshifts beyond 2, where their light has traveled over 10 billion years. Beyond that, cosmologists rely on the CMB and galaxy clustering.
Q: Can the Hubble constant be measured without the distance ladder? A: Yes. Gravitational-wave standard sirens, lensed-quasar time delays, and the CMB all give H0 without Cepheids or supernovae. The sirens are still imprecise, the lensing depends on mass models, and the CMB result assumes ΛCDM is correct.
The takeaway
The distance ladder is not one ruler but a series of cross-checks, and its strength is redundancy. At the base, geometry fixes the scale to about 1 percent through parallax, eclipsing binaries, and masers. Above that, three independent kinds of stars, Cepheids, red giants, and carbon stars, carry the scale to galaxies that host supernovae. The surprising part is that this redundancy has not produced agreement. Two methods that both pass their internal checks point to H0 values about 5 km/s/Mpc apart, and the JWST observations have closed off one of the most obvious ways for the ladder to be wrong. Either the ladder hides a subtle shared flaw, or the standard cosmological model is missing something. Measuring distances turned out to be a way of testing the universe's own blueprint.
Related Reading
Follow new articles
Add SciHub101 to your feed reader to see new science and technology stories.
About the Author
SciHub101 is an independent science and technology publication founded and edited by Buğra Sözeri, a software engineer and app developer based in Türkiye. AI tools assist with drafting and research. Source documentation in the existing archive is uneven, and articles are being reviewed and corrected. The Editorial Team byline identifies editorial responsibility; it does not certify specialist or independent human review. Where we compare products, anything built by our own team is labelled as such — see the editorial guidelines and About page for how corrections and disclosures work.
Related Articles
What Are Cataclysmic Variables, Novae, and Dwarf Novae?
Cataclysmic variables are close binary stars in which a white dwarf pulls gas off a companion. The result is outbursts that range from dwarf novae flaring every few weeks to classical novae that brighten by up to a million times. This article explains the physics, the period gap, and the famous systems.
What Is the Heliosphere? The Sun's Protective Bubble in Space
The heliosphere is a vast bubble of solar wind plasma around the Sun, reaching roughly 120 AU toward the direction we are moving. It deflects a large share of low-energy galactic cosmic rays. Voyager 1 crossed its outer boundary, the heliopause, in 2012 and Voyager 2 followed in 2018.
Hubble's 1929 Redshift Observation: The Data That Proved the Universe Expands
Hubble's 1929 redshift observation tied galaxy speed to distance. See what the 24-galaxy data showed, why his constant was off 7x, and the tension today.
The Hubble Constant Tension: A Crisis in Cosmology
Two carefully checked ways of measuring how fast the universe expands disagree by roughly 8 to 10 percent, a gap near 5 sigma. Either a hidden error remains, or standard cosmology is incomplete.
What Is Hubble's Law? How We Discovered the Universe Is Expanding
In 1929, Edwin Hubble showed that galaxies recede from us at speeds proportional to their distance, the first direct evidence that the universe is expanding. The slope of that relation, the Hubble constant, is still debated: two precise methods disagree by about 5 sigma.
How Old Is the Universe — And How Do We Actually Know?
The universe is 13.8 billion years old. But how do we know? Three independent methods — the cosmic microwave background, the oldest stars, and Hubble's constant — converge on the same answer. Here's the evidence.